High-Resolution High-Speed LIBS Microscopy
Laser-induced breakdown spectroscopy (LIBS) imaging instruments typically utilize lasers with repetition rates below 100 Hz since in most cases this regime provides a good balance of sampling frequency and laser pulse energy. However, measuring large sample areas of a several cm2 with high spatial resolution (<10 μm), at this frequency rate would be very time consuming since millions of spectral data points need to be collected in order to create a high-resolution image (3 h–15 h per cm2). In this work, we explore the approach to reduce, the acquisition time for high resolution LIBS imaging, or so-called μ-LIBS imaging, by using a laser operating in the kHz pulse repetition frequency (PRF) range. As a result, we describe and demonstrate a μ-LIBS imaging microscope which can image >6 cm2 sample areas with about 10 μm resolution in significantly shorter time (<20 min/cm2). The developed system opens a potential for variety of application fields where knowledge of elemental composition and elemental distribution is needed to perform conclusive analysis.
LIBS imaging is, at its core, based on laser-induced breakdown spectroscopy (LIBS), a spectroscopic technique that utilizes laser ablation for identification of the atomic elements constituting a material under investigation (1,2). Plasma is generated when a small fraction of the material is ablated from the surface by a short laser pulse (typically nanoseconds in duration). Plasma consists of excited atoms and ions which upon relaxation as the plasma cools down emit light of specified emission lines that can be associated with the elements in ablated material. In this way, LIBS is a very powerful analytical technique to determine the elemental composition of a wide range of samples.
The principle of μ-LIBS imaging is based on raster scanning of a sample with a focused laser beam, so that a LIBS spectrum can be acquired in a single laser pulse or single shot for each spatial position across the sample surface. A LIBS spectrum has several emission lines, where lines without interference or self-absorption are selected for LIBS analysis. Selected spectral lines within the collected LIBS spectra are element- specific and can be used for reconstruction of elemental maps or the distribution of chemical elements within the analyzed sample area (3–9). This μ-LIBS imaging technique allows not only qualitative analysis of a sample but can also provide the information about quantitative content. Quantitative analysis reflected in image contrast can be carried out by associating an intensity of spectra with concentration of elements through univariate or multivariate models (9,10).
In LIBS systems, the choice of the laser used for material ablation plays an important role. LIBS measurement repeatability can be directly linked to the laser performance as the plasma generation relies on non-linear processes. Any fluctuations of laser parameters such as pulse energy, pulse duration, and beam quality, could produce fluctuations in the material ablated mass, plasma temperature, and electron density, which would be reflected in the emission spectrum of the plasma and could lead to analytical inaccuracies. Laser performance is even more critical in μ-LIBS imaging, where raster scanning of the sample typically means using a single laser pulse per acquisition data point. The quality of the laser beam is associated with the ability to focus the laser beam tightly into a spot which defines the spatial resolution of the system, and so the minimum pixel size of an image. The repetition rate of the laser defines the maximum acquisition/scanning speed available. This parameter may be less important in many LIBS applications, where a few hundred laser shots are needed to perform the analysis. However, in the case of high-resolution μ-LIBS imaging over a significant sample area, up to 1 million spectra per cm2 might be collected, then, for example, it might take from 3–15 h to record an area of a cm2 with μm-resolution with 10–40 Hz laser (7).
In this work, a LIBS system is proposed for high-speed μ-LIBS imaging with about 10 μm resolution using a laser operating at 1 kHz repetition rate which in turn allows an acquisition speed of < 20 min/cm2. The capability of the system to perform fast LIBS analysis over large samples complemented with spatial distribution of elements within the analyzed area opens a variety of application fields including biomedical and geological material analysis, as well as industrial applications, for example, the study of lithium distribution in Li-batteries that is crucial for batteries’ lifetime. In this paper, we focused on the advantages of the developed LIBS system in the scope of characterization of geological samples.
Experimental Setup
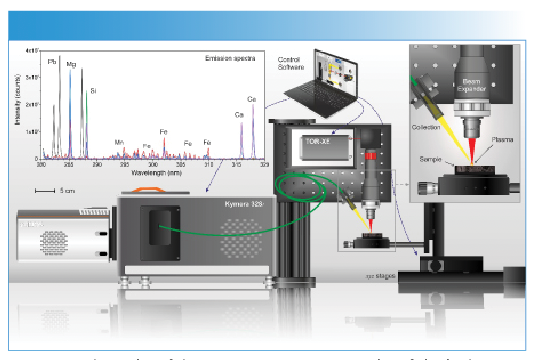
The proposed µ-LIBS imaging system (Figure 1) is a custom-made LIBS microscope based on a compact nanosecond Nd:YAG passively Q-switched ring-cavity 1064 nm laser (Cobolt), with a pulse energy of 0.5 mJ and a pulse duration of 2.5 ns. The plasma emission lines are recorded with a spectrometer (Kymera 328i from Andor Technology) coupled to a scientific complementary metal oxide semiconductor (sCMOS) camera (IStar from Andor Technology). The high-quality laser beam (TEM00) is perpendicularly incident on the sample after passing through a beam expander (BE10-1064, Thorlabs) and is focused down to a 10 µm spot size on the sample surface using a 5x-microscope objective (LMH-5X-1064, Thorlabs). The plasma emission generated by the laser pulse, is collected by an optical fiber and fed into the spectrometer which is coupled to the sCMOS camera. The spectrometer is equipped with a 1200 l/mm blazed at 300 nm, that provides a spectral resolution of approximately 0.15 nm within a 40 nm detection range in the ultraviolet (UV). Samples are placed on a XYZ motorized stage with maximum achievable speed of 100 mm/s and position accuracy of better than 1 µm.

, quartz (green), pyrite (red), carbonate (violet), and silicates (blue).")
FIGURE 1: Schematics of the setup. Inset: Some examples of single shot LIBS spectra in the spectral range of 280 to 320 nm obtained from various mineral phases: galena (black), quartz (green), pyrite (red), carbonate (violet), and silicates (blue).
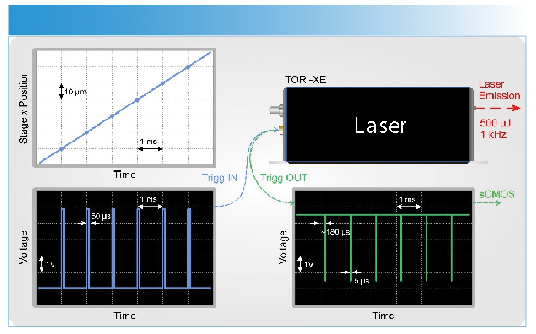
The measurements were performed at room temperature under ambient air-pressure. The laser and the XYZ stages were controlled with a custom LabVIEW software developed at the Light and Matter Institute (iLM), allowing an automated spectral acquisition of any selected sample region with a preset lateral resolution. The raster scanning of the sample was performed by moving the stage at a speed of 10 mm/s with the step size of 10 µm, that equals to 1 kHz operation frequency. The laser was operated in an external trigger mode triggered by the pulse originated from the moving stage at 1 kHz. At each stage position, the laser emitted an optical pulse and sent a digital signal to trigger spectrum acquisition of the sCMOS camera. The trigger diagram is shown in the Figure 2.


FIGURE 2: Diagram showing the laser pulse and image acquisition trigger sequence. The laser emitted an optical pulse and sent a digital signal to trigger spectrum acquisition of the sCMOS camera.
Performing a spectral acquisition at a kHz rate with a matrix detector is challenging. The sCMOS camera (iStar Andor Technologies) needs to be configured to operate in a vertical binning mode with a height of 35 pixels to reach a kHz acquisition rate. The camera had 2560 pixels in each horizontal array (no horizontal binning), that produced quite a significant amount of data per each acquisition (typically <10 GB for a million of spectra). Thus, high RAM memory of the PC is required and, in addition, a USB 3.0 interface on the camera to ensure sufficient speed for data transfer.
Data Processing
A custom LabVIEW-based software developed at iLM was used to reconstruct the µ-LIBS images to show the distribution of chemical elements present in the sample. The software plots the intensities of element-specific emission lines from the collected LIBS spectra at each spatial coordinate.
The collected spectra were averaged over the whole spectral dataset to obtain an overview of the spectral structure of the sample, allowing for identification of the interference-free lines used for further analysis (10). Due to the multi-elemental nature of samples, a few spectral lines of one element might interfere or spectrally overlap with some spectral lines of another element, and, thus, can hinder the presence of one of the elements. Therefore, the selection of the interference-free lines for analysis is a crucial step which can be performed with the use of masks associated with each mineral phase of the sample (5). Once the spectral lines were assigned to the chemical elements they characterize, algorithms to extract the net intensity of the lines by considering the intensity of the baseline to generate a 2D matrix (relative abundance image) were applied. Different procedures for LIBS signal identifications have been discussed in more details in the literature (5,9–11).
Experimental Results
Analytical Validation on an Aluminum Reference
In order to access the validity of the system and its detection limits, a reference sample (P9615, Techlab) was used. The P9615 sample was an aluminum-based cylinder doped with several minor elements such as Si (8.39%) and Mg (0.0142%). We analyzed an area of 1 cm2 with 10 µm resolution, resulting in a 1000 x 1000 data array. The net intensities of the emission lines Al I (305.90 nm) and Si I (288.16 nm) were used to reconstruct images of aluminum and silicon distributions within the sample (Figure 3).

 aluminum at 305.9 nm, (b) silicon at 288.1 nm, and (c) merged Al and Si. (a–c) images: (top) full image and (bottom) close-up images are shown. (d) The average (black) and RSD (red) spectra are shown in the right inset panel. The spectral lines indicated by an arrow (Mg II and Al I) were used to evaluate the LoD and the RSD values.")
FIGURE 3: LIBS imaging obtained on a P1596 aluminum reference sample: (a) aluminum at 305.9 nm, (b) silicon at 288.1 nm, and (c) merged Al and Si. (a–c) images: (top) full image and (bottom) close-up images are shown. (d) The average (black) and RSD (red) spectra are shown in the right inset panel. The spectral lines indicated by an arrow (Mg II and Al I) were used to evaluate the LoD and the RSD values.
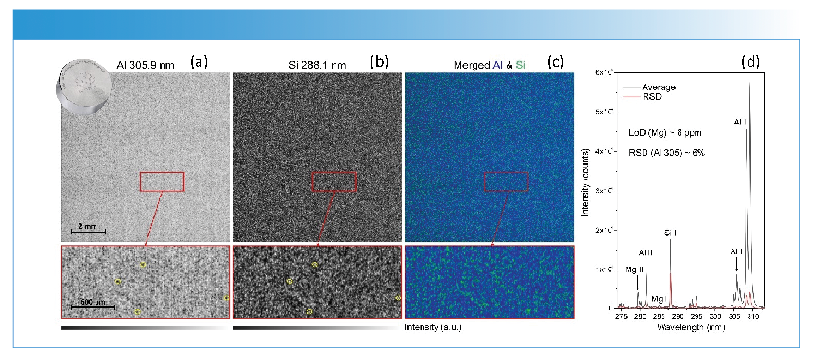
The measurement accuracy was evaluated by applying the relative standard deviation (RSD) to the signal at 305 nm for the Al I spectral line. The 305 nm emission line was chosen over more intense 308 nm/309 nm doublet since the latter suffers from self-absorption. The reference sample is not structurally homogenous at the scale of the laser spot size (10 µm) as shown in the enlarged images where inhomogeneities are highlighted by yellow circles. The sample inhomogeneity introduces additional inaccuracy in the data, and, thus, which adds to the estimated RSD value (in this case, 6%) (Figure 3 inset). This calculated RSD value is still considered relatively good for LIBS analysis, especially for a single-shot acquisition. However, more uniform sample is needed for more accurate assessment of the RSD value.
The system limits of detection (LoD) were evaluated for Mg, using the intensity ratio method. The intensity of the Mg I spectral line at 279.5 nm of a known concentration was compared to the intensity level of the base line (for a single spectrum). From the averaged spectrum, the LoD was approximated with the 3σ method, resulting is a value of 6 µg/g for Mg, which is considered to be sufficient for many applications.
LIBS Imaging of a Rock Sample
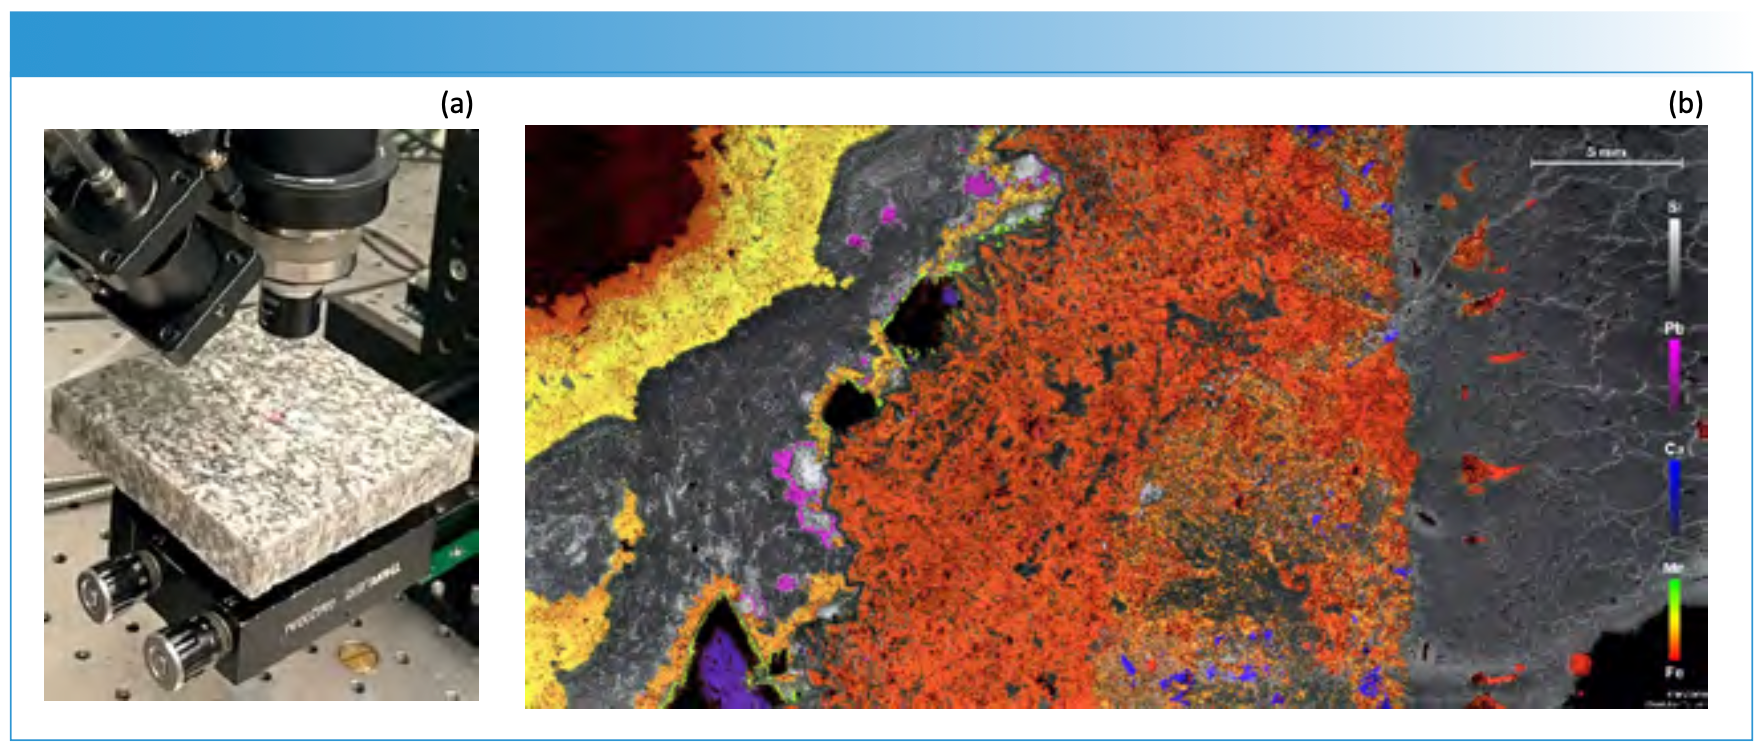
To demonstrate imaging capabilities of the µ-LIBS imaging microscope over large sample areas, a rock sample with an area of about 6 cm2 was used. The sample (Figure 4a) was polished with SiC paper (QATM, P240, P600, P1200) under water solvent to obtain a planar and clean section. The measurements were performed according to the procedure discussed above and were completed in less than 2 h. The reconstructed µ-LIBS image in Figure 4b shows the distribution of silicon (Si) for quartz, lead (Pb) for galena, calcium (Ca) and magnesium (Mn) for carbonate, and iron (Fe) for pyrite in a sample with 10 µm resolution. In comparison, the sample collection time for a laser with a repetition rate of around 100 Hz would have been about 20 h.

 Photo of a sample placed under the μ-LIBS microscope; (b) Reconstructed μ-LIBS image showing the distribution of silicon (Si), lead (Pb), calcium (Ca), magnesium (Mn), and iron (Fe) in a sample. Color key to image is given on righthand side of image. Spatial scale indicator is indicated in the upper right corner of image.")
FIGURE 4: (a) Photo of a sample placed under the μ-LIBS microscope; (b) Reconstructed μ-LIBS image showing the distribution of silicon (Si), lead (Pb), calcium (Ca), magnesium (Mn), and iron (Fe) in a sample. Color key to image is given on righthand side of image. Spatial scale indicator is indicated in the upper right corner of image.
Conclusion and Perspectives
In this work, a high-speed µ-LIBS imaging system (µ-LIBS microscope) was presented capable of reconstructing elemental compositional images of large samples with high resolution. We demonstrated that the system could provide elemental compositional images with 10 µm resolution over a 6 cm² sample area in a dramatically reduced time of <2 h which equates to <20 min/cm2. We verified the analytical capabilities of the system, such as limits of detection (6 µg/g for Mg) and measurement accuracy (6%), by using an aluminum-based reference sample doped with magnesium Mg. A drastically reduced time for material content analysis of relatively large sample area with µm-resolution can ultimately provide unique capabilities and opens new perspectives for LIBS imaging and LIBS analysis in many application fields, and in geological material analysis specifically.
Acknowledgments
This work was partially supported by the French region Rhônes Alpes Auvergne (Optolyse, CPER2016), the French “Agence Nationale de la Recherche” (ANR-22-CE27-0017“MEMOar” and ANR-20-CE17-0021 “dIAg-EM), and the French government “Plan de Relance” and “France 2030” (ANR-22-PEXD-0014, “Libelul”). In addition, we gratefully acknowledge Jean Michel Laurent, Shayne Harrel, Antoine Varagnat from Andor Technologies and Håkan Karlsson from Hübner Photonics for fruitful discussions.
References
(1) Cremers, D. A.; Radziemski, L. J. Handbook of Laser-Induced Breakdown Spectroscopy; Wiley, 2006.
(2) Miziolek, A. W.; Palleschi, V.; Schechter, I. Laser-Induced Breakdown Spectroscopy: Fundamentals and Applications, Cambridge University Press, 2006.
(3) Cáceres, J. O.; Pelascini, F.; Motto-Ros, V. et al. Megapixel Multi-Elemental Imaging by Laser-Induced Breakdown Spectroscopy, a Technology with Considerable Potential for Paleoclimate Studies. Sci. Rep. 2017, 7, 5080. DOI: 10.1038/s41598-017-05437-3
(4) Rifai, K.; Doucet, F.; Özcan, L.; Vidal, F. LIBS core imaging at kHz speed: Paving the Way for Real-Time Geochemical Applications. Spectrochim. Acta, Part B 2018, 150, 43−48. DOI: 10.1016/j.sab.2018.10.007
(5) Fabre, C.; Damien, D.; Moncayo, S.; Pelascini, F.; Trichard, F.; Lecomte, A.; Bousquet, B.; Cauzid,J.; Motto-Ros, V. Elemental Imaging by Laser-Induced Breakdown Spectroscopy for the Geological Characterization of Minerals. Spectrochim. Acta, Part B 2018, 33, 1345–1353. DOI: 10.1039/C8JA00048D
(6) Fabre, C. Advances in Laser-Induced Breakdown Spectroscopy Analysis for Geology: A Critical Review. Spectrochim. Acta, Part B 2020, 166, 105799. DOI: 10.1016/j.sab.2020.105799
(7) Jolivet, L.; Leprince, M.; Moncayo, S.; Sorbier, L.; Lienemann, C.-P.; Motto-Ros, V. Review of the Recent Advances and Applications of LIBS-Based Imaging. Spectrochim. Acta, Part B 2019, 151, 41–53. DOI: 10.1016/j.sab.2018.11.008
(8) Busser, B.; Moncayo, S.; Coll, J.-L.; Sancey, L.; Motto-Ros, V. Elemental Imaging Using Laser-Induced Breakdown Spectroscopy: A New and Promising Approach for Biological and Medical Applications. Coordination Chem.Rev. 2018, 358, 70–79. DOI: 10.1016/j.ccr.2017.12.006
(9) Gardette, V.; Motto-Ros, V.; Alvarez-Llamas, C.; Sancey, L.; Duponchel, L.; Busser, B. Laser-Induced Breakdown Spectroscopy Imaging for Material and Biomedical Applications: Recent Advances and Future Perspectives. Anal. Chem. 2023, 95 (1), 49–69. DOI: 10.1021/acs.analchem.2c04910
(10) Moncayo, S.; Duponchel, L.; Mousavipak, N.; Panczer, G.; Trichard, F.; Bousquet, B.; Pelascini, F.; Motto-Ros, V. Exploration of Megapixel Hperspectral LIBS Images Using Principal Component Analysis. J. Anal. Atom. Spectrom. 2018, 33 (2), DOI: 10.1039/C7JA00398F
(11) Motto-Ros, V.; Moncayo, S.; Trichard, F.; Pelascini, F. Investigation of Signal Extraction in the Frame of Laser Induced Breakdown Spectroscopy Imaging. Spectrochim. Acta, Part B 2019, 155, 127–133. DOI: 10.1016/j.sab.2019.04.004
A. Tercier, C. Alvarez-Llamas, S. Hermelin, C. Dujardin, and V. Motto-Ros are with the Institut Lumière Matière UMR 5306 at the Université de Lyon, in Villeurbanne, France. A. Tercier, V. Motto-Ros, and F. Trichard are with Ablatom S.A.S., in Villeurbanne, France. E. Vasileva is with Cobolt AB, a part of Hübner Photonics, in Stockholm, Sweden. C. Fabre is with GeoRessources at the Université de Lorraine, in Vandoeuvre-les-Nancy, France. B. Soula is with Optoprim, in Vanves, France. Direct correspondence to: elena.vasileva@hubner-photonics.com, or vincent.motto-ros@univ-lyon1.fr●


Laser Ablation Molecular Isotopic Spectrometry: A New Dimension of LIBS
July 5th 2012Part of a new podcast series presented in collaboration with the Federation of Analytical Chemistry and Spectroscopy Societies (FACSS), in connection with SciX 2012 — the Great Scientific Exchange, the North American conference (39th Annual) of FACSS.

LIBS System Built on Microjoule High PRF Laser Identifies Aluminum Alloys for Recycling Potential
January 2nd 2024Differing grades of aluminum alloys have large differences in their composition, especially when it comes to trace elements, emphasizing the need for them to be evaluated for means of production, use, and recycling.


