ICP-OES as a Viable Alternative to ICP-MS for Trace Analysis: Meeting the Detection Limits Challenge
This month’s column focuses on the applicability of inductively coupled plasma–optical emission spectroscopy (ICP-OES) fitted with a high efficiency nebulizer as a real-world alternative to ICP–mass spectrometry (ICP-MS) for certain applications. It is well-recognized that ICP-MS is the most widely used and recommended technique for ultra trace element analysis because it offers extremely high sensitivity. However, if the necessary sensitivity is achieved, an ICP-OES instrument can be a viable option because it is simpler to operate and less costly to maintain than an ICP-MS instrument. In this study, the sensitivity of ICP-OES was significantly enhanced by using a highly efficient yet robust sample introduction system. The increased efficiency was accomplished by employing an external impact surface positioned close to the nebulizer gas orifice at an optimized angle. The robustness by a non-concentric design was achieved by separating the gas and sample channels throughout the entire body of the nebulizer. The results of applying this approach to the ICP-OES analysis of a select group of sample matrices and meeting the required challenging detection limits are demonstrated.
Generally, inductively coupled plasma–mass spectrometry (ICP-MS) and inductively coupled plasma–optical emission spectroscopy (ICP-OES) are complementary techniques; each has its benefits and limitations. Although ICP-MS is more sensitive, ICP-OES can handle approximately 10 times higher amounts of total dissolved solids (TDS). This corresponds to the lower dilution factors applied in the ICP-OES analyses. When calculated on the undiluted sample basis, the detection limits may end up being comparable to the detectability power achieved by ICP-MS. Even though modern ICP-MS instrumentation is said to allow direct analysis of samples with up to 25% of TDS without prior dilution, such analysis is accomplished by employing a carrier gas dilution module. Because the samples are still being diluted online by the argon carrier gas within the sample introduction module of the ICP-MS rather than externally by the aqueous diluent in many cases, the detection limits are not practically improved.
The ability of ICP-OES to handle a higher amount of TDS alone is usually not enough to meet the application requirements for the minimum detectable levels. That is why a key factor was to achieve the necessary sensitivity level by focusing on the sample introduction area. Introduced in 1976 (1), the most commonly used Meinhard or concentric nebulizers are usually selected when the lowest detection limits are required (2,3). A significant sensitivity boost is offered by ultrasonic nebulization and desolvating nebulizer systems, but both accessories are quite complex in operation, add significant costs, and the results depend on the different volatilities of some analyte species formed.
To meet the demand for increased sensitivity, the selected approach focused on improving nebulization efficiency by utilizing a principle like the one applied in the Babington V-Groove type nebulizer, introduced by Giess, McKinnon, and Knight in 1981, and named GMK after its three authors (3). A non-concentric design includes a glass impact bead located next to the gas nozzle. The quality of the initially created aerosol is significantly improved because finer particles were produced because of the impact action (3).
Experimental
Exploring this principle further, the increase of the nebulization efficiency of the OptiMist Vortex nebulizer was accomplished by employing an external impact surface positioned very close to the gas orifice at an optimized angle. The sample channel’s internal diameter (i.d.) was kept relatively large at approximately 0.75 mm. The gas and sample channels were separated throughout the entire body of the nebulizer, which, in combination with a large sample channel i.d., provides resistance to blockages. Unlike the GMK design, which relies solely on gravity force, a thin film is formed on the surface of the OptiMist Vortex similar to the thin film induction nebulizer (3.4). This facilitates gas–liquid interaction and more efficient energy transfer. Because fine aerosol is deflected by the impact surface, the nebulizer is oriented at approximately 90° to the vertical plane within the spray chamber (Figure 1).

.")
FIGURE 1: OptiMist Vortex nebulizer and cyclonic spray chamber as described in the text (Courtesy of Texas Scientific Products).
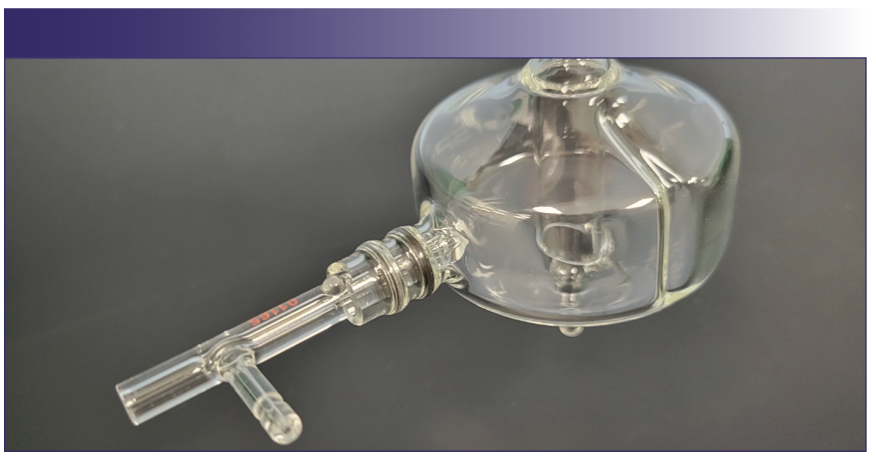
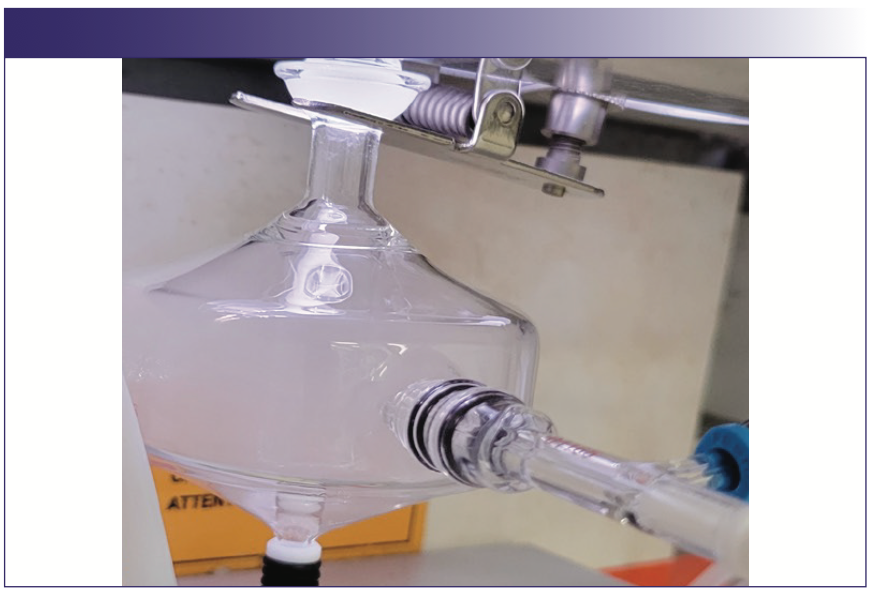
This design in combination with a baffled cyclonic spray chamber provides an enhancement of the ICP-OES sensitivity on average by about a factor of two as compared to the most efficient concentric nebulizers. The density of the aerosol is illustrated in Figure 2.


FIGURE 2: The dense aerosol produced by the vortex nebulizer and cyclonic spray chamber.
Applications
The suggested approach applies to a wide range of sample types. Here are some selected examples where challenging detection limits were required.
High Purity Materials
Trace analysis of high-purity materials is one such application area. Some of the elements of interest (for example, calcium, magnesium, manganese, sodium, and potassium) can be detected at the single parts per trillion (ppt) range by modern, axially viewed ICP-OES spectrometers. However, the analysis for a few of the difficult analytes, such as bismuth, tellurium, selenium, and antimony, usually need more sensitive graphite furnace atomic absorption (GFAA) or ICP-MS (5,6).
High-purity metals, such as indium, copper, and aluminum, are widely used by the semiconductor industry. The purity levels are more demanding, requiring 99.999%, 99.9999%, or even higher. To meet such high purity grade requirements, the impurities have to be analyzed at extremely low levels of 0.5 ppm in the solid material.
In this study, the analysis of high-purity copper was performed on an axially viewed ICP-OES instrument (Spectro Arcos). Additional gas flow was introduced through the special adapter attached between the spray chamber and the torch to reduce the sample deposition within the torch injector. To minimize the dilution factor, the samples were prepared as a 5% copper solution. Then, 0.500 g of the copper sample was digested with 5.0 mL of 50% v/v trace metal grade nitric acid and brought up to the 10 mL volume to a final dilution factor of 20. The calibration was made with fully matrix-matched standards using high-purity copper digested the same way and spiked at the different levels of 20, 200, and 2000 ppb.
Examples of the calibration curves for critical elements bismuth, tellurium, selenium, and antimony, are shown in Figure 3.

 bismuth, (b) tellurium, (c) selenium, and (d) antimony in a 5% copper matrix. Axis labels are Concentration (ppm) for abscissa and Intensity (cps) for ordinate. Regression statistics for each calibration curve are given in grey boxes. Data courtesy of Spectro Ametek.")
FIGURE 3: Calibration curves for elements (a) bismuth, (b) tellurium, (c) selenium, and (d) antimony in a 5% copper matrix. Axis labels are Concentration (ppm) for abscissa and Intensity (cps) for ordinate. Regression statistics for each calibration curve are given in grey boxes. Data courtesy of Spectro Ametek.
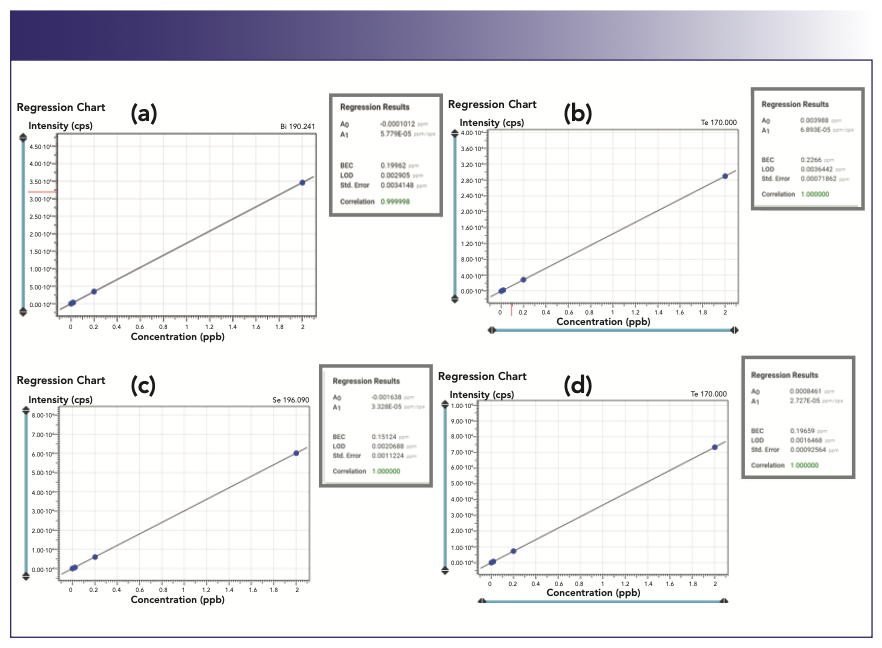
The detection limits were estimated in a single ppb range in the 5% copper solution, which corresponds to 0.06 to 0.100 ppm in the solid copper matrix.
Heavy Metals in Medical Cannabis
Another challenging application for ICP- OES is related to the recent developments in the field of medical and recreational use of hemp or cannabis products, which created the need for testing these products for toxic elements. Maximum allowable limits (MAL) for these toxic elements are currently set by the individual states where cannabis is legal. For example, in California, Colorado, and Massachusetts, the required levels for arsenic, cadmium, mercury, and lead, referred to as the “big four,” are extremely low, so ICP-MS became the widely used and recommended analytical technique for this application.
From the analytical point of view hemp and cannabis are plants with unique chemical composition. This example was selected because the suggested approach can apply to any analyses involving plants, botanicals, environmental, or food materials where low detection limits are required.
It has been shown that the sensitivity needed to meet the MAL for the four toxic elements in cannabis products can be reached by ICP-OES with an ultrasonic nebulizer (7). However, as already mentioned, it complicates the analysis, makes it more difficult to run on a routine basis, and makes the analysis more costly.
The suggested analytical approach included the combination of the following three key components:
- High-efficiency sample introduction system described earlier that improves instrument detection power by approximately a factor of two.
- Digestion and sample preparationmethodology optimized for reaching maximum completeness of the organic matrix decomposition at a minimum dilution factor.
- Creative approach to close matrix-matching of the calibration standards.
Of the four toxic elements to be detected at the low level, arsenic and lead were the most challenging for two reasons: the ICP-OES instrument detection limits were in the single ppb range and both analytes were affected by spectral interferences from the matrix components.
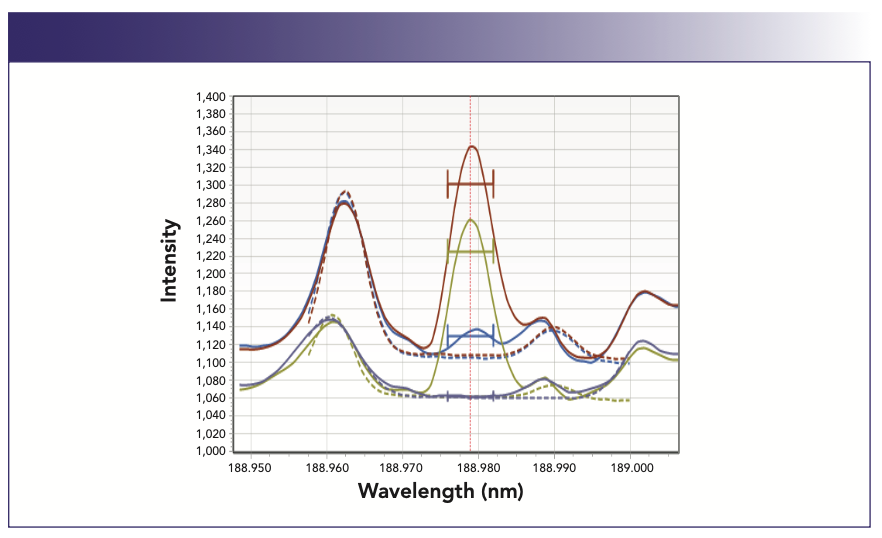
The preliminary experiments helped to identify the main sources for the interferences: residual carbon, which still remained in the digested samples, and calcium, which is a typical component found in the plant materials at a relatively high concentration. The effect of the residual carbon presence on the most sensitive arsenic 189.0 nm analytical line is shown in Figure 4. Calcium is known to create a stray light, which elevates the overall background in the spectral region below 250 nm and usually is taken into account by background correction.

 for abscissa and Intensity for ordinate. Matrix descriptions: 30 ppb arsenic in 50% HNO3/1500 ppm carbon matrix (brown); 50% HNO3/1500 ppm carbon (blue); 30 ppb arsenic sample in 50% HNO3 matrix (green); 50% HNO3 matrix (purple-grey).")
FIGURE 4: Spectral interference of carbon on the arsenic 189 nm emission line. Axis labels are Wavelength (nm) for abscissa and Intensity for ordinate. Matrix descriptions: 30 ppb arsenic in 50% HNO3/1500 ppm carbon matrix (brown); 50% HNO3/1500 ppm carbon (blue); 30 ppb arsenic sample in 50% HNO3 matrix (green); 50% HNO3 matrix (purple-grey).
Compensating for carbon spectral interference was critical. To reduce the residual carbon content, the optimization of the digestion methodology was focused on reaching the maximum possible completeness of the organic sample matrix decomposition. This is usually accomplished by conducting the digestion step at the highest possible temperature. Considering that a relatively significant sample size of 1.00 g has to be used to minimize the final dilution factor, the digestion temperature was set at 230 °C with 20 min to safely reach the target temperature and keep it for 15 min. Samples were digested in the MARS 6 Closed Vessel Microwave Digestion System (CEM Corporation) using the manufacturer-recommended recipe: 10 mL of concentrated nitric acid plus 0.3 mL of concentrated HCl to keep mercury stable. The samples and standards were prepared gravimetrically for better accuracy. Digestates were brought up to a final weight of 15 g (Figure 5).


FIGURE 5: Digested hemp sample.
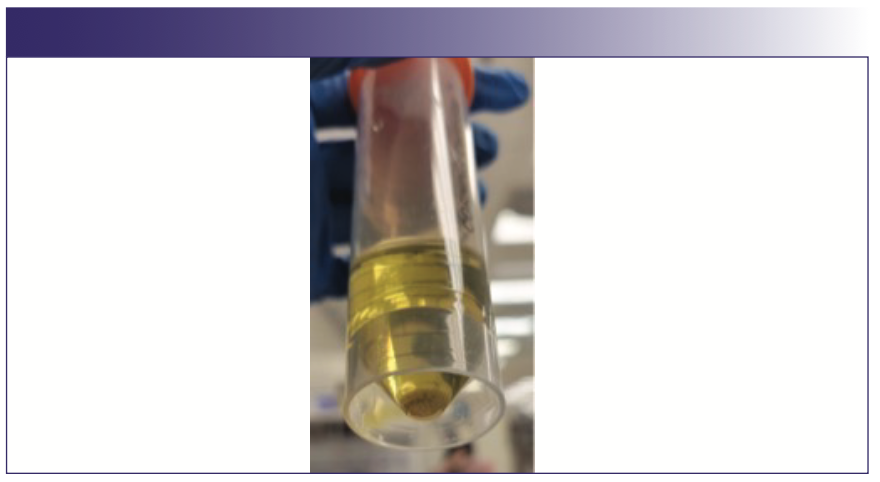
It is common for plant samples to contain small amounts of silicon, which forms a small amount of Silica precipitate as shown in Figure 5. Usually, the samples have to be filtered to prevent the blockages common for concentric-type nebulizers (2,3). As described earlier, the utilized nebulizer has a relatively large sample channel i.d. at approximately 0.75 mm, which allowed elimination of the time-consuming and quite often costly filtration step.
The content of the residual carbon in the samples, digested by the described procedure, was estimated by ICP-OES analysis at less than 2% (approximately 1150 ppm), indicating a relatively good level of decomposition completeness (8). However, even that amount of carbon in the digested samples resulted in a high bias of approximately 4–5 ppb for arsenic if analyzed against the calibration standards without carbon.
That is why the addition of carbon along with calcium estimated at 600 ppm to closely matrix match the calibration standards was necessary to compensate for such interferences and improve the accuracy of the results. The matrix composition of the calibration standards following the reagents digestion recipe included 33% HNO3/2% HCl acids mixture, 1150 ppm carbon as (potassium hydrogen phthalate) KHP, and 600 ppm of calcium. Because the vast majority of the acids were consumed during the digestion step, for practical purposes the amount of acids used for matrix matching can be decreased.
Analyses were carried out on two ICP-OES spectrometers with different designs of the optical systems: Agilent Technologies 5800 (System #1) and an axially viewed Spectro Arcos instrument (System #2). The operating parameters were optimized on each instrument for the maximum sensitivity of arsenic, which generally favors lower nebulizer flow and higher RF power setting. The examples of the calibration curves from both instruments with matrix-matched standards at 0, 1, 5, and 10 ppb and two times lower concentrations for mercury are shown in Figure 6.

: arsenic, cadmium, mercury, and lead.")
FIGURE 6: Matrix matched calibration curves carried out on two different ICP-OES systems. Elements analyzed for each system include (clockwise from upper right): arsenic, cadmium, mercury, and lead.
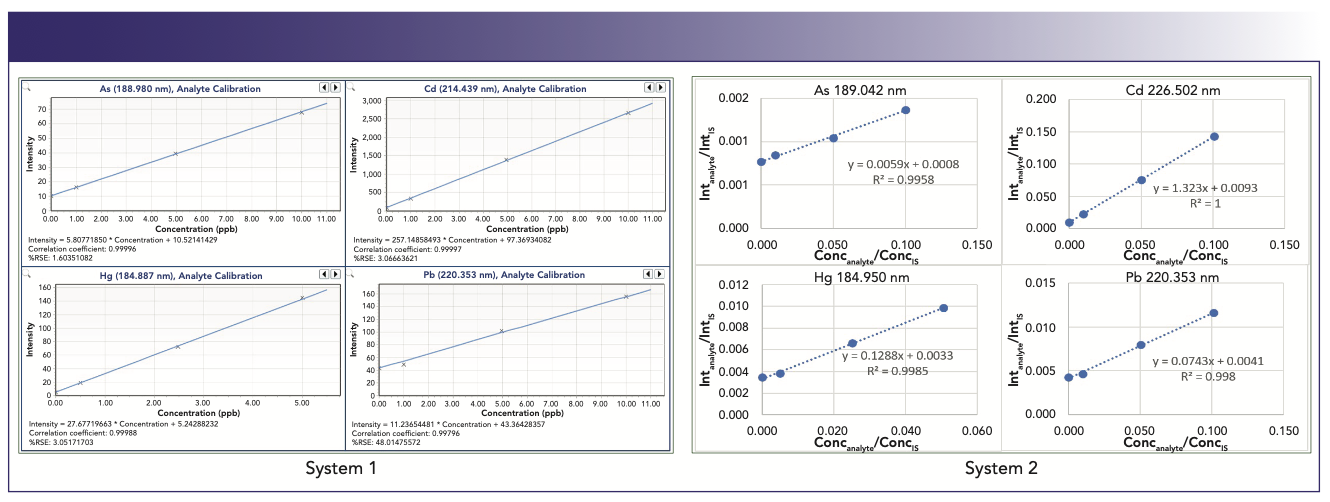
The calibration data showed that the lowest point at 1 ppb in the matrix-matched standard is clearly separated on the calibration curves for all the elements, including the most challenging arsenic and lead.
The sensitivity potential of the developed methodology was evaluated by the results of the digested samples spiked at the levels approaching the instrument detection limits. The recoveries for the 1 ppb (0.5 ppb for mercury) spike were in the range of 60–140%, whereas 2 ppb (1 ppb for mercury) spike was recovered between 84–115%.
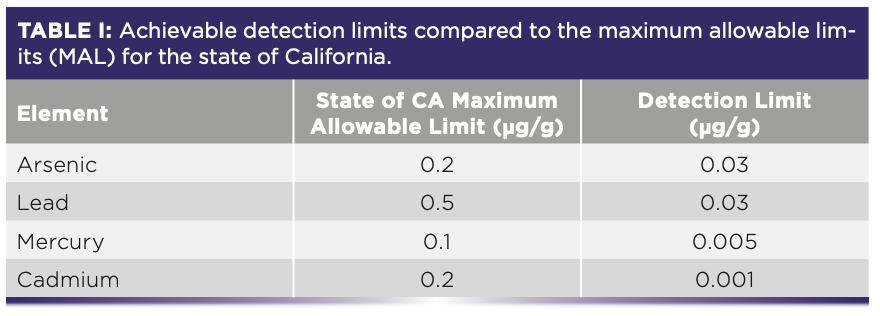
The three sigma detection limits determined on both systems from 7–10 measurements of the matrix-matched blank were within the range from 0.07 ppb (for cadmium) to 1.5–2.0 ppb (for arsenic and lead) or 0.001 μg/g to 0.03 μg/g on a dry sample base. This shows that the estimated detection limits in the range 0.001–0.03 μg/g are well below the strictest regulatory limits (MAL) defined by the state of California for inhalable cannabis and hemp products which are in the range 0.1–0.5 μg/g (Table I).


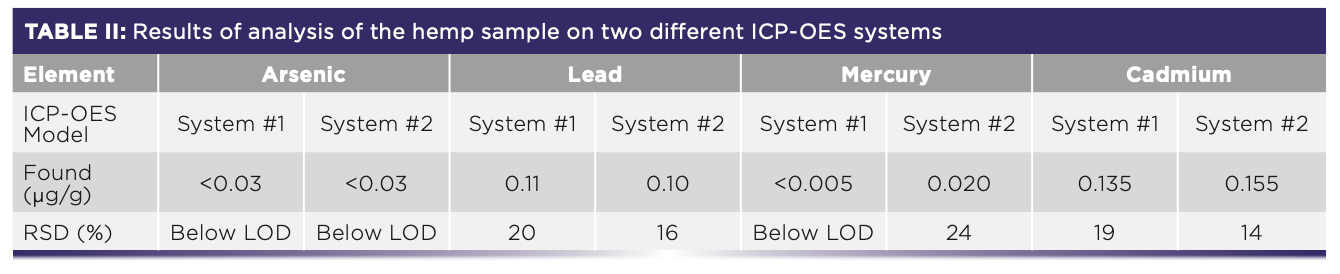
The results of the hemp samples analysis performed on both ICP-OES instruments are shown in Table II.


Conclusions
The described applications of high-purity materials and cannabis plant material show that the ICP-OES if configured correctly for high sensitivity can be a viable, attractive, less expensive, and reliable alternative to ICP-MS. In addition, because of its robustness, the methodology can be applied to areas where high productivity and high sample throughput are required, including environmental, food, specialty chemicals, and other sample matrices.
Acknowledgements
This work was funded by Inorganic Ventures and Texas Scientific Products. We gratefully acknowledge Ben Turner from Tru-Harvest Farms for providing the hemp samples, Sam Heckle at CEM Corporation, Spectro Ametek, and Dion Tsourides at Pure Lithium, as well as Mike Booth, Madeline Gozzi, and Olivia Forbes at Inorganic Ventures, for their support, recommendations, and assistance.
References
(1) Meinhard , J. The Concentric Glass Nebulizer. ICP Information Newsletter 1976, 2, 163.
(2) Montaser, A.; Golightly, D. W. Inductively Coupled Plasmas in Analytical Atomic Spectrometry, 2nd Ed. John Wiley & Sons, 2nd Ed. 1996. p 225.
(3) Burgener, J ; Makonnen Y. Nebulization Systems in Sample Introduction Systems in ICP-MS and ICP-OES; Elsevier B.V, 2020. pp 57–142.
(4) Leikin, S.; Sweat, S. Analytical Nebulizer. US 11,378,518 B2, 2022.
(5) Sugiyama, N. Analysis of Ultratrace Impurities in High Purity Copper using the Agilent 8900 ICP-QQQ. 2018. https://www.agilent.com/cs/library/applications/application_cu-impurities-icp-ms-8900-5994-0383en-us-agilent.pdf
(6) Merrifield, R.; Stephan, C. Measurement of Impurities in High-Purity Copper Concentrate Using the NexION 5000 ICP-MS.2021. http://resources.perkinelmer.com/lab-solutions/resources/docs/APP-Measurement-of-Impurities-in-High-Purity-Copper-Concentrate-NexION5000-ICP-MS-159845.pdf
(7) Davis, D.; Long, K.; Masone, J.; Firmin, P. Analysis of “The Big Four” Heavy Metals in Cannabis by USN-ICP-OES. 2015. https://www.ssi.shimadzu.com/sites/ssi.shimadzu.com/files/pim/pim_document_file/ssi/applications/application_note/15153/ICP%20Application%20-%20Analysis%20of%20Heavy%20Metals%20in%20Cannabis%20by%20USN-ICP-OES.pdf
(8) Wasilewska, M.; Goessler, W.; Zischka, Maichin, B.; Knapp, G. Efficiency of Oxidation in Wet Digestion Procedures and Influence from the Residual Organic Carbon Content on Selected Techniques for Determination of Trace Elements. J. Anal. At. Spectrom. 2002, 17 (9), 1121–1125. DOI: 10.1039/B200644H
About the Co-Authors


Autumn Phillips is a Research Chemist and Chemical Hygiene Officer at Inorganic Ventures. She received two bachelor’s degrees from Virginia Tech in Chemistry and Biochemistry in 2016. She has worked for Inorganic Ventures for 7 years and her experience includes techniques in ICP-OES, ICP-MS, and Ion Chromatography analysis, as well as complex sample digestions and purifications. ●


 – a supplier of high-quality consumables and innovative sample introduction systems for ICP Atomic Emission and Mass Spectrometers. Prior to starting the TSP he worked as an Applications Laboratory Manager for premier instrument manufacturers of both the ICP-OES, ICP-MS and Microwave Digestion equipment. Analytical chemist with an extensive scientific background, Sergei utilizes his 36 years of experience in atomic spectroscopy to help solve every day real-world material analysis problems. At TSP Dr. Leikin directs the new product and business development while keeping the focus on what he likes the most – problem solving. Sergei received a Master’s Degree in Optical-Electronic Systems and Ph.D in Analytical Chemistry ●")
Dr. Sergei Leikin is a co-founder and Managing Director of TSP (Texas Scientific Products) – a supplier of high-quality consumables and innovative sample introduction systems for ICP Atomic Emission and Mass Spectrometers. Prior to starting the TSP he worked as an Applications Laboratory Manager for premier instrument manufacturers of both the ICP-OES, ICP-MS and Microwave Digestion equipment. Analytical chemist with an extensive scientific background, Sergei utilizes his 36 years of experience in atomic spectroscopy to help solve every day real-world material analysis problems. At TSP Dr. Leikin directs the new product and business development while keeping the focus on what he likes the most – problem solving. Sergei received a Master’s Degree in Optical-Electronic Systems and Ph.D in Analytical Chemistry ●

 and a Chartered Chemist (CChem).")
Robert Thomas, the editor of the “Atomic Perspectives” column, is the principal of Scientific Solutions, a consulting company that serves the educational and writing needs of the trace element analysis user community. Rob has worked in the field of atomic spectroscopy and mass spectrometry for almost 50 years, including 24 years for a manufacturer of atomic spectroscopic instrumentation. He has authored more than 100 scientific publications, including a 15-part tutorial series, “A Beginner’s Guide to ICP-MS.” In addition, he has authored six textbooks on the fundamentals and applications of ICP-MS. His most recent book, “Practical Guide to ICP-MS and Other AS Techniques: A Tutorial for Beginners,” was published in September 2023. Rob has an advanced degree in analytical chemistry from the University of Wales, UK, and is a Fellow of the Royal Society of Chemistry (FRSC) and a Chartered Chemist (CChem).


The 2024 Emerging Leader in Atomic Spectroscopy Award
January 1st 2024This year’s Emerging Leader in Atomic Spectroscopy Award recipient is Eduardo Bolea-Fernández. For the past decade, Bolea-Fernández’s research has focused on the development of a newly introduced technique, termed tandem ICP-mass spectrometry (ICP-MS/MS), for ultra-trace elemental and isotopic analysis. Senior technical editor Jerome Workman discusses Bolea-Fernández’s work here.

