Impact of pH and Sucralose on the Non-Covalent Interaction of Ovalbumin: FT-IR Analysis
Analysis of pH and cosolvent effects on protein structure is a popular study in food biophysics research since the function of protein is primarily dependent on its structure. The structure-function relationship of protein could be well reflected in changes in non-covalent interactions of protein. In this aspect, the present work deals with the Fourier transform infrared (FT-IR) spectroscopy analysis of ovalbumin (OVA) in different pH conditions with and without cosolvent sucralose (SUC) inclusion. The FT-IR spectrum of proteins provides an absorption spectrum in the frequency region of 4000-400 cm-1. These absorption bands consist of amide A, amide B, and amide I to amide VII. The results are interpreted in terms of noncovalent interactions, such as van der Waals interactions, hydrogen bonds, and hydrophobic and electrostatic interactions. The obtained results indicate that OVA is denatured from its native state against pH and SUC inclusion.
Proteins are biopolymers in which the protein structure determines the function of each. The structure of the protein can be altered depending on the environment in which proteins exist, including, but not limited to, pH, heat, adding cosolvent, and pressure (1,2). Research has proved that the basic properties of proteins’ structure and function can be tuned by changing pH and adding cosolvent in an aqueous environment (2–4). In addition, some of the cosolvents stabilize protein structures like glucose, fructose, and maltose (2,5,6), whereas others destabilize protein structures, like urea, sucralose (SUC), and guanidinium chloride (7). The extent of stabilization and destabilization are suddenly demonstrated in the folding and unfolding process of proteins. In particular, sugar prevents the denaturation effect against pH variations, due to increasing osmotic stress acting on the proteins (6). In general, such processes in globular proteins are studied through the derivations in the noncovalent interactions between protein and cosolvent molecules. Concerning interactions with protein, sugar substitutes behave in different ways concerning non-covalent interactions with proteins, such as electrostatic, van der Waal, and hydrophobic interactions, as well as hydrogen bonding. Recently, sugar substitutes have replaced sugar as additives providing a sugar-like sweet taste, with lower calories and minimal health risks (8,9). Sucralose is a familiar sugar substitute because of its unique properties, including low calories, high sweetness, and stability under a wide range of pH. Sucralose-sweetened meals and beverages are widely suggested to diabetics as an alternative to sugar-sweetened beverages and foods, as a useful sugar alternative to help such patients take their sweet product while controlling carbohydrate intake and controlling blood glucose levels.
Noncovalent interactions between protein and cosolvent play an essential role in creating foods with improved properties (10). Proteins and cosolvents commonly interact noncovalently in a variety of ways. The electrostatic interaction is either attractive or repulsive, depending upon pH, whereas its strength and range depend upon the ionic strength. The relatively large volume that many biopolymers occupy in solution makes steric exclusion effects significant; there is a decrease in the system’s mixing entropy since there is less space for the biopolymer molecules to occupy. A hydrophobic interaction, which emerges as a preference for the nonpolar groups to interact with one another, is crucial for biopolymers with nonpolar groups in aqueous solutions. For biopolymers containing segments throughout their chains that can connect to other molecules’ segments through helical or sheet-like structures, this is made reasonable by strong hydrogen bonds, so it is a crucial interaction. According to the kinds of biopolymer molecules involved, these interactions’ relative relevance in a given system varies by flexibility, molecular weight, hydrophobicity, and charge density vs. pH profile, as well as by solution composition (for example, pH and ionic strength) and environments (for example, shearing and temperature).
These inter- and intramolecular interactions of the protein system can be well exploited using Fourier transform infrared (FT-IR) studies. The absorption of infrared radiation leads to the transition of vibrational energy levels. This is the basic principle that makes IR spectroscopy a valuable tool for studying protein structure (11,12), molecular mechanisms of protein reactions (13-17), and protein folding, unfolding, and misfolding (18–20). In this study, FT-IR analysis of OVA was carried out in the presence of cosolvent, as well as in the absence of SUC using different pH conditions.
Materials and Methods
Chicken egg white-based powdered OVA purchased from Sigma Aldrich was used for sample preparation. Phosphate buffers of pH 2, 5, 7, 9, and 12 were prepared from both monobasic and dibasic sodium phosphates (NICE Chemicals) aqueous solutions of 0.2 M. SUC solutions of ~1M prepared in phosphate buffers of pH 2, 5, 7, 9, and 12 were used as a cosolvent for OVA (5 mg/mL). The FT-IR spectra of protein at various pH values were recorded in the region 4000–400 cm-1 using a PerkinElmer Spectrum FT-IR instrument at Archbishop Casimir Instrumentation Center (ACIC), of St. Joseph’s College (Autonomous), in Tiruchirappalli, Tamilnadu, India.
Results and Discussion
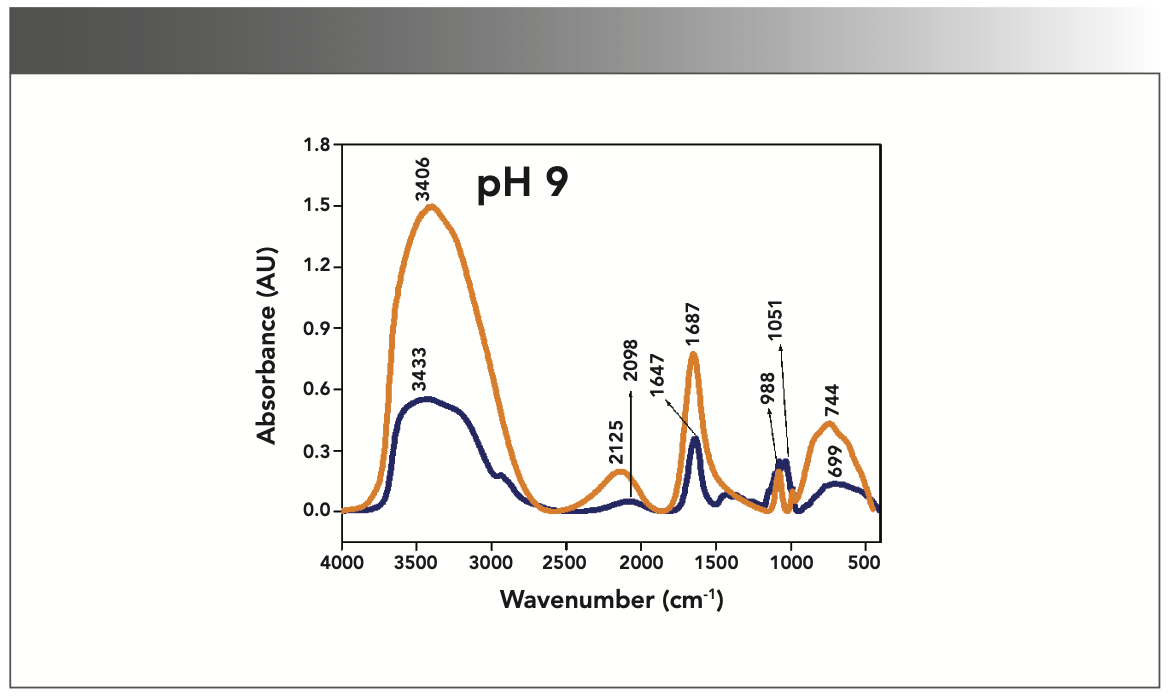
More energy is required to stretch a bond than to bend a bond, hence amide A, amide B, and amide I bands occur at higher wavenumbers. As per the literature (21–24), the amide I band is the most prominent vibrational band of the protein backbone. The perusal of Table I shows the higher wavenumber 1687 cm-1 at alkaline pH, whereas 1647 cm-1 at acidic pH for system I in the amide I region. Ultrasonic study of OVA (25) reported that acidic and alkaline pH extremities affect OVA differently, due to the addition of sucralose; acidic pHs produce a lower magnitude of denaturation whereas alkaline pHs produce a higher magnitude of denaturation. Hence, the shift in wavenumber represents the denaturation of OVA from its native state. Due to the complexity of primary spectra, it is difficult to compare pH 5 and pH 7 in the system because both have the same wavenumber bands. This problem can be solved using a second derivative analysis to resolve the complexity of the primary spectra. When the SUC (system II) is added to the sample, the peak wavenumber for the amide I region shifts to a lower wavenumber (Table I). This shifting may occur due to the denaturation of OVA. It is noticed that the absorption range is also varied in the acidic and alkaline regions due to the addition of SUC in system II.

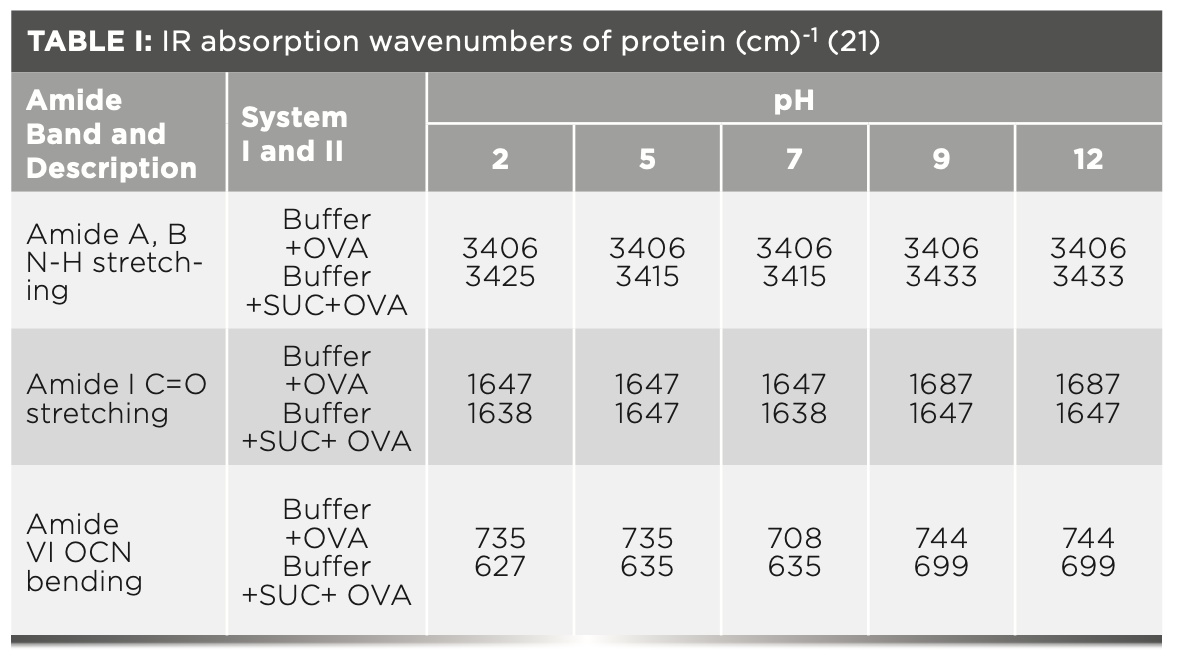

Oberg and associates (26) compared IR and circular dichroism (CD) measurements for a set of 50 proteins, and reported that IR spectroscopy is more accurate for β-sheet conformation compared to CD. Bands at 1638 cm-1 and 1687 cm-1 represent β-sheet structures, whereas the 1647 cm-1 band represents random coil structures. These overall results of amide I indicate that the cosolvent addition made conformational changes in the native state of OVA. According to the literature (27), amide VI bands occur from in-plane and out-of-plane motions of CO and NH groups in the peptide backbone in the region 700–500 cm-1. In the present study, the amide VI bands (627–744 cm-1) also reflect a similar trend to the amide I band.
The changes in the chemical structure are directly reflected in a change in the protonation state of side chains, which is important for protein function (28), as addition of a proton or hydrogen cation (H+) to a molecule will form the conjugate acid. Researchers (2,29) have shown that amino acid components of protein are either positively charged in an acidic medium or negatively charged a basic medium. The acidic condition of the solution has a higher concentration of protonated form, whereas the basic condition gives the least protonated form. Further, it was noted that one-half of OVA amino acid residues are hydrophobic, and one-third are acidic (30), which confers a pH of 4.5. As a result, the protonated form is more prevalent in acidic pH than in alkaline pH, as evidenced by the IR absorption band/peak positions of acidic and alkaline pH. This trend is well demonstrated in the IR absorption peaks of acidic and alkaline pH. More deviation occurs in the absorption of peaks of acidic pH compared to alkaline pH. Further, as the isoelectric point (pI) of OVA is 4.8, pH 5 and neutral pH 7 show the same absorption peaks even with the addition of SUC. This demonstrates that OVA are less denatured at pH 5 and 7.
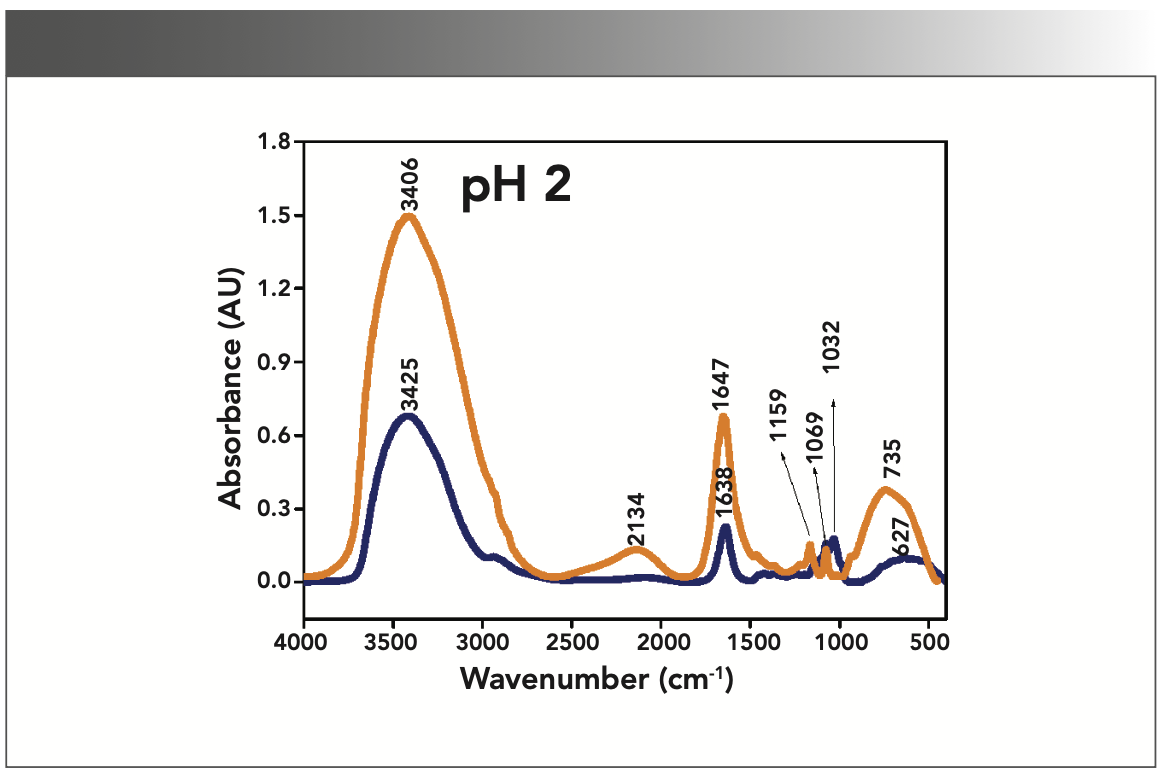
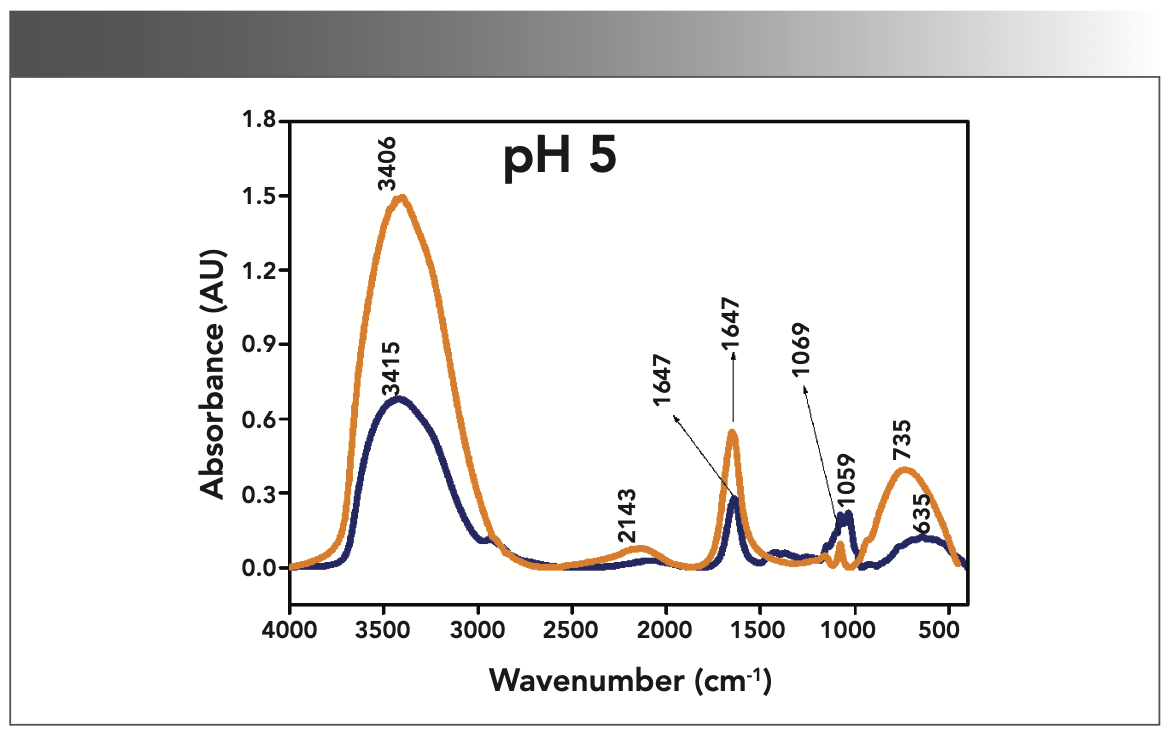
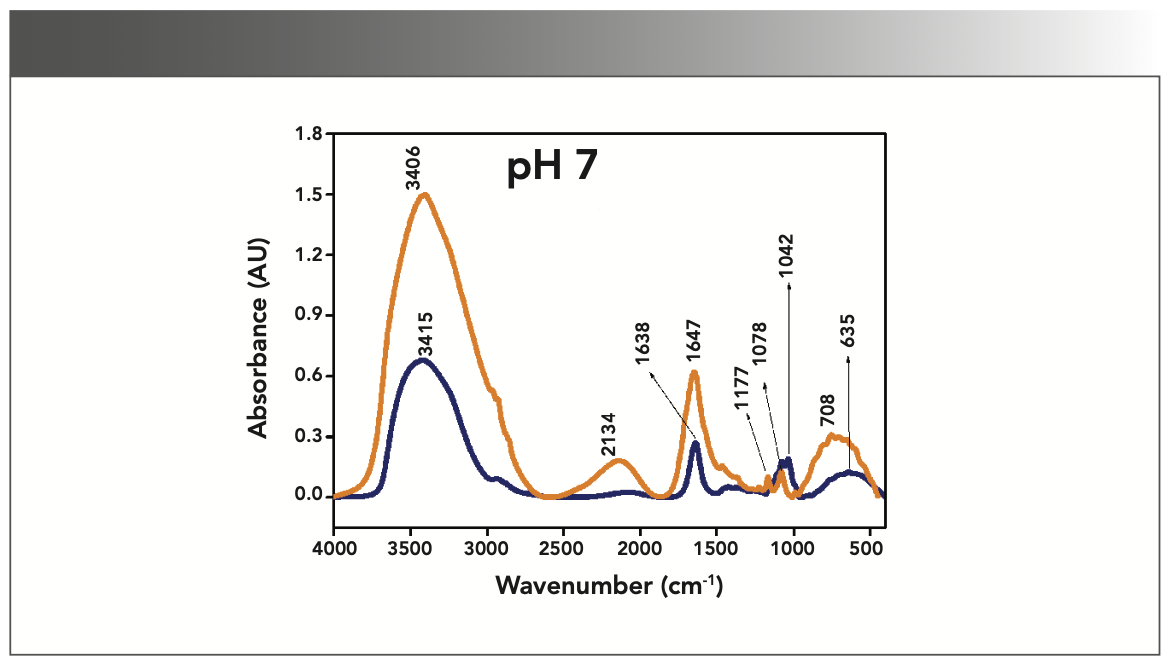
Figures 1–5 show IR absorption peaks for OVA with and without SUC at different pH values. The spectra without SUC added have higher absorption values, indicating that SUC addition reduces the IR absorption of proteins. The preferential exclusion effect (31) is a familiar one in the case of the addition of sugar with proteins. Chen and others (31) demonstrated that the halogenation process in SUC preparation modified its water structure capability. Hence, the addition of SUC with OVA leads to more aggregation enhanced by hydrophobic amino acid residues with a trend of major interactions of protein and intermolecular hydrogen bonding of OVA.

, Buffer+OVA (orange).")
FIGURE 1: Primary spectra for pH 2: Buffer+SUC+OVA (blue), Buffer+OVA (orange).

, Buffer+OVA (orange).")
FIGURE 2: Primary spectra for pH 5: Buffer+SUC+OVA (blue), Buffer+OVA (orange).

, Buffer+OVA (orange).")
FIGURE 3: Primary spectra for pH 7: Buffer+SUC+OVA (blue), Buffer+OVA (orange).

, Buffer+OVA (orange).")
FIGURE 4: Primary spectra for pH 9: Buffer+SUC+OVA (blue), Buffer+OVA (orange).

, Buffer+OVA (orange).")
FIGURE 5: Primary spectra for pH 12: Buffer+SUC+OVA (blue), Buffer+OVA (orange).
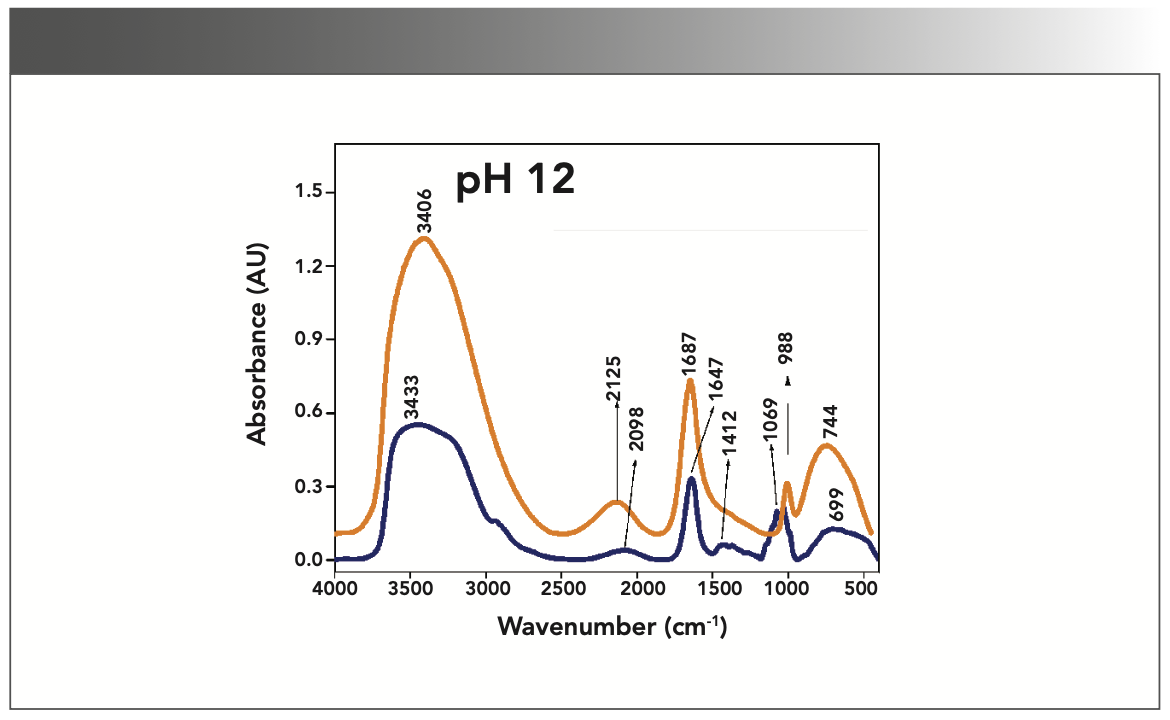
Khoury and others (27) reported that aggregation of protein leads to the formation of blocks of β-sheet type structures. The sheet structure is formed due to intermolecular hydrogen bonding between the CO and NH groups of adjacent polypeptide chains. Further, the type of N-H bonding is noticed in all absorption peaks in the 3400–3500 cm-1 range, therefore, the absorption of IR spectra due to SUC addition reports the denatured state of OVA at all pH levels. However, the absorption intensity is slightly lower in basic pH as compared to acidic pH.
The aqueous solution of SUC has a lower dielectric constant compared to pure water, revealing that the electrostatic interactions are stronger. It is noted in the literature survey that the known chemical denaturation of urea destabilizes protein structures through electrostatic interactions (31). As the dipole moment is approximately closer to the value of urea (~4.5 D), it is expected that a similar interaction is possible in the present system studied. This structural denaturation of OVA is noticed in the variation of absorption frequencies in the IR spectrum.
Thus, the cumulative effects of non-covalent interactions such as hydrophobic, hydrogen bonding, and electrostatic interactions are playing a key role in the denaturation of OVA with respect to pH variation and cosolvent inclusion.
Conclusion
OVA in buffer and OVA in buffer with cosolvent (SUC) have been analyzed by using an FT-IR study. The addition of SUC reduces the IR absorption of OVA. More deviation occurs in the absorption peaks of acidic pH compared to basic pH. Hence, FT-IR results confirm the fluctuations in non-covalent interactions. The overall results of amide I (1600–1700 cm-1) indicate that the cosolvent addition made conformational changes in the native state of OVA. The amide VI bands (627–744 cm-1) also reflect a similar trend to the amide I band. Further, the denaturation of OVA from its native state was found to be due to the combined effect of pH and SUC addition.
References
(1) Kumonsinski, T.; Farell, H. M. Determination of the Global Secondary Structure of Proteins by Fourier Transform Infrared (FTIR) Spectroscopy. Trends Food Sci. Tech. 1993, 4 (6), 169–175. DOI: 10.1016/09242244(93)90119-U
(2) Palaniappan, L.; Velusamy, V. Impact of Cosolvent (Glucose) on the Stabilization of Ovalbumin. Food Hydrocoll. 2013, 30 (1), 217–223. DOI: 10.1016/j.foodhyd.2012.05.020
(3) Velusamy, V.; Palaniappan, L. Effect of pH and Glucose on the Stability of α-lactalbumin. Food Biophysics 2016, 11 (1), 108–115. DOI: 10.1007/s11483- 015-9423-2
(4) Chanasattru, W.; Decker, E. A,; McClements, J. Impact of Cosolvents (Polyols) on Globular Protein Functionality: Ultrasonic Velocity, Density, Surface Tension and Solubility Study. Food Hydrocoll. 2008, 22 (8), 1475–1484. DOI: 10.1016/j.foodhyd.2007.09.007
(5) Waris, B. N.; Bano, B.; Abdul Raziq, A. H. Flexibility and Viscometric Studies of Globular Proteins Ovalbumin and Ovotransferrin. Indian J. Biochem. Biophys. 2003, 40 (2), 98–107 DOI: http://nopr.niscpr.res.in/handle/123456789/3746
(6) Kavitha, K.; Palaniappan, L. Response of Ovalbumin to Fructose Addition and pH Variations-Ultrasonic and FTIR Study. Sustainability, Agri, Food and Environmental Research 2021, 9 (2), 263–281. DOI: 10.7770/safer-V0N0-art2231
(7) Canchi, D. R.; Garcia, A. E. Cosolvent Effects on Protein Stability. Annu. Rev. Phys. Chem. 2013, 64 (1), 273–293. DOI: 10.1146/annurev-physchem-040412-110156
(8) Carniel, B.; Thiago, D.; Juliano, D.; Sweeteners and Sweet Taste Enhancer in the Food Industry. Food Sci. Tech. 2018, 38 (2), 181–187. DOI: 10.1590/fst.31117
(9) Luizdus Santos, A.; Freitas, H. V.; Rudrigues, S. Production and Stability of Probiotic Cocoa Juice with Sucralose as Sugar Substitute During Refriger- ated Storage. LWT - Food Sci. Tech. (Lebensmittel-Wissenschaft und -Technologie) 2018, 99, 371–378, DOI: 10.1016/j.lwt.2018.10.007
(10) McClements, D. J. Non Covalent Interaction Between Proteins and Polysaccharides. Biotechnol. Adv. 2006, 24 (6), 621–625. DOI: 10.1016/j.biotechadv.2006.07.003
(11) Harisand, P. I; Chapman, D. Analysis of Polypeptide and Protein Struc- tures Using Fourier Transform Infrared Spectroscopy, in Jones, C., Mulloy, B., Thomas, A.H. (eds) Microscopy, Optical Spectroscopy, and Macroscopic Techniques. Methods in Molecular Biology, Vol 22, Humana Press, 1994; pp. 183–202. DOI: 10.1385/0-89603-232-9:183
(12) Fabian, H.; Mantele, W. Handbook of Vibrational Spectroscopy, John Wiley & Sons, 2002; pp. 3399–3425.
(13) Uverskyand, V. N.; Permyakov E. A. Methods in Protein Structure and Stability Analysis: Vibrational Spectroscopy, Nova Science Publishers, 2007; pp. 3–52.
(14) Jung, C. Insight into Protein Structure and Protein–Ligand Recognition by Fourier Transform Infrared Spectroscopy. J. Mol. Recognit. 2000, 13 (6), 325–351.
(15) Wharton, C. W. Infrared Spectroscopy of Enzyme Reaction Intermediates. Natural Product Report 2000, 17 (5), 447–453. DOI: 10.1039/B002066O
(16) Barth, A.; Zscherp, C. What Vibrations Tell Us About Protein. Q. Rev. Biophys. 2002, 35 (4), 369–430. DOI: 10.1017/S0033583502003815
(17) Noguchi, T. Light-Induced FTIR Difference Spectroscopy as a Powerful Tool Toward Understanding the Molecular Mechanism of Photosynthetic Oxygen Evolution. Photosynth. Res. 2007, 91 (1), 59–69. DOI: 10.1007/s11120-007-9137-5
(18) Schultz, C. P. Illuminating Folding Intermediates. Nat. Struct. Biol. 2000, 7 (1), 7–10. DOI: 10.1038/71197
(19) Ramajo. A. P.; Petty, S. A.; Starzyk, A.; Volk, M. The α-Helix Folds More Rapidly at the C-Terminus Than at the N-Terminus. J. Am. Chem. Soc. 2005, 127 (40), 13784–13785. DOI: 10.1021/ja054500+
(20) Kauffmann, E.; Darnton, N. C.; Austin, R. H.; Batt, C.; Gerwert, K. Lifetimes of Intermediates in the b-sheet to a-helix Transition of b-lactoglobulin by Using a Diffusional IR Mixer. Proc. Natl. Acad. Sci. 2001, 98 (12), 6646–6649. DOI: 10.1073/pnas.101122898
(21) Kongand, J.; Shanoning, Y. U. Fourier Transform Infrared Spectroscopic Analysis of Protein Secondary Structures. Acta Biophysica. et Biochimica Sinica 2007, 39 (8), 549–559. DOI: 10.1111/j.1745-7270.2007.00320.x
(22) Krimmand, S.; Bandekar, J. Vibrational Spectroscopy and Conformation of Peptides, Polypeptides, and Proteins. Adv. Protein Chem. 1986, 38, 181–364. DOI: 10.1016/s0065-3233(08)60528-8
(23) Susiand, H.; Byler, D. M. Resolution-Enhanced Fourier Transform Infrared Spectroscopy of Enzymes. Methods Enzymol. 1986, 130, 290–311. DOI: 10.1016/0076-6879(86)30015-6
(24) Surewiczand, W. K.; Mantsch, H. H. New Insight into Protein Secondary Structure from Resolution-Enhanced Infrared Spectra. Biochem. Biophys. Acta 1988, 952, 115. DOI: 10.1016/0167-4838(88)90107-0
(25) Agalya, P.; Oliveira , P.; Lescano, C. H.; Caires, A. R. L.; Velusamy, V. Effect of pH and Cosolvent Sucralose on the Solvation Profile of Ovalbumin: Ultrasonic and Molecular Simulation Studies. Food Hydrocoll. 2022, 125, 107386–107397. DOI: 10.1016/j.foodhyd.2021.107386
(26) Oberg, K. A.; Ruysschaert, J. M.; Goormaghtigh, E. The Optimization of Protein Secondary Structure Determination with Infrared and Circular Dichroism Spectra. J. Biochem. 2004, 271 (14), 2937–2948. DOI: 10.1111/j.14321033.2004.04220.x
(27) Khoury, Y. E.; Hielscher, R.; Voicescu, M.; Gross, J.; Hellwig, P. On the Specificity of the Amide VI Band for the Secondary Structure of Proteins. Vib. Spectrosc. 2011, 55 (2), 258–266. DOI: 10.1016/j.vibspec.2010.12.001
(28) Barth, A. Infrared Spectroscopy of Proteins. Biochimica. et Biophysica Acta (BBA)- Bioenergetics 2007, 1767 (9), 1073–1101. DOI: 10.1016/j.bbabio.2007.06.004
(29) Zhao, G.; Qi, Y.; Tian, Y. Simultaneous and Direct Determination of Tryptophan and Tyrosine at Boron-Doped Diamond Electrode. Electroanalysis 2006, 18 (8), 830–834. DOI: 10.1002/elan.200503455
(30) Linand, T. Y.; Timasheff, S. N. On the Role of Surface Tension in the Stabilization of Globular Proteins. Prot. Sci. 1996, 5 (2), 372–381. DOI: 10.1002/pro.5560050222
(31) Chen, L.; Shukla, N.; Chon, I.; Taylor, E. A. Sucralose Destabilization of Protein Structure. J. Phys. Chem. Lett. 2015, 6 (8), 1441–1446. DOI: 10.1021/acs.jpclett.5b00442
Agalya Palanisamy and Velusamy Veerappan are with the PG & Research Department of Physics at Arignar Anna Govt. Arts College, in Namakkal, Tamilnadu, India. Direct correspondence to: veluphysics@yahoo.com ●


Measurement of Ammonia Leakage by TDLAS in Mid-Infrared Combined with an EMD-SG Filter Method
April 9th 2024In this article, tunable diode laser absorption spectroscopy (TDLAS) is used to measure ammonia leakage, where a new denoising method combining empirical mode decomposition with the Savitzky-Golay smoothing algorithm (EMD-SG) is proposed to improve the signal-to-noise ratio (SNR) of absorbance signals.

Childhood Obesity Serum Samples Analyzed Using Fourier Transform Infrared Spectroscopy
April 9th 2024A group of scientists led by Zozan Guleken of the Gaziantep University of Science and Technology in Gaziantep, Turkey looked into the blood serum composition of childhood obesity (CO) tissues using Fourier transform infrared (FT-IR) spectroscopy.

