Inorganics III: Even More Spectra, and the Grand Finale
We wrap up our discussion of the mid-infrared spectra of inorganic compounds by looking at the spectra of silicates, nitrates, and phosphates. We see that silicates have complex surface chemistry, and that infrared (IR) spectroscopy can tell us something about this. We will note that, of the five families of inorganics examined, the wavenumber ranges for the polyatomic anion stretching peaks in several of these functional groups overlap. However, polyatomic anion bending vibration peaks can be used to distinguish the five types of inorganics studied.
To review from the last two columns (1,2), the characteristics of the infrared spectra of inorganics are:
- The majority of peaks are at low wavenumber due to the high atomic weight of the metal atoms found in inorganics. Many inorganic peaks fall in the far infrared, below the 400 cm-1 cutoff of most infrared spectrometers, and are thus not routinely observed.
- Most inorganic peaks that appear in the mid-infrared (4000–400 cm-1) are from the stretching and bending vibrations of polyatomic anions.
- The mid-infrared peaks of polyatomic anions are generally intense because inorganic bonds are frequently ionic, have large dipole moments, large values of (dµ/dx)2 (change in dipole moment with respect to bond length during a vibration [3]), and, therefore, strong fundamental infrared absorbances.
- Because the fundamental vibrations of inorganics give inherently intense peaks, overtone and combination bands frequently show up as well, sometimes with considerable intensity.
- A defining characteristic of inorganic spectra is the lack of C-H stretching peaks in the 3000 cm-1 vicinity.
- Water peaks are commonly found in the spectra of inorganics. These water molecules are found in three forms: adsorbed water, waters of hydration, and covalently bonded water.
- The same inorganic molecule can come in different crystalline forms, which will have different infrared spectra (organics do this too, which may be a topic for a future column).
Silica and Silicates
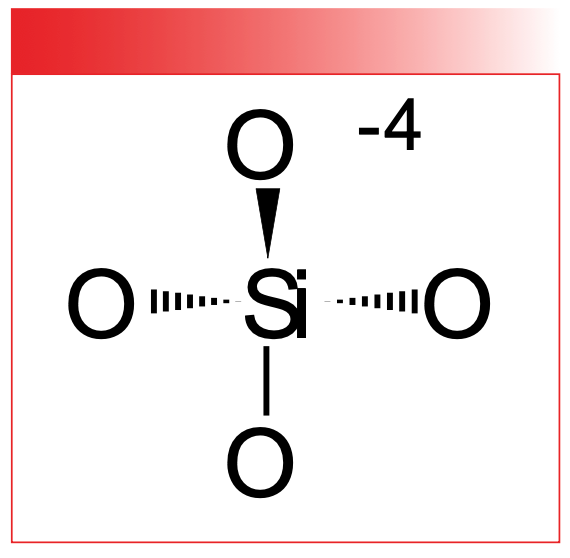
Silicon is under carbon in the periodic table, and, like carbon, forms four stable bonds that can make a tetrahedron. Also, silicon can form sheets, rings, and chains giving the interesting geology of our planet. As has been said, carbon gives biology, silicon gives geology. The chemical structure of the SiO4-4 polyatomic anion is shown in Figure 1.


FIGURE 1: The chemical structure of the silicate polyatomic anion, SiO4-4.
The mineral silica consists solely of SiO4-4 units and is found all around us as glass, sand, and quartz (4).
Silicates, minerals based on the SiO4 unit, make up a large part of the earth’s crust, including clays and granite (5).
Like the other inorganics we have studied (1,2), silica and silicates are hygroscopic, meaning they absorb water from the atmosphere. However, unlike these other molecules, a native silica surface will react with atmospheric water to form Si-OH groups called silanols. The name comes from these chemical bonds being the silicon analogs of alcohols (5). The structures of two different types of silanol are seen in Figure 2.

 The chemical structure of a hydrogen bonded silanol. (b) The chemical structure of a lone silanol.")
FIGURE 2: (a) The chemical structure of a hydrogen bonded silanol. (b) The chemical structure of a lone silanol.
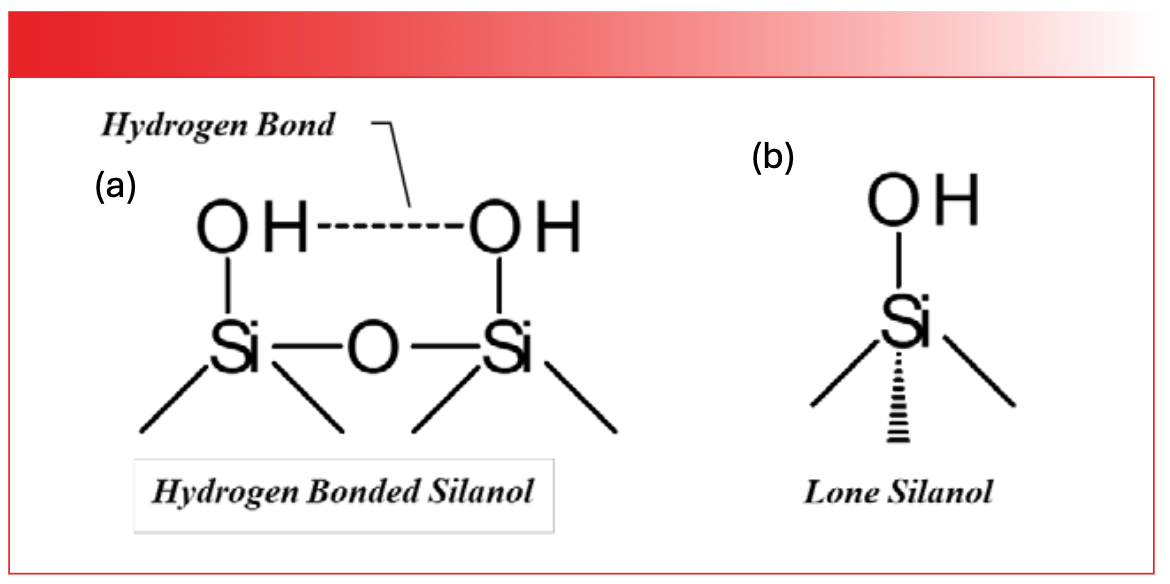
The O-H bond in silanols is highly polar; as a result, silanol groups can hydrogen bond to each other just like water molecules can, as seen to the left in Figure 2. Recall (3) that peak widths in infrared spectroscopy are determined by the strength of the intermolecular interactions between molecules, and that water has particularly broad peaks as a result of hydrogen bonding. Silanols are no different. The broad envelope at 3350 cm-1 (going forward all peak positions will be in cm-1 even if not so noted), labeled B in Figure 3, is from the O-H stretch of hydrogen bonded silanols with a contribution from adsorbed water of a silica sample.


FIGURE 3: The infrared spectrum of a silica sample.
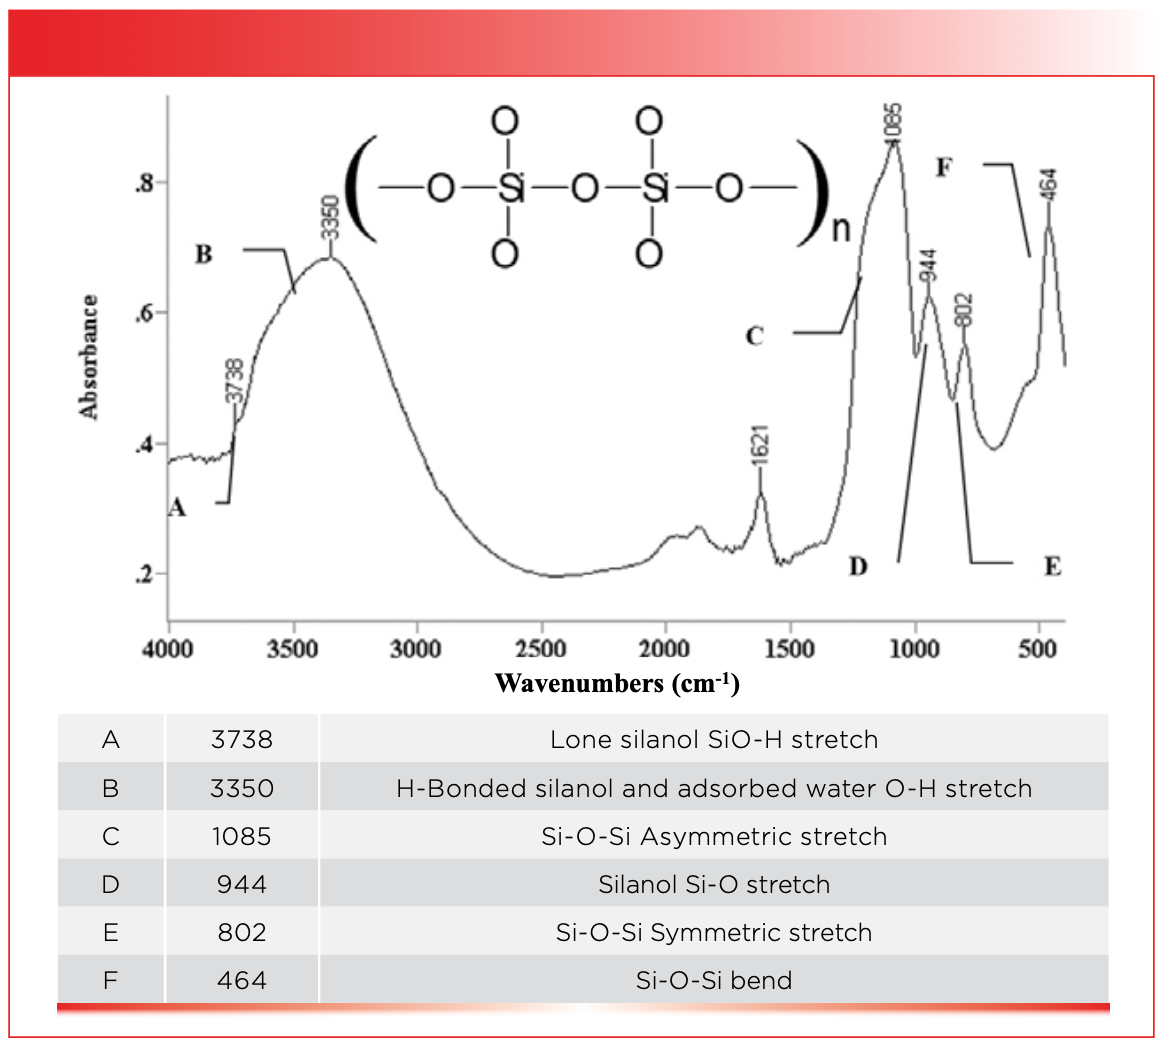
Depending upon the geometry of the silica surface, silanol groups may be too far apart to hydrogen bond to each other, and hence become what are called lone silanols, as seen to the right in Figure 2. Lone silanols are acidic compared to hydrogen bonded silanols. Because lone silanols are not hydrogen bonded, their O-H stretching peaks are significantly narrower than other silanol peaks, as seen by the peak labeled A at 3738 in Figure 3, which is the O-H stretching peak of lone silanols. The contrast in peak width between the sharp spike at 3738 and the broad envelope centered around 3350 is remarkable, showing how sensitive infrared spectra can be to the extent of hydrogen bonding in a sample. The variation in silanol structure, and hence chemistry across silica surfaces, is responsible for their widespread use as adsorbents and chromatographic stationary phases.
The banana-shaped peak at 1085 in Figure 3 is one of the strangest peak shapes I have ever seen in infrared spectroscopy. It is from the asymmetric stretch of the Si-O-Si chains whose peak is labeled C in Figure 3. This peak is typically found between 1200 and 1000 for silica and silicates. I have no idea why this peak is banana-shaped; perhaps the answer is it out there somewhere in the literature.
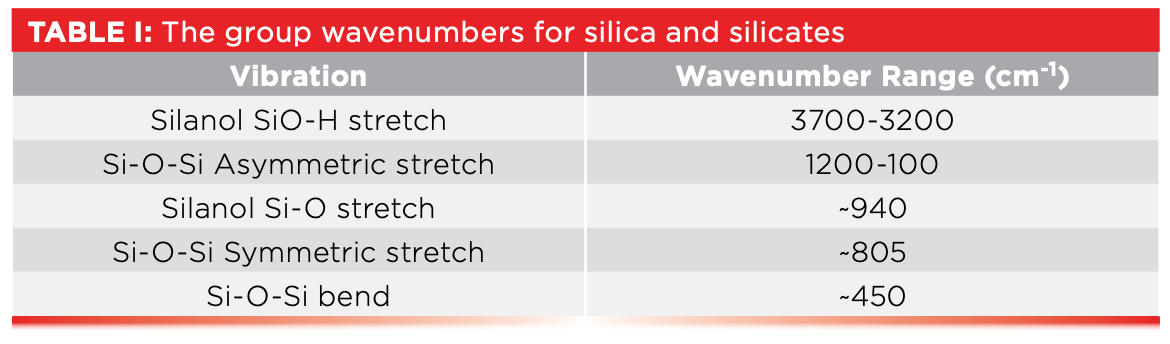
The peak labeled D at 944 in Figure 3 is unusual in that it is an intense, low wavenumber peak from a surface species, the Si-O stretch of silanols which is typically found around 940. The peak labeled E at 802 in Figure 3, is from the symmetric stretch of Si-O-Si chains, and is typically found in the vicinity of 805. The peak labeled F at 464 well to the right in Figure 3 is from the bending of Si-O-Si chains, and is typically found around 450. This is perhaps the lowest wavenumber peak we have studied or will study in this column series. Table I lists the numerous group wavenumbers for silica and silicates.


Inorganic Nitrates
Inorganic nitrates contain the NO3-1 polyatomic anion. The structure of this anion is shown in Figure 4.


FIGURE 4: The chemical structure of the nitrate group.
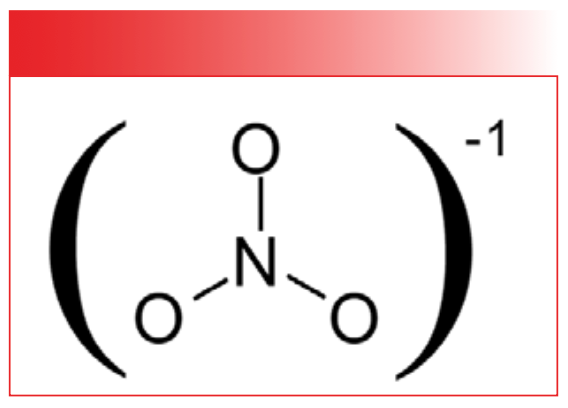
Note, like the other polyatomic anions we have studied, the bond orders of the nitrogen-oxygen bonds in nitrates are equivalent. Therefore, there are no N-O or N=O stretching peaks in the spectra of nitrates, simply a single what we will call NO stretching peak which is seen at 1346 and labeled A in the spectrum of sodium nitrate seen in Figure 5.


FIGURE 5: The infrared spectrum of sodium nitrate, NaNO3.
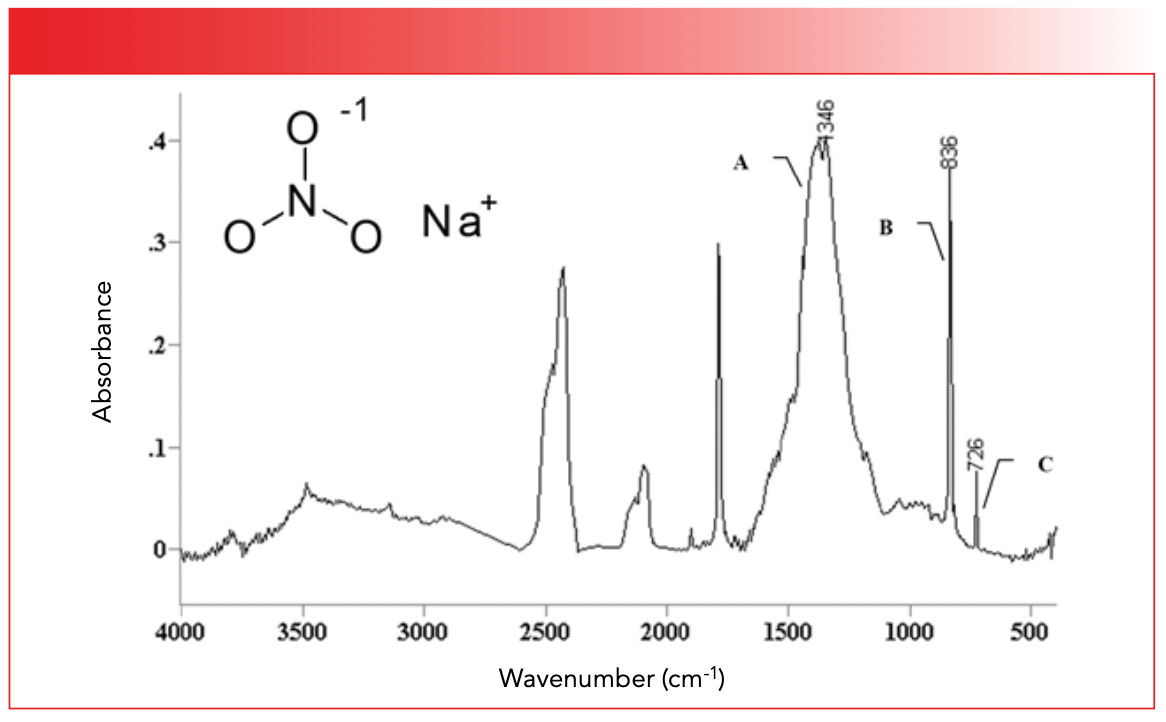
In general, the NO stretching peak of inorganic nitrates falls from 1400 to 1340. The sharp peaks in Figure 5 at 836 and 726 in Figure 5, labeled B and C, are from the out-of-plane and in-plane bending vibrations of the NO3-1 group, respectively. The out-of-plane bend typically falls from 840 to 810, while the in-plane bend is usually found around 720. The big peaks in Figure 5 at around 1700, 2000, and 2500 are overtone and combination peaks. For example, the sharp peak around 1700 that looks like a carbonyl stretch is, in fact, the first overtone of the in-plane whose fundamental falls at 836. Of course, the ~1700 is not carbonyl, because this molecule is inorganic, as we can tell from the lack of C-H stretches. This spectrum is a good example of how common large overtone and combination bands are in inorganic spectra (1,2). The broad envelope centered near 3400 is adsorbed water, so common in inorganics, as we have seen. Table II lists the group wavenumbers for inorganic nitrates.


Inorganic Phosphates
Inorganic phosphates contain the PO4-3 polyatomic anion. Its structure is seen in Figure 6.


FIGURE 6: The chemical structure of the inorganic phosphate polyatomic anion.
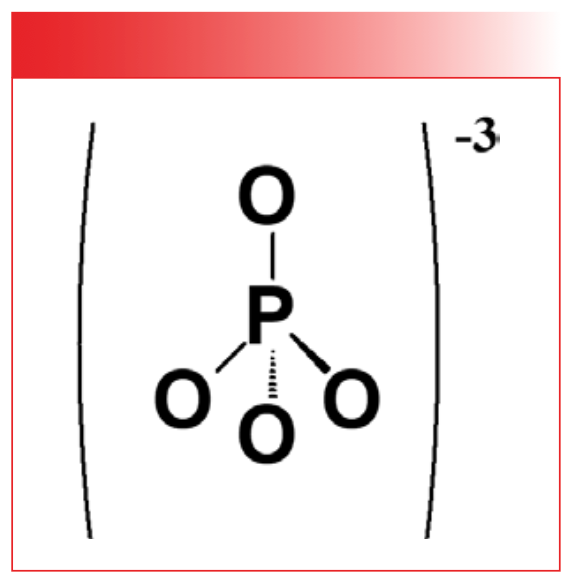
Like all the other polyatomic anions we have studied, the bond orders for all the bonds in the PO4-3 group are equivalent, giving rise to a single peak that we will call a PO stretching peak, labeled A at 1047 in Figure 7.

3OH.")
FIGURE 7: The infrared spectrum of hydroxyapatite, Ca(PO4)3OH.
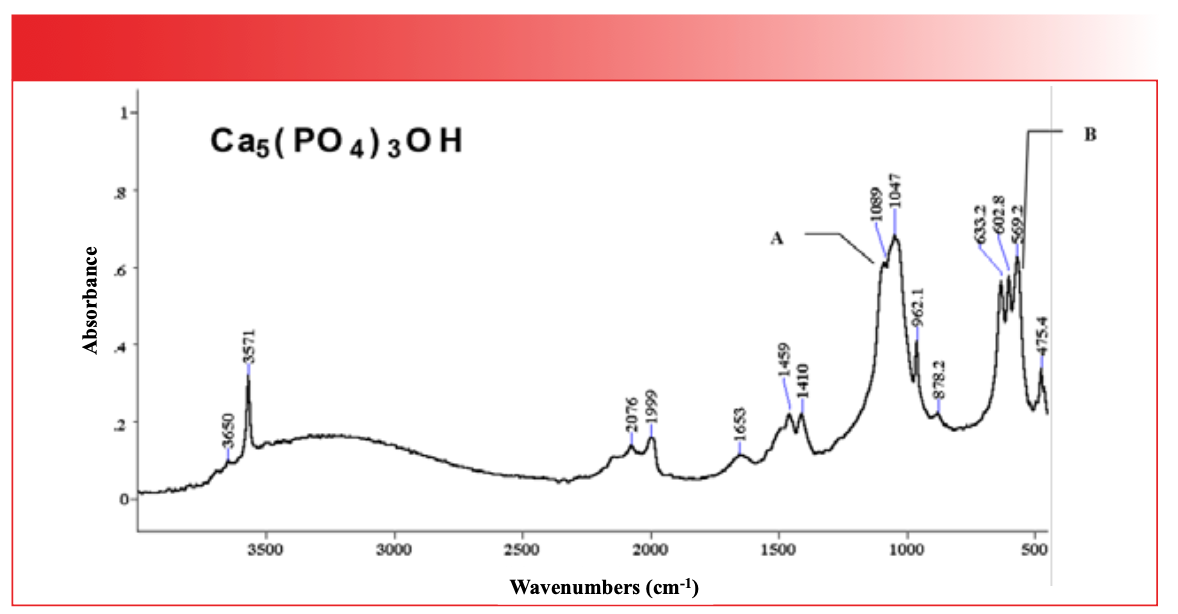
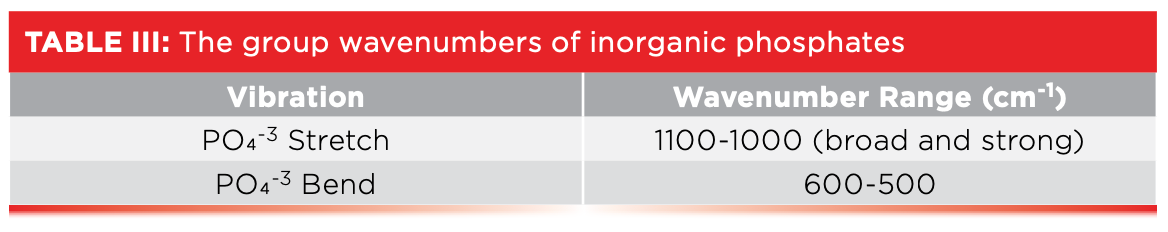
The PO stretching peak of phosphates is typically found between 1100 and 1000. Note that this peak is big, broad, and at low wavenumber, like all the other polyatomic anion stretching peaks we have studied. The mob of peaks centered around 600 is from P-O bending vibrations. These typically show up between 600 and 500. The usual overtone and combination bands are between 2100 and 1400, and the broad envelope between 3700 and 2500 is from the O-H stretch of adsorbed water.
The material whose spectrum is seen in Figure 7, hydroxyapatite, is a type of calcium phosphate, and is the main component in bones and teeth. Our bodies need calcium to build bones and teeth, which is why we are exhorted to make sure we get enough calcium in our diets. The group wavenumbers for inorganic phosphates are found in Table III.


The Grand Finale
We have studied five different types of inorganic molecules: sulfates, carbonates, silicates, nitrates, and phosphates. All of them consist of a metal cation and a polyatomic anion that consists of a central non-metal atom bonded to oxygen, the non-metal atoms in our case being carbon, nitrogen, silicon, phosphorous, and sulfur. Lets denote this family of atoms as X and name them polyatomic anion central atoms. Thus, we can say that the polyatomic anions we studied all have X-O bonds, X-O stretching vibrations, and X-O bending vibrations. If you review the inorganic spectra seen in the last two columns (1,2) and the spectra seen above, note that all the X-O bending peaks we saw were big and broad and at low wavenumber, and that the X-O bending vibrations were all sharp peaks at even lower wavenumber.
The first and second columns in Table IV list the X atoms we studied, and their atomic masses in ascending order. Recall (3) that the peak positions in infrared spectroscopy are determined in part by atomic mass, as given in equation 1:


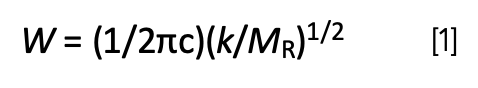
where W equals peak wavenumber position in cm-1, c equals the speed of light, k equals force constant, and MR equals reduced mass.

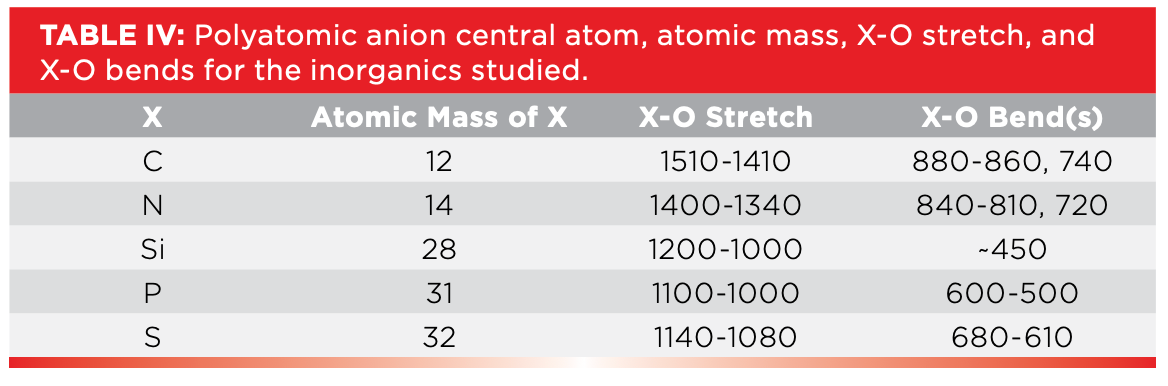

The third column in Table IV lists the X-O stretches of the polyatomic anions we studied. As we go down the table and atomic mass goes up, we would expect the X-O stretching peak position to go down. This is true for carbonates and nitrates, where carbon weighs 12, nitrogen 14, and their X-O stretches fall around 1500 and 1400, respectively. However, the X-O stretches of silicates, phosphates, and sulfates overlap in the 1100 to 1000 region. This is probably because the atomic masses of these three atoms are very close to each other. This means we cannot use X-O stretches by themselves to reliably distinguish these three types of inorganic molecules from each other. What then are we to do?
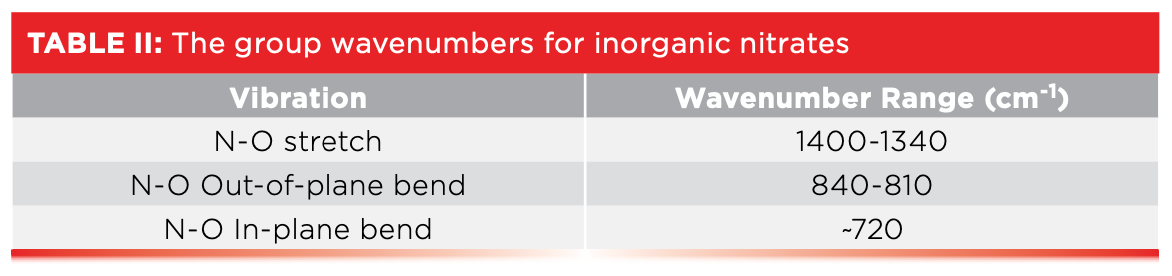
Fortunately, X-O bending vibrations come to the rescue. Their peak positions are listed in column 4 in Table IV. Carbonates are unique in that they are the only molecule type listed with a bending vibration above 860. Nitrates stand alone as the only molecule listed with a bending vibration between 840 and 810. Silica and silicates stand out like a sore thumb, thanks to the low wavenumber Si-O-Si stretch near 450. Phosphates are the only thing here with bending peaks below 600, and, lastly, sulfates are unique in that they are the only inorganic listed with bending peaks between 680 and 610. Thus, a detailed analysis of the bending vibrations of these molecules gives us the ability to distinguish between all five types of inorganics studied.
Conclusions
Silica and silicates contain the SiO4 unit and make up the large family of silica and silicates. These substances have a unique surface chemistry, because they react with atmospheric water to form silanols, the silicon analog of alcohols. Depending upon surface geometry, silanols may be lone or hydrogen bonded, and both these silanols give characteristic Si-OH stretching peaks in their spectra. We examined the spectra of inorganic nitrates and phosphates, and found that they have polyatomic anion stretching and bending peaks like the other inorganics we have studied. In the grand finale listed in Table IV, we found that X-O stretches by themselves cannot distinguish between carbonates, nitrates, silicates, phosphates, and sulfates, but that the X-O bending vibration peaks can be used to distinguish these molecules.
References
(1) Smith, B. C. Inorganics II: The Spectra, Spectroscopy 2024, 39 (1), 14–17. DOI: 10.56530/spectroscopy.gh3585q6
(2) Smith, B. C. Inorganics I; Introduction, Spectroscopy 2023, 38 (11), 18–21. DOI: 10.56530/spectroscopy.rp3780c4
(3) Smith, B. C. Why Spectral Interpretation Needs to Be Taught, Spectroscopy 2015, 30 (1), 16–23.
(4) Wikipedia Silicon dioxide Page. https://en.wikipedia.org/wiki/Silicon_dioxide (accessed 2024-02-20).
(5) Wikipedia Silicate Page. https://en.wikipedia.org/wiki/Silicate (accessed 2024-02-20).
(6) Wikipedia Silanol Page. https://en.wikipedia.org/wiki/Silanol (accessed 2024-02-20).


Brian C. Smith, PhD, is the founder and CEO of Big Sur Scientific, a maker of portable mid-infrared cannabis analyzers. He has over 30 years experience as an industrial infrared spectroscopist, has published numerous peer-reviewed papers, and has written three books on spectroscopy. As a trainer, he has helped thousands of people around the world improve their infrared analyses. In addition to writing for Spectroscopy, Dr. Smith writes a regular column for its sister publication Cannabis Science and Technology, and sits on its editorial board. He earned his PhD in physical chemistry from Dartmouth College. He can be reached at: SpectroscopyEdit@MMHGroup.com●


Childhood Obesity Serum Samples Analyzed Using Fourier Transform Infrared Spectroscopy
April 9th 2024A group of scientists led by Zozan Guleken of the Gaziantep University of Science and Technology in Gaziantep, Turkey looked into the blood serum composition of childhood obesity (CO) tissues using Fourier transform infrared (FT-IR) spectroscopy.


