Interacting Characteristics of Chrysene with Free DNA in vitro
Deoxyribonucleic acid (DNA), an important material in life science, is considered a natural and highly specific functional biopolymer. Various analytical techniques were used to analyze the interaction of chrysene with free DNA in vitro, and based on this interaction, we studied the removal of chrysene from contaminated water by DNA via magnetic beads-based separation. The results of UV-visible spectroscopy, DNA thermal denaturation measurement, circular dichroism (CD) spectroscopy, and fluorescence microscopy showed that chrysene interacted with DNA through an intercalating mode. The results of fluorescence spectroscopy demonstrated that DNA had a static quenching effect on chrysene, indicating the formation of a stable complex between chrysene and DNA. Thermodynamic studies revealed that the interaction of chrysene with free DNA was spontaneous in vitro. In addition, chrysene could be efficiently removed from contaminated water by DNA via DNA-intercalation and magnetic bead-based separation. The chrysene removal efficiency of DNA was better than that of activated carbon even when the amount of activated carbon was 400 times more than that of DNA. The results of this study provide insights into the development of new chrysene elimination processes based on DNA-intercalation in water pollution.
Polycyclic aromatic hydrocarbons (PAHs) are the most abundant environmental pollutants, and are composed of two or more benzene rings connected via fused rings (1,2). Many natural and man-made activities, such as volcanic eruptions, forest fires, vehicle emissions, catalytic cracking of petroleum, and residential burning of wood, release PAHs into the environment (3). Moreover, the carcinogenicity of PAHs has been fully proven in animal experiments and in humans (4–6). PAHs are toxic substances that can cause various harmful effects in vivo or in vitro (7). Therefore, since the 1980s, 16 PAHs, such as chrysene (CHR), have been listed as priority pollutants in the environment by the U.S. Environmental Protection Agency (EPA) (8). PAHs are widely distributed in water, air, and soil, and there have been attempts to remove the hazards of PAH pollution via natural degradation (9), bioremediation (10,11), ultraviolet photolysis (12,13), adsorption (14,15), and advanced oxidation (16,17). However, although these traditional technologies and methods affect the elimination of PAHs, they remain far from achieving the desired results. The actual removal efficiency for PAHs is limited and needs to be improved.
In 1961, Lerman first reported an intercalating mode in which acridine was bound to base pairs of DNA double helixes through noncovalent action (for example, hydrophobic, van der Waals, π-π, hydrogen bonding, and ionic) (18). Later, researchers found a large kind of planar polycyclic substance that could intercalate into two adjacent base pairs of DNA, resulting in structural changes of DNA, such as the extension of DNA strands. These also blocked or inhibited replication and transcription of DNA and even led to teratogenesis, mutagenesis, and carcinogenesis (19). Some PAHs and their derivatives can also form stable DNA–PAHs complexes by intercalating a planar aromatic substituent into DNA base pairs through π–π interaction, hydrophobic effect, van der Waals interactions, or charge transfer force (20,21). In addition, DNA first selectively adsorbed polycyclic aromatic compounds through intercalation, and then removed harmful polycyclic aromatic compounds (22). Later, an increasing number of adsorbed intercalating materials, such as DNA film (23), DNA-alginic acid gel (24), DNA-loaded polysulfone microspheres (25), and DNA hydrogel beads (26), could be prepared for the selective removal of intercalating compounds, such as ethidium bromide, acridine orange, dioxins, and endocrine disrupters. The intercalation between small molecules and DNA includes covalent and noncovalent intercalation. For noncovalent intercalation, DNA can be reused after the small molecules are removed from the DNA via liquid-liquid extraction (LLE) with hexane (27,28). Therefore, to solve the problem of the high cost of DNA, researchers can conduct a similar study on the used DNA regeneration. Another research group in our laboratory is extracting common carp sperm DNA from common carp testes. The research results showed that the quality of the sperm DNA was close to the DNA products on the market, but its source is rich and its price is very low. Common carp sperm DNA can not only completely replace the DNA products on the market, but also can meet the requirements of future large-scale production.
CHR is released from automobile exhaust, cigarette smoke, wood smoke, and smoked foods, is usually adsorbed onto the surface of tiny solid particles and circulated into water, air, soil, and sediments, and can enter the body through respiration or the food chain. CHR and its derivatives have mutagenic, carcinogenic (29), and genotoxic (30,31) effects in animal and cell culture studies. Prolonged exposure to CHR is believed to increase the incidence rates of skin, bladder, and lung cancers, and gastrointestinal tumors (32). However, the interacting characteristics of CHR with free DNA in vitro remain unknown. Therefore, the present research aimed to explore the interacting characteristics of CHR with herring sperm DNA in vitro by UV-visible spectra (UV-vis), DNA thermal denaturation measurement, fluorescence spectra, circular dichroism (CD) spectra, and fluorescence microscopy. The driving forces of CHR that interacted with DNA were explored by thermodynamic studies. In addition, the CHR removal assay of activated carbon was studied for comparison, CHR was removed from contaminated water via DNA-intercalation and magnetic bead-based separation, and CHR removal efficiency was calculated. The results of this study will lay the foundation for the development of a new way of CHR elimination via DNA-intercalation in water pollution.
Experimental
Reagents
CHR (purity >99.9%) was provided by Dr. Ehrenstorfer GmbH, and the stock solution was prepared with ethanol (98%) and diluted to the desired concentration by using Tris-HCl buffer solution (pH 7.40). The herring sperm DNA (Solarbio Science & Technology Co., Ltd) solution was prepared by dissolving in Tris-HCl buffer solution (pH 7.40). The DNA concentration was calculated using the equation A260 nm = εbc (ε260 = 6,600 L /mol × cm). Magnetic beads (50 mg/mL) were provided by Enriching Biotechnology Co., Ltd. A binding buffer solution (2 mol/L potassium chloride, 10 mM Tris-EDTA) was prepared for the adsorption of DNA onto magnetic beads. The reagents used in the experiment were of analytical grade and were all kept in cold storage at 4 ºC in darkness.
Apparatus
The UV-vis spectrum was recorded using the Cary-60 UV-Spectrometer (Agilent Technology). Fluorescence spectroscopy was carried out using a RF-5301PC fluorescence spectrophotometer (Shimadzu). The CD spectra were obtained using a CD spectrometer (Applied Photophysics Ltd.). The pH values were measured using a pHS-3C pH meter (INESA Scientific Instrument Co., Ltd.). A fluorescence microscope (DM4B, Leica) was used to observe the magnetic beads. The solution in the centrifuge tube was incubated in an incubator shaker (IS-RDV3, Crystal).
Methods
UV-vis Spectra Study Experiment
The UV-vis spectra of the interaction between CHR and DNA were recorded using a UV spectrometer at room temperature. CHR solution (3.26 × 10⁻⁴ mol/L) was first added to DNA solution (5.45 × 10⁻⁵ mol/L). Approximately 10 µL was added each time, and the spectra were scanned and recorded. Then, DNA solution (2.12 × 10⁻³ mol/L) was added into the CHR solution (9.51 × 10⁻⁶ mol/L). The spectra of CHR were scanned and recorded. After each titration, the solution was mixed thoroughly and allowed to stand for 10 min to make the reaction reach an equilibrium.
Thermal Denaturation Experiment
DNA solution (1.96 × 10⁻⁵ mol/L) and the DNA–CHR mixed solution (3.30 × 10⁻⁶ mol/L) were prepared in two colorimetric tubes, respectively. The two solutions were evenly mixed and respectively heated from 30 ºC to 100 ºC in a water bath, and the absorbance of DNA without or with CHR at 260 nm was measured by every 5 ºC. The DNA thermal denaturation curve (fss vs. T) was obtained according to equation 1.


where A represents the absorbance (A260 nm) at the corresponding temperature and A0 and Af are the absorbance (A260 nm) values at 30 ºC and 100 ºC, respectively.
Fluorescence Spectral Measurements
Fluorescence spectroscopy was carried out by gradually adding DNA solution (4.96 × 10⁻⁵ mol/L) into a quartz cell containing CHR solution (9.82 × 10⁻⁷ mol/L). Adding approximately 10 µL each time, the solution was mixed thoroughly and allowed to stand for 10 min to achieve equilibrium at room temperature. Fluorescence spectra were scanned and recorded in the wavelength range of 220–600 nm. The excitation wavelength was 265 nm. The following parameters were set: sensitivity: high; slit width: EX: 5 nm, EM: 10 nm.
CD Spectra Experiment
DNA solution (4.56 × 10⁻⁵ mol/L) was added to three colorimetry tubes, and then added with different volumes (0, 0.3, 0.6 mL) of CHR solution (7.30 × 10⁻⁵ mol/L) into the three colorimetric tubes. The Tris-HCl buffer solution (pH 7.40) was used to fix the final volume of solution to 4 mL. After fully mixing, the CD spectra were scanned using a CD spectrometer. The following parameters were set: scanning range: 200–550 nm; time-per-point: 0.3 s; and bandwidth: 1.0 nm.
CHR Removal Assays of Activated Carbon or DNA
For the CHR removal assay of activated carbon, 0.8 mg of powdery activated carbon and 0.5 mL Tris-HCl buffer solution (pH 7.40) were added into an Eppendorf (EP) tube, with solution (pH 7.40), which was shaken at a speed of 300 rpm for 30 min to fully infiltrate the active carbon. The supernatant was removed after centrifugation at a speed of 12,000 rpm for 10 min. Thereafter, 0.5 mL of CHR solution (9.28 × 10⁻⁶ mol/L) and 0.4 mL Tris-HCl buffer solution (pH 7.40) were added into the EP tube. Then, the sample was incubated at a shaking speed of 300 rpm at 40 °C for 70 min. Finally, the supernatant was collected to determine residual CHR amount.
For the CHR removal assay of DNA, 0.1 mL of DNA solution (5.62 × 10⁻⁵ mol/L) and 0.5 mL of CHR solution (9.28 × 10⁻⁶ mol/L) were added into an EP tube at 40 ºC for 10 min. Then, 0.1 mL of magnetic bead suspension (50 mg/mL) and 0.2 mL of binding buffer solution were added to the tube, which was then incubated at a shaking speed of 300 rpm at 40 ºC for 60 min. The EP tube was placed on the magnetic separator and allowed to stand for 2 min, and the supernatant was collected to determine to residual CHR amount.
The separated magnetic beads were observed under the fluorescence microscope. After elution with 98% ethanol, 1 μL of magnetic bead was used to make glass slide and observed under the fluorescence microscope.
Residual CHR amount was determined by fluorescence intensity according to a linear equation fitted with the concentration of CHR and fluorescence intensity (EX=265 nm, EM=382 nm). The CHR removal efficiency (%) and CHR adsorption capacity (Q) obtained by combining CHR with activated carbon or DNA adsorbed by magnetic beads were measured by the following equations 2 and 3:


where C0 and V0 are the initial concentration and volume of CHR, respectively, Cf and Vf are the residual CHR concentration and final volume of supernatant, respectively, and m represents the amount of activated carbon or DNA.
Results and Discussion
Binding Mode of CHR with DNA
UV-vis Absorption Spectra Study
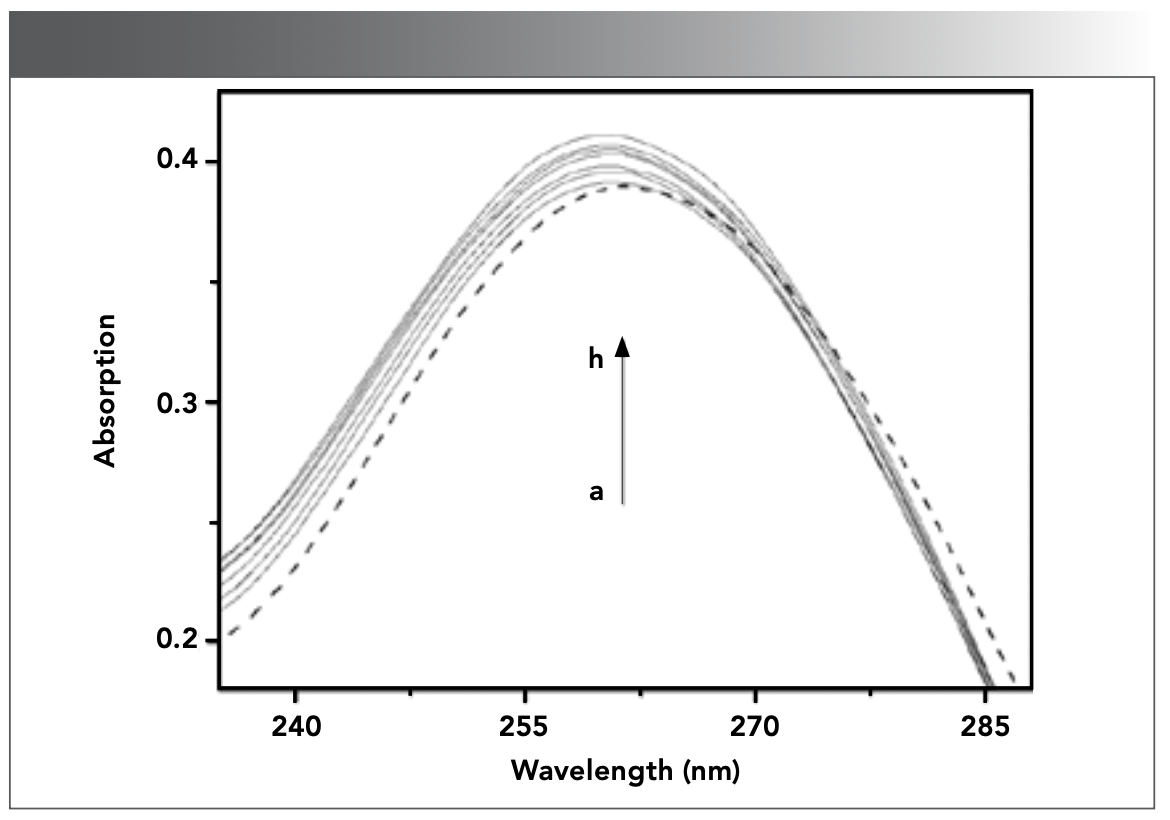
UV-vis spectroscopy is one of the classical and effective methods to explore the interaction mode of some small molecular substances with DNA (33). The UV-vis spectra of DNA in the absence and different concentrations of CHR were displayed in Figure 1. The characteristic absorption peak of DNA without CHR appeared near 260 nm. However, with the gradual increase of CHR concentration, the absorption peak near 260 nm exhibited hyperchromic effect accompanied with a blue shift of 2 nm. The hyperchromic effect and the change of band position are related to the base stacking changes between adjacent DNA base pairs caused by the interaction between small molecules and DNA (34,35). Therefore, the results of UV-vis absorption spectra in Figure 1 indicated that the binding of CHR with DNA led to the change of DNA conformation.

![FIGURE 1: UV-visible spectra of DNA (5.45 × 10⁻⁵ mol/L) in the absence and presence of CHR in Tris-HCl buffer solution (pH 7.40) at room temperature. a–h: [CHR]= 0, 1.08, 2.16, 3.23, 4.29, 5.34, 6.39, and 7.43 × 10⁻⁶ mol/L.](/_next/image?url=https%3A%2F%2Fcdn.sanity.io%2Fimages%2F0vv8moc6%2Fspectroscopy%2F82dcda3d481f7491b5d55cfc0a4ce11e6876d581-1170x820.png%3Ffit%3Dcrop%26auto%3Dformat&w=3840&q=75 "FIGURE 1: UV-visible spectra of DNA (5.45 × 10-5 mol/L) in the absence and presence of CHR in Tris-HCl buffer solution (pH 7.40) at room temperature. a–h: [CHR]= 0, 1.08, 2.16, 3.23, 4.29, 5.34, 6.39, and 7.43 × 10⁻⁶ mol/L.")
FIGURE 1: UV-visible spectra of DNA (5.45 × 10⁻⁵ mol/L) in the absence and presence of CHR in Tris-HCl buffer solution (pH 7.40) at room temperature. a–h: [CHR]= 0, 1.08, 2.16, 3.23, 4.29, 5.34, 6.39, and 7.43 × 10⁻⁶ mol/L.
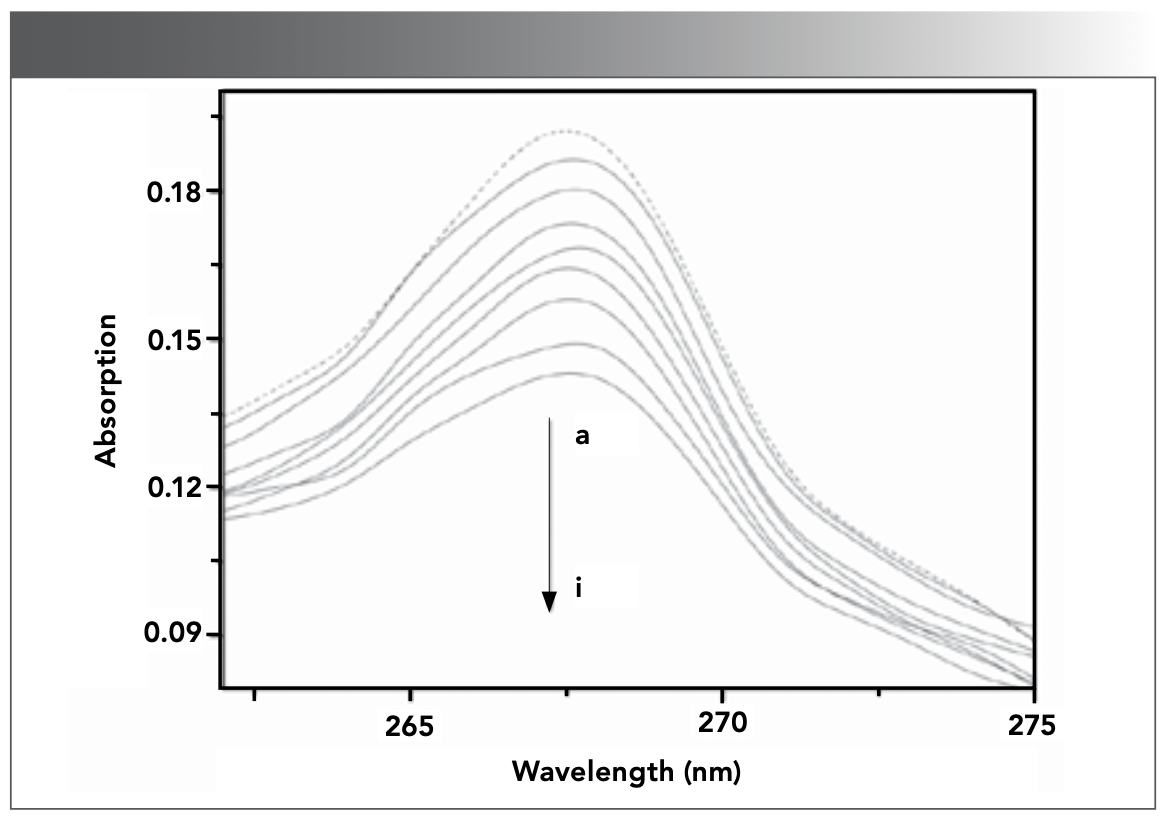
After DNA was continuously added into CHR solution, the UV-vis absorption spectra of CHR were obtained in the absence and different concentration of DNA, as displayed in Figure 2, in which the characteristic absorption peak of CHR without DNA appeared at 267 nm. With the increase of DNA concentration, the UV-vis absorption peak at 267 nm exhibited a hypochromatic effect with a degree of hypochromicity of up to 26.4% and a slight red shift. The strong hypochromic effect and red shift phenomenon are often caused by the intercalation between the small molecule and DNA (36,37). This phenomenon may be caused by the accumulation of the π electron and the strong stacking interaction of π–π aromatics in the fused ring structure of drug and the planar ring structure of DNA base pairs (38,39). The results of UV-vis spectra indicated that the interaction between DNA and CHR was intercalation, which decreased the energy levels and the reduction of probability of π–π transition, resulting in hypochromic effect.

![FIGURE 2: UV–visible spectra of CHR (9.51 × 10⁻⁶ mol/L) in the absence and presence of DNA in Tris-HCl buffer solution (pH 7.40) at room temperature. a–i: [DNA]= 0, 0.70, 1.40, 2.10, 2.79, 3.48, 4.16, 4.83, 5.51 × 10⁻⁵ mol/L.](/_next/image?url=https%3A%2F%2Fcdn.sanity.io%2Fimages%2F0vv8moc6%2Fspectroscopy%2Fbe17ef59ccd8362cef36aad96a1bc4e04e617874-1168x824.png%3Ffit%3Dcrop%26auto%3Dformat&w=3840&q=75 "FIGURE 2: UV–visible spectra of CHR (9.51 × 10-6 mol/L) in the absence and presence of DNA in Tris-HCl buffer solution (pH 7.40) at room temperature. a–i: [DNA]= 0, 0.70, 1.40, 2.10, 2.79, 3.48, 4.16, 4.83, 5.51 × 10⁻⁵ mol/L.")
FIGURE 2: UV–visible spectra of CHR (9.51 × 10⁻⁶ mol/L) in the absence and presence of DNA in Tris-HCl buffer solution (pH 7.40) at room temperature. a–i: [DNA]= 0, 0.70, 1.40, 2.10, 2.79, 3.48, 4.16, 4.83, 5.51 × 10⁻⁵ mol/L.
DNA Thermal Denaturation Study
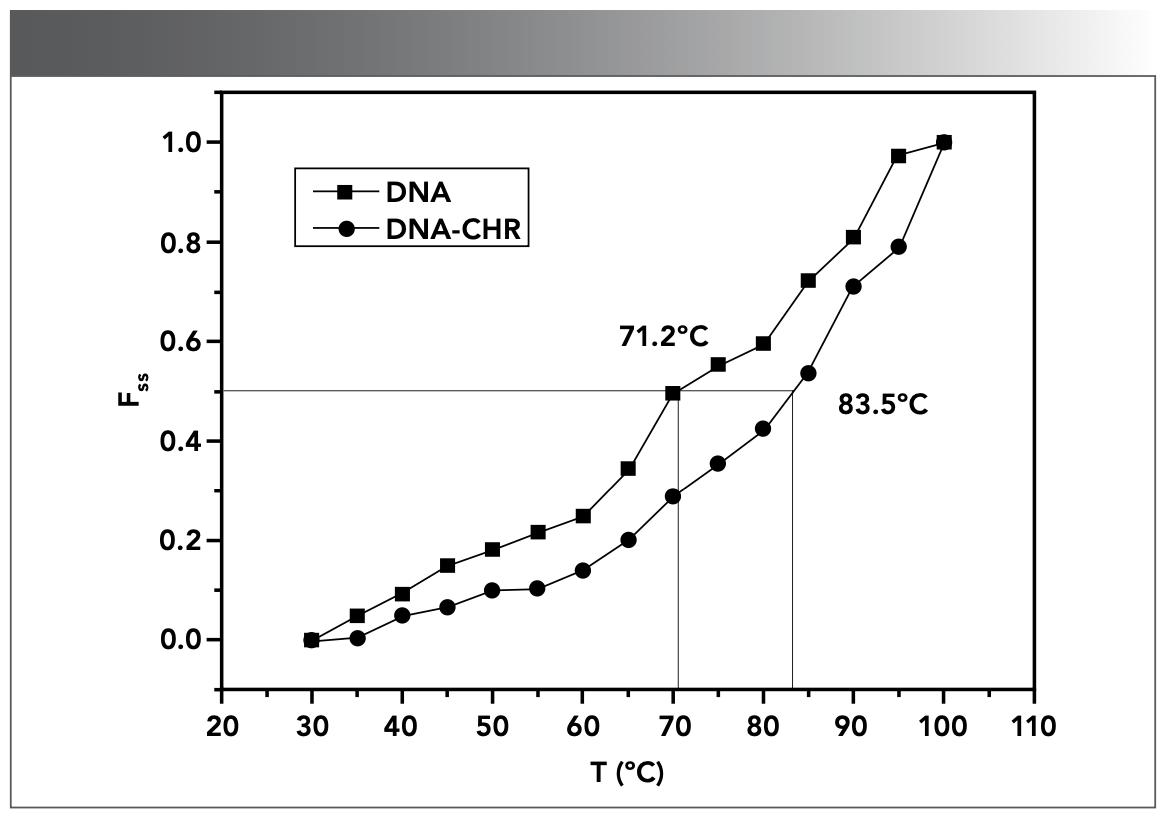
With the increase of temperature, the double helix structure of double-stranded DNA unwinds. The temperature at which DNA loses half-helix structure is defined as DNA melting point (Tm). The change in Tm is related to the stability of DNA and is an index to measure the stability of the DNA molecule (40). Intercalating molecules such as ethidium bromide (EB) can increase the stability of DNA double helix conformation after interacting with DNA, which is characterized by the increase of melting point; hence, the change of Tm is often used to determine whether the molecule intercalated with DNA (41,42). However, small molecules interact with DNA via electrostatic absorption or groove interaction, which cannot considerably affect the melting point of DNA, and Tm does not increase considerably (43).
The Tm values of DNA and DNA–CHR mixture obtained from the melting curves in Figure 3 were 71.2 ± 0.1 and 83.5 ± 0.1 ºC, respectively. The Tm of DNA was increased by 12.3 ºC after the addition of CHR. This finding suggested that in the presence of CHR, double-stranded DNA was more stable. The changes of the melting point of DNA with and without CHR indicated that intercalation occurred between CHR and DNA.

 without and with CHR (3.30 × 10⁻⁶ mol/L) in Tris-HCl buffer (pH 7.40).")
FIGURE 3: Melting curves of DNA (1.96 × 10⁻⁵ mol/L) without and with CHR (3.30 × 10⁻⁶ mol/L) in Tris-HCl buffer (pH 7.40).
Fluorescence Study
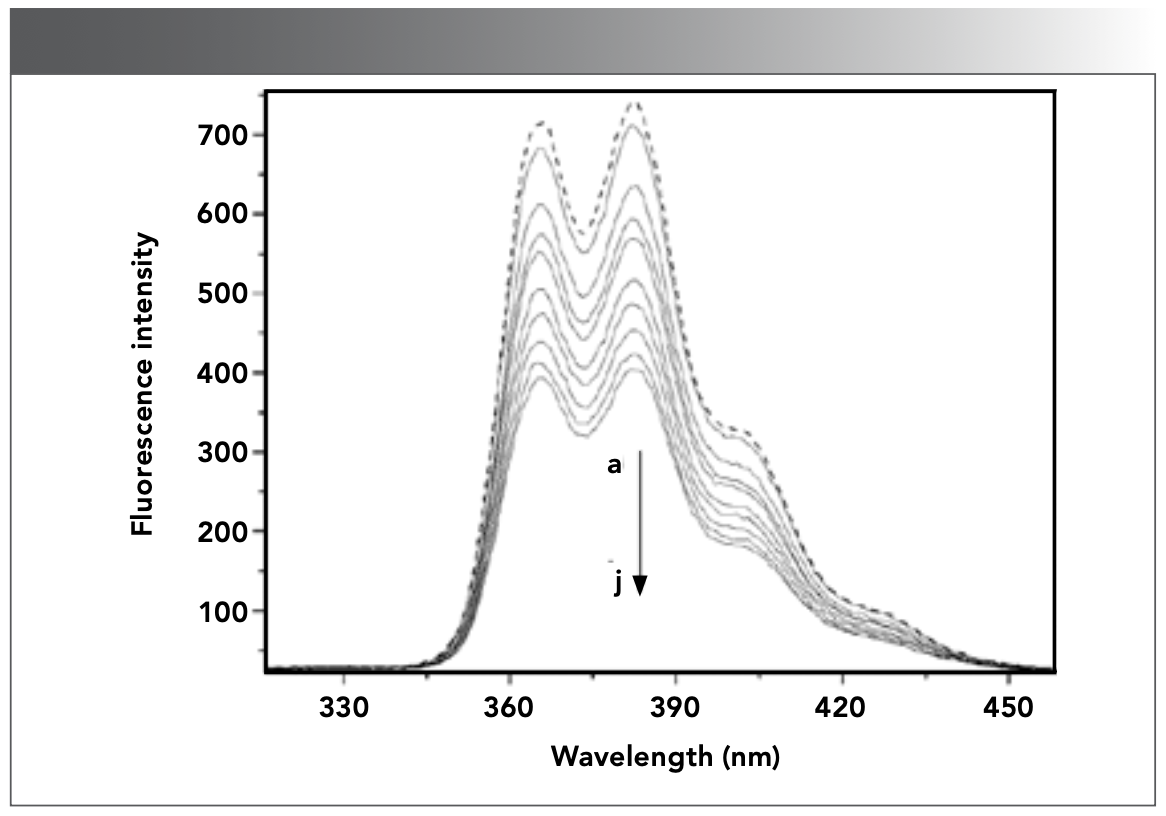
Fluorescence spectrometric analysis is a sensitive and simple detection method, and the changes of fluorescence intensity before and after the interaction between small molecules and DNA can be used to obtain some information about the interaction between the two molecules (44). As shown in Figure 4, the fluorescence emission peaks of CHR appeared at 364 and 382 nm, and the fluorescence intensity at 382 nm was the strongest. As the DNA concentration gradually increased, the intensity of fluorescence peak at 382 nm gradually decreased. Some studies reported that fluorescence quenching agent is a substance, which interacts with fluorescent molecules and decreases its fluorescence intensity (45). The results in Figure 4 showed that DNA was the fluorescence quenching agent of CHR, and the fluorescence of CHR could be remarkably quenched by DNA because of the interaction of CHR with DNA.

![FIGURE 4: Fluorescence emission spectra of CHR (9.82 × 10⁻⁷ mol/L) in the absence and presence of DNA in Tris-HCl buffer solution (pH 7.40) at room temperature. a–j: [DNA]= 0, 0.17, 0.33, 0.50, 0.65, 0.81, 0.97, 1.13, 1.29, and 1.45 × 10⁻⁶ mol/L.](/_next/image?url=https%3A%2F%2Fcdn.sanity.io%2Fimages%2F0vv8moc6%2Fspectroscopy%2F56513e909c32adb7a78d75def6884a61fc78e819-1166x816.png%3Ffit%3Dcrop%26auto%3Dformat&w=3840&q=75 "FIGURE 4: Fluorescence emission spectra of CHR (9.82 × 10-7 mol/L) in the absence and presence of DNA in Tris-HCl buffer solution (pH 7.40) at room temperature. a–j: [DNA]= 0, 0.17, 0.33, 0.50, 0.65, 0.81, 0.97, 1.13, 1.29, and 1.45 × 10⁻⁶ mol/L.")
FIGURE 4: Fluorescence emission spectra of CHR (9.82 × 10⁻⁷ mol/L) in the absence and presence of DNA in Tris-HCl buffer solution (pH 7.40) at room temperature. a–j: [DNA]= 0, 0.17, 0.33, 0.50, 0.65, 0.81, 0.97, 1.13, 1.29, and 1.45 × 10⁻⁶ mol/L.
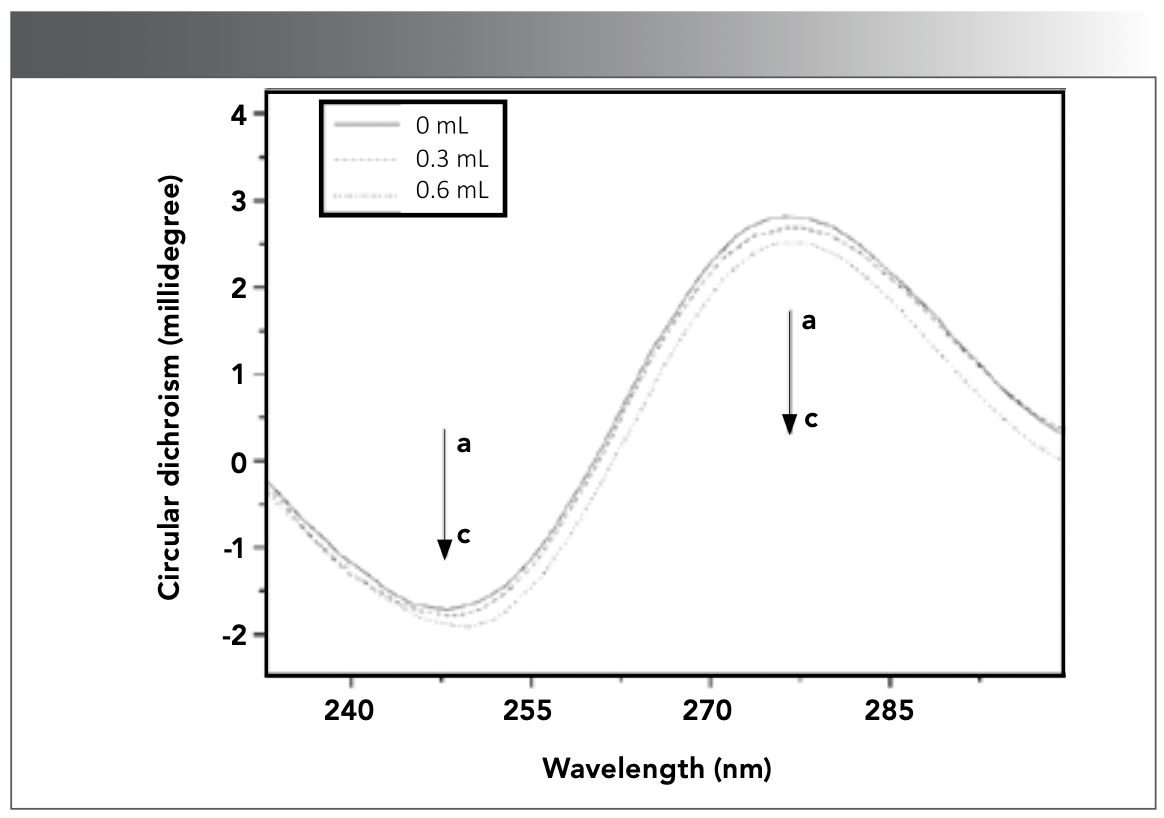
CD Spectroscopy
CD spectroscopy is a useful method for examining the geometric modes of in which small molecules binding to DNA and is an important means to detect conformational changes of the DNA (46–48). In 1953, the basic arrangement of DNA was discovered as the right-handed double helix of B-type, and its characteristic CD peak was located at 230–300 nm, in which the positive peak appeared at 260–280 nm corresponding to DNA base pairs accumulation, and the negative peak appeared at near 245 nm corresponding to the right-handed helicity of DNA (49). Considering the sensitivity of CD spectra, the changes in these two signal peaks can clearly distinguish the mode of DNA interaction with small molecules (50). If small molecules bind to DNA through intercalating binding mode, they will lead to changes in peak position and strength. However, after interacting with DNA through electrostatic adsorption or groove binding, they will only slightly affect the helix structure of DNA and base accumulation, and the peak position and strength will hardly change (51).
The CD spectra of DNA without or with CHR were displayed in Figure 5, in which the negative and positive CD characteristic peaks of DNA without CHR appeared at 248 and 277 nm, respectively. With the increase of CHR concentration, the negative peak CD signal intensity increased, and the positive characteristic peak CD signal intensity decreased. The increase of CD signal intensity at 248 nm can be attributed to the change of DNA structure. The decrease in the intensity of the positive characteristic peak may be caused by the transformation of B-type DNA to other conformations (52). Intercalated complexes could also change the interaction between DNA bases and accumulation of bases and lead to changes in CD signal intensity (53). Therefore, the obvious changes in CD characteristic peaks showed that the structure of DNA changed, and the base accumulation of DNA was affected, indicating that CHR was bound to DNA by intercalating mode.

![FIGURE 5: CD spectra of DNA (4.56 × 10⁻⁵ mol/L) in the absence and presence of CHR in Tris-HCl buffer solution (pH 7.40) at room temperature. a–c: [CHR] = 0, 5.47, 10.95 × 10⁻⁶ mol/L.](/_next/image?url=https%3A%2F%2Fcdn.sanity.io%2Fimages%2F0vv8moc6%2Fspectroscopy%2F2abc15bd91457fcc5729c888ed582dd62a7c28b9-1164x818.png%3Ffit%3Dcrop%26auto%3Dformat&w=3840&q=75 "FIGURE 5: CD spectra of DNA (4.56 × 10-5 mol/L) in the absence and presence of CHR in Tris-HCl buffer solution (pH 7.40) at room temperature. a–c: [CHR] = 0, 5.47, 10.95 × 10⁻⁶ mol/L.")
FIGURE 5: CD spectra of DNA (4.56 × 10⁻⁵ mol/L) in the absence and presence of CHR in Tris-HCl buffer solution (pH 7.40) at room temperature. a–c: [CHR] = 0, 5.47, 10.95 × 10⁻⁶ mol/L.
Fluorescence Microscopic Observation
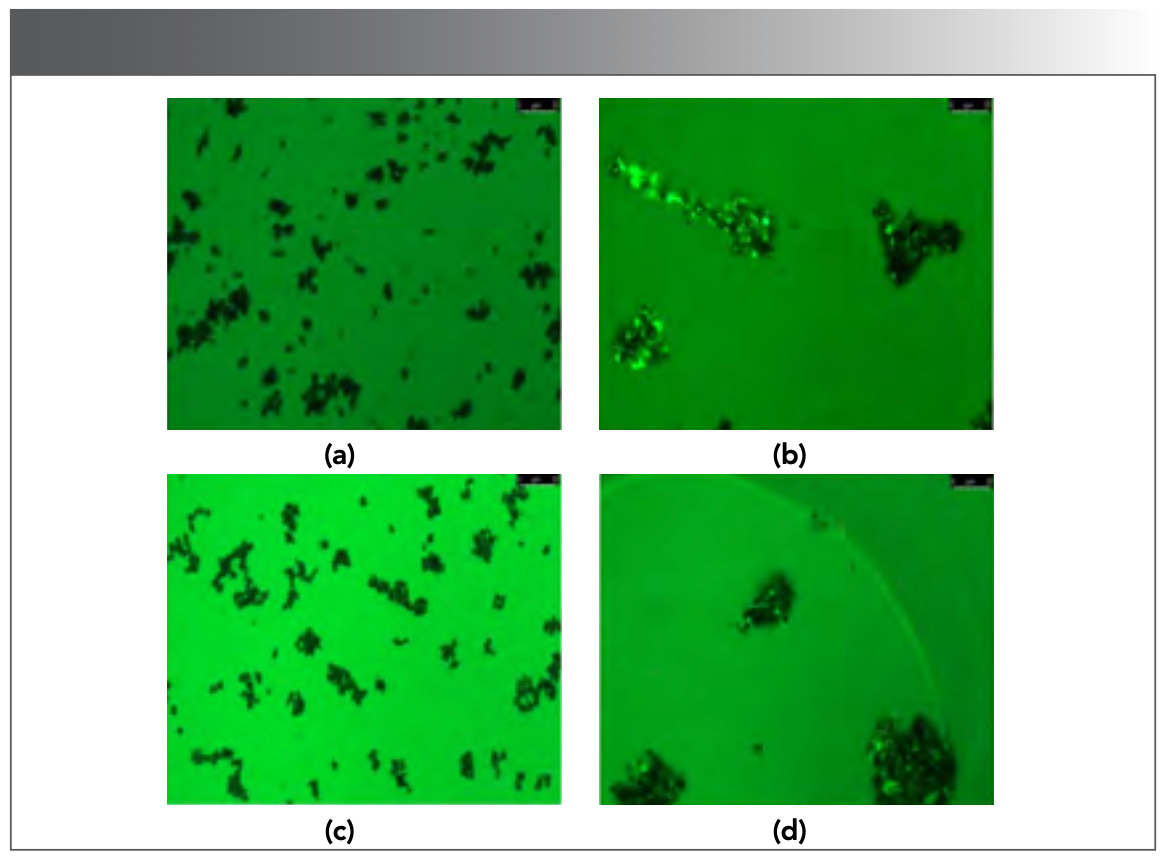
As carriers of biomolecules, magnetic beads have the characteristics of simple operation and efficient separation (54). The magnetic beads used in this experiment are surface modified superparamagnetic silicon particles composed of magnetic core and silicon dioxide coating, and this material can selectively bind to nucleic acid in the optimized binding solution system because of the abundant silanol groups on its surface. Generally, EB binds to DNA through intercalating mode, and it is a typical DNA intercalation agent (55). However, free EB itself does not have fluorescence, and the bright fluorescence is only produced when EB combines with the DNA. Therefore, EB could be used as a control in fluorescence microscopy to determine the interaction between small molecules and DNA.
As shown in Figure 6a, the DNA–magnetic bead complexes have no fluorescent points under the fluorescence microscope. However, many fluorescent points appeared with the addition of EB. Moreover, the bright points did not disappear after elution (Figure 6b), indicating that magnetic beads can strongly adsorb DNA, and EB successfully intercalated into DNA. By contrast, free CHR itself has strong fluorescence. However, when the magnetic beads were mixed with CHR, no fluorescent points were found under the fluorescence microscope after elution (Figure 6c). Therefore, the magnetic beads could not adsorb CHR. By contrast, when CHR combined with DNA, fluorescence points were still observed under the fluorescence microscope after elution (Figure 6d), indicating the formation of a stable complex of CHR with DNA. The results observed from magnetic beads–DNA–CHR were similar to those from magnetic beads–DNA–EB under fluorescence microscope. Therefore, the formation of CHR–DNA complex was caused by the intercalation of CHR with DNA, and the CHR bound to DNA can be removed via DNA-intercalation and magnetic bead-based separation.

 Observation of DNA–magnetic beads under the fluorescence microscope; (b) Observation of EB–DNA–magnetic beads under the fluorescence microscope after elution; (c) Observation of CHR–magnetic beads under the fluorescence microscope after elution; (d) Observation of CHR–DNA–magnetic beads under the fluorescence microscope after elution.")
FIGURE 6: (a) Observation of DNA–magnetic beads under the fluorescence microscope; (b) Observation of EB–DNA–magnetic beads under the fluorescence microscope after elution; (c) Observation of CHR–magnetic beads under the fluorescence microscope after elution; (d) Observation of CHR–DNA–magnetic beads under the fluorescence microscope after elution.
CHR Removal Efficiency from Contaminated Water
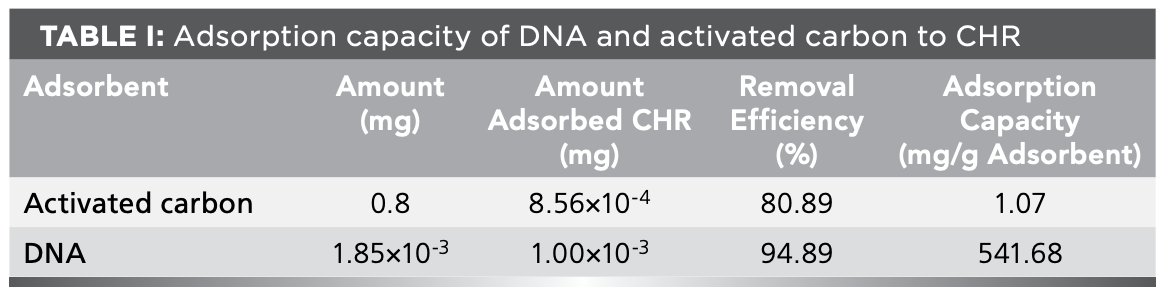
The CHR removal assay of DNA via DNA-intercalation and magnetic beads-based separation was studied to determine whether DNA can remove CHR from contaminated water, and activated carbon was used to remove CHR for comparison. The CHR adsorption efficiency and capacity of DNA or active carbon were displayed in Table I. As shown in Table I, the CHR removal efficiency of activated carbon was 80.89%, while that of DNA reached 94.89%. The CHR adsorption capacity of activated carbon was 1.07 mg/g (4.69 × 10⁻⁶ mol/g). However, the CHR adsorption capacity of DNA was 541.68 mg/g (2.37 × 10⁻³ mol/g) even when the amount of activated carbon was 400 times that of DNA. Therefore, the DNA could more effectively remove CHR than activated carbon, and CHR could be effectively removed from contaminated water via DNA-intercalation and magnetic bead-based separation.


Interaction Mechanism Between CHR and DNA
Fluorescence Quenching Mechanism
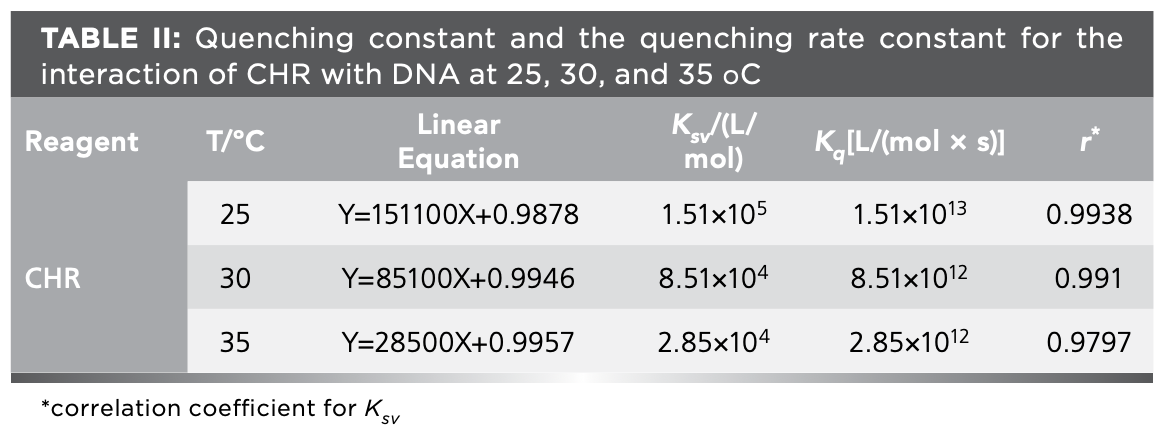
The determination of quenching type is an essential step in the study of binding mechanism between drug molecules and DNA, and this process mainly includes two types namely, static quenching caused by the formation of complex and dynamic quenching caused by collision (56). Generally, the quenching type is identified using following equation 4 (57):


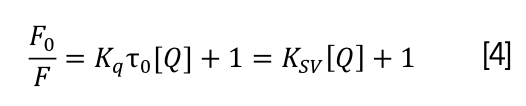
where F0 and F represent fluorescence intensity of CHR without or with DNA, respectively, [Q] represents the concentration of DNA, and τ0 (approximately 1 × 10⁻⁸ s) is defined as the average life expectancy of the molecule without quencher (58). KSV represents linear Stern–Volmer dynamic quenching constant, and Kq represents rate constant of the quenching process.
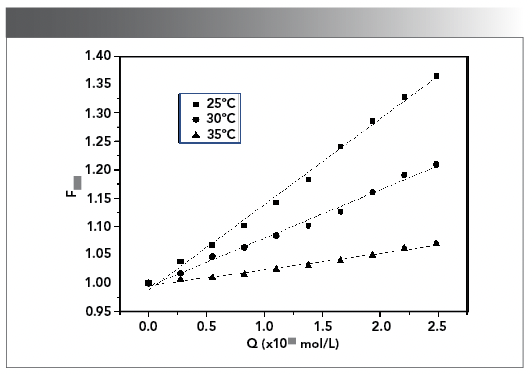
The change of KSV in the Stern–Volmer equation is an indicator for identifying the type of fluorescence quenching. KSV decreases with the gradual increase of temperature, indicating static quenching, while the opposite result is dynamic quenching (59). Figure 7 showed the fluorescence quenching curves of CHR–DNA at 25, 30, and 35 ºC. As shown in Figure 7, KSV decreased with the increase in temperature, which was consistent with the phenomenon of static quenching process. Meanwhile, Kq values at various temperatures all exceeded 2 × 10¹⁰ [L/(mol × s)] (the maximum collision quenching rate constant) (Table II) (60), indicating that DNA had the static quenching effect on CHR. Therefore, the ground state complex was formed because of the interaction between CHR and DNA.


Figure 7: The Stern-Volmer curves for the quenching of CHR by DNA at 25, 30, and 35 ºC respectively.


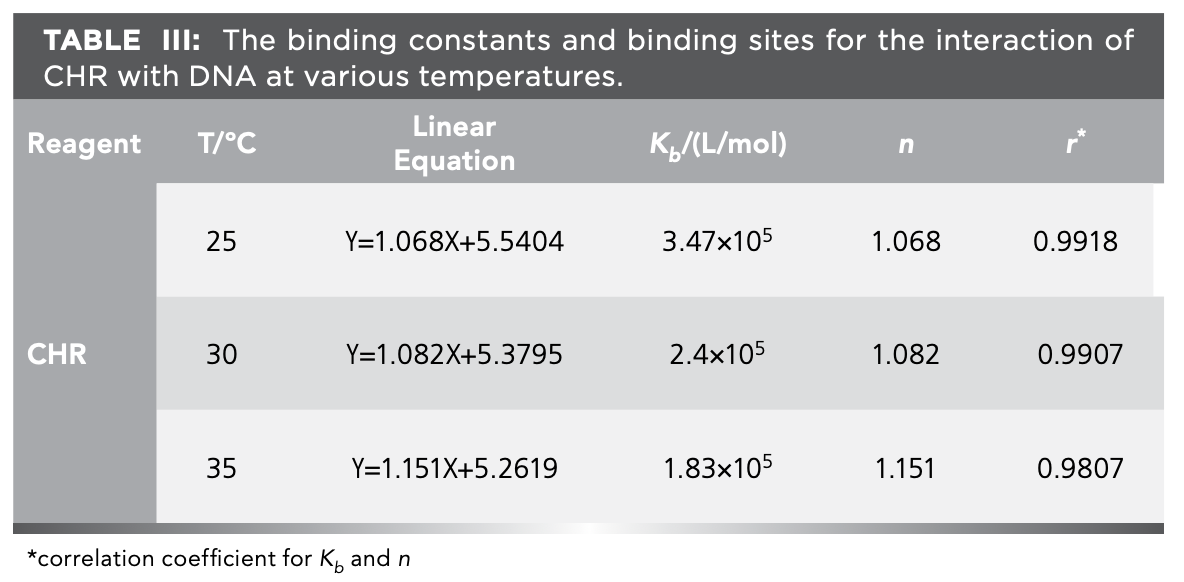
Binding Constant and Binding Site
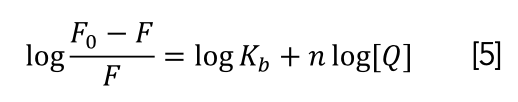
The fluorescence spectra can effectively determine the interaction of DNA with small molecules, and an equation can be used to carry out linear fitting to calculate the binding ability, binding site, and other parameters (61). Equation 5 (62) was used to determine binding constants (Kb) and binding sites (n).


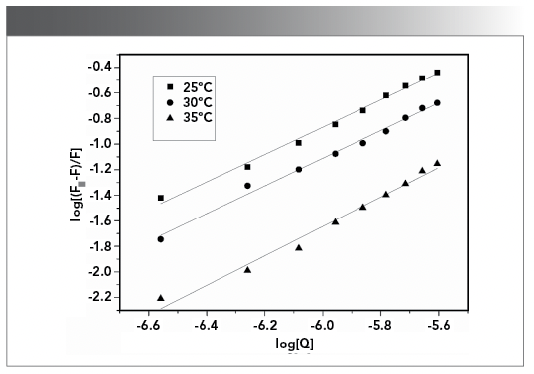
Log(F0-F)/F versus log[Q] curve was shown in Figure 8, in which the slope and intercept represented the logarithm of the binding consant (Kb) and the binding site (n) between the CHR and DNA at various temperatures. Binding constants at 25, 30, and 35 ºC were 3.47 × 10⁵, 2.4 × 10⁵, and 1.83 × 10⁵ L/mol (Table III). The results showed the binding force of CHR with DNA was strong.


Figure 8: Double logarithmic plots for the interaction of CHR with DNA at various temperatures.


Thermodynamic Parameters
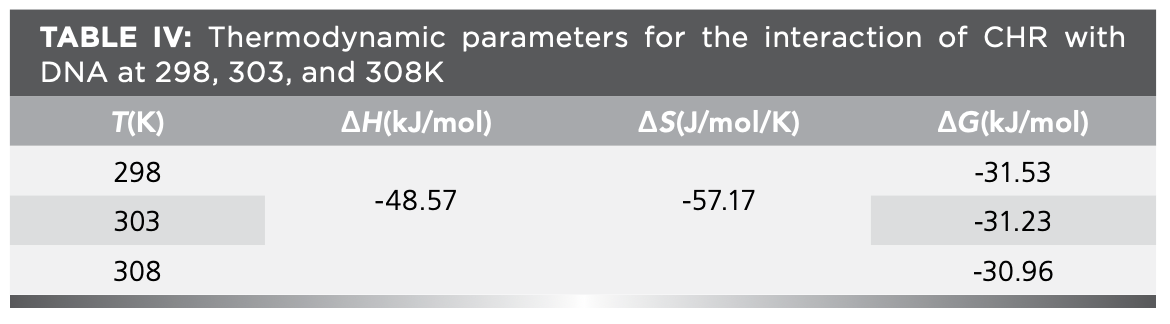
Ross proposed the relationship between thermodynamic constants and binding modes to determine the main forces of small-molecule drugs interacting with biomolecules (63). Thermodynamic constants are evaluated using the following equations 6 and 7:

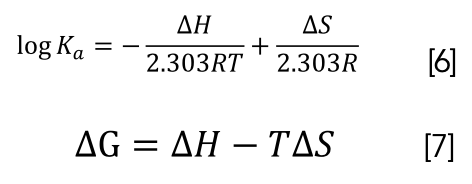

where R is the gas constant. ΔH is the change of enthalpy. ΔS is the change of entropy. ΔG is the Gibbs free energy and T is the temperature in Kelvin.
The main driving forces of the interaction of small-molecule drugs with DNA are hydrophobic interaction, electrostatic force, and van der Waals force. ∆H and ∆S can be obtained from the slope and intercept of linear plot of log Ka versus 1/T. The results were shown in Table IV. ∆H and ∆S were negative, indicating that the main forces of interaction of CHR with DNA were π–π electron donor–acceptor interactions and van der Waals force. ∆G < 0 also indicated that the reaction was spontaneous in vitro.


Conclusions
Intercalation, groove binding, and electrostatic adsorption are the three main binding modes of small molecule with DNA. Among these processes, intercalation is the most stable, and it is often used as a key indicator for screening clinical anti-tumor drugs. In this paper, the results of UV-vis spectra, DNA thermal denaturation, CD spectra, and fluorescence microscopy showed that CHR interacted with herring sperm DNA in an intercalation mode in vitro. The fluorescence spectra also showed that static quenching occurred between CHR and DNA. Furthermore, the thermodynamic parameters indicated that π–π electron donor–acceptor interactions and van der Waals force remarked affected the interaction between CHR and DNA, and the interaction could occur without any enzyme catalysis in vitro. Finally, CHR removal efficiency of DNA was 94.89% when the initial concentration of CHR was 9.28 × 10⁻⁶ mol/L, and this efficiency was better than that of active carbon (80.89%) even when the amount of activated carbon was 400 times that of DNA. The CHR removal assays indicated that CHR could be effectively separated or removed from contaminated water by DNA via DNA-intercalation and magnetic beads-based separation. Future studies may focus on the recovery and regeneration of the used DNA, or the replacement of traditional DNA products by common carp sperm DNA with rich sources and low price. These innovative methods can be applied for the preparation of some biomaterials designed by common carp sperm DNA, which will further expand the application of DNA. Therefore, this study allowed the removal of PAHs from contaminated environment through PAHs–DNA intercalation.
Acknowledgments
This work was supported by the National Natural Science Foundation of China (Grant numbers: 22265003 and 21966008).
Declaration of Interest Statement
The authors have no relevant financial or non-financial interests to disclose.
References
(1) Haritash, A. K.; Kaushik, C. P. Biodegradation Aspects of Polycyclic Aromatic Hydrocarbons (PAHs): A Review. J. Hazard. Mater. 2009, 169 (1–3), 1–15. DOI: 10.1016/j.jhazmat.2009.03.137
(2) Tilton, S. C.; Siddens, L. K.; Krueger, S. K.; et al. Mechanism-Based Classification of PAH Mixtures to Predict Carcinogenic Potential. Toxicol. Sci. 2015, 146 (1), 135–145. DOI: 10.1093/toxsci/kfv080
(3) The Carcinogenic Effects of Polycyclic Aromatic Hydrocarbons; Luch, A., Ed.; Imperial College Press, 2005. DOI: 10.1142/p306
(4) Carter, R. L. IARC Monographs on the Evaluation of Carcinogenic Risk of Chemicals to Man. Volume 8: Some Aromatic Azo Compounds. J. Clin. Pathol. 1976, 29 (4), 367. DOI: 10.1136/jcp.29.4.367-c
(5) Gichner, T. IARC Monographs on the Evaluation of the Carcinogenic Risk of Chemicals to Humans. Volume 32. Polynuclear Aromatic Compounds, Part 1, Chemical, Environmental and Experimental Data. Biol. Plant. 1985, 27 (1), 33. DOI: 10.1007/BF02894630
(6) Jacob, J. The Significance of Polycyclic Aromatic Hydrocarbons as Environmental Carcinogens. Pure Appl. Chem. 1996, 68 (2), 301–308. DOI: 10.1351/pac199668020301
(7) Guo, Y.; Wu, K.; Huo, X.; Xu, X. Sources, Distribution, and Toxicity of Polycyclic Aromatic Hydrocarbons. J. Environ. Health 2011, 73 (9), 22–25. https://www.jstor.org/stable/26329217
(8) Rice, D. C. The US EPA Reference Dose for Methylmercury: Sources of Uncertainty. Environ. Res. 2004, 95 (3), 406–413. DOI: 10.1016/j.envres.2003.08.013
(9) N. Darajeh, H. Alizadeh, H. Farraji, et al. Removal of Polycyclic Aromatic Hydrocarbons (PAHs) by Different Physicochemical Methods: A Mini-Review. J. Energy Environ. Pollut. 2020, 1 (2), 44–50. DOI: 10.47277/JEEP/1(2)50
(10) Torres, E.; Bustos-Jaimes, I.; Le Borgne, S. Potential Use of Oxidative Enzymes for the Detoxification of Organic Pollutants. Appl. Catal. B-Environ. 2003, 46, 1–15. DOI: 10.1016/S0926-3373(03)00228-5
(11) Majcherczyk, A.; Johannes, C.; Hüttermann, A. Oxidation of Polycyclic Aromatic Hydrocarbons (PAH) by Laccase of Trametes Versicolor. Enzyme. Microb. Tech. 1998, 22, 335–341. DOI: 10.1016/S0141-0229(97)00199-3
(12) Lehto, K. M.; Vuorimaa, E.; Lemmetyinen, H. Photolysis of Polycyclic Aromatic Hydrocarbons (PAHs) in Dilute Aqueous Solutions Detected by Fluorescence. J. Photoch. Photobio. A 2000, 136, 53–60. DOI: 10.1016/S1010-6030(00)00321-X
(13) Sabaté, J.; Bayona, J. M.; Solanas, A. M. Photolysis of PAHs in Aqueous Phase by UV Irradiation. Chemosphere 2001, 44, 119–124. DOI: 10.1016/S0045-6535(00)00208-3
(14) Angove, M. J.; Fernandes, M. B.; Ikhsan, J. The Sorption of Anthracene onto Goethite and Kaolinite in the Presence of Some Benzene Carboxylic Acids. J. Colloid. Interface. Sci. 2002, 247, 282–289. DOI: 10.1006/jcis.2001.8133
(15) Douce, D. S.; Clench, M. R.; Cooke, M.; Wang, J. Evidence for the Adsorption of Nitrated Polycyclic Aromatic Hydrocarbons by Tree Bark. J. Chromatogr. A 1997, 786, 275–283. DOI: 10.1016/S0021-9673(97)00602-X
(16) Bogan, B. W.; Trbovic, V.; Paterek, J. R. Inclusion of Vegetable Oils in Fenton’s Chemistry for Remediation of PAH-Contaminated Soils. Chemosphere 2003, 50, 15–21. DOI: 10.1016/S0045-6535(02)00490-3
(17) Masten, S. J.; Davies, S. H. R. Efficacy of in-situ for the Remediation of PAH Contaminated Soils. J. Contam. Hydrol. 1997, 28, 327–335. DOI: 10.1016/S0169-7722(97)00019-3
(18) Lerman, L. S. Structural Considerations in the Interaction of DNA and Acridines. J. Mol. Biol. 1961, 3, 18–30. DOI: 10.1016/S0022-2836(61)80004-1
(19) Ferguson, L. R.; Denny, W. A. Genotoxicity of Non-Covalent Interactions: DNA Intercalators. Mutat. Res. 2007, 623, 14–23. DOI: 10.1016/j.mrfmmm.2007.03.014
(20) Li, L.; Lu, J.; Xu, C.; Li, H.; Yang, X. Studies on the Interaction Mechanism of Pyrene Derivatives with Human Tumor-Related DNA. Molecules 2012, 17, 14159–14173. DOI: 10.3390/molecules171214159
(21) Rescifina, A.; Zagni, C.; Mineo, P. G.; Giofrè, S. V.; Chiacchio, U.; Tommasone, S.; Talotta, C.; Gaeta, C.; Neri, P. DNA Recognition with Polycyclic-Aromatic-Hydrocarbon-Presenting Calixarene Conjugates. Eur. J. Org. Chem. 2014, 7605–7613. DOI: 10.1002/ejoc.201403050
(22) Liu, X. D.; Yamada, M.; Matsunaga, M.; Nishi, N. Functional Materials Derived from DNA. Adv. Polym. Sci. 2007, 209, 149–178. DOI: 10.1007/12_2006_106
(23) Yamada, M.; Kato, K.; Nomizu, M.; Sakairi, N.; Ohkawa, K.; Yamamoto, H.; Nishi, N. Preparation and Characterization of DNA Films Induced by UV Irradiation. Chem. Eur. J. 2002, 8, 1407–1412. DOI: 10.1002/1521-3765(20020315)8:6<1407::AID-CHEM1407>3.0.CO;2-L
(24) Iwata, K.; Sawadaishi, T.; Nishimura, S.; Tokura, S.; Nishi, N. Utilization of DNA as Functional Materials: Preparation of Filters Containing DNA Insolubilized with Alginic Acid Gel. Int. J. Bio. Macromol. 1996, 18, 149-150. DOI: 10.1016/0141-8130(95)01073-4
(25) Zhao, C. S.; Liu, X. D.; Nomizu, M.; Nishi, N. Preparation of DNA-Loaded Polysulfone Microspheres by Liquid–Liquid Phase Separation and its Functional Utilization. J. Colliod. Interf. Sci. 2004, 275, 470–476. DOI: 10.1016/j.jcis.2004.02.079
(26) Liu, X. D.; Yamada, M.; Matsunaga, M.; Nomizu, M.; Nishi, N. Preparation and Characterization of DNA Hydrogel Bead as Selective Adsorbent of Dioxins. Int. J. Bio. Macromol. 2005, 35, 193–199. DOI: 10.1016/j.ijbiomac.2005.01.008
(27) Liu, X. D.; Murayama, Y.; Yamada, M.; Nomizu, M.; Matsunaga, M.; Nishi, N. DNA Aqueous Solution Used for Dialytical Removal and Enrichment of Dioxin Derivatives. Int. J. Bio. Macromol. 2003, 32, 121–127. DOI: 10.1016/S0141-8130(03)00045-X
(28) Navarro, R. R.; Ichikawa, H.; Iimura, Y.; Tatsumi, K. Removal of Polycyclic Aromatic Hydrocarbons from Contaminated Soil by Aqueous DNA Solution. Environ. Sci. Technol. 2007, 41, 4240–4245. DOI: 10.1021/es0624523
(29) Cheung, Y. L.; Gray, T. J. B.; Ioannides, C. Mutagenicity of Chrysene, Its Methyl and Benzo Derivatives, and Their Interactions with Cytochromes P-450 and the Ah-receptor; Relevance to Their Carcinogenic Potency. Toxicology 1993, 81, 69–86. DOI: 10.1016/0300-483x(93)90157-n
(30) Hoffmann, D.; Bondinell, W. E.; Wynder, E. L. Carcinogenicity of Methylchrysenes. Science 1974, 183, 215–216. DOI: 10.1126/science.183.4121.215
(31) Mahadevan, B.; Luch, A.; Atkin, J.; Nguyen, T.; Sharma, A. K.; Amin, S.; Baird, W. M. Investigation of the Genotoxicity of Dibenzo[c,p]chrysene in Human Carcinoma MCF-7 Cells in Culture. Chem. Biol. Interact. 2006, 164, 181–191. DOI: 10.1016/j.cbi.2006.09.015
(32) Biswas, S.; Ghosh, B. Chrysene Encyclopedia of Toxicology, 3rd Edition; 2014, 441, 959–962. DOI: 10.1016/B978-0-12-386454-3.00286-4
(33) Tong, C.; Xiang, G.; Bai, Y. Interaction of Paraquat with Calf Thymus DNA: A Terbium(III) Luminescent Probe and Multispectral Study. Agric. Food Chem. 2010, 58, 5257–5262. DOI: 10.1021/jf1000748
(34) Kagemoto, A.; Takagi, H.; Naruse, K.; Baba, Y. Thermodynamic Characterization of Binding of DNA with Cisplatin in Aqueous Solution by Calorimetry. Thermochi. Acta 1991, 190, 191–201. DOI: 10.1016/0040-6031(91)85245-D
(35) Oliveira-Brett, A. M.; Diculescu, V. C. Electrochemical Study of Quercetin–DNA Interactions: Part I. Analysis in Incubated Solutions. Bioelectrochemistry 2004, 64, 133–141. DOI: 10.1016/j.bioelechem.2004.05.003
(36) Chaires, J. B.; Dattagupta, N.; Crothers, D. M. Studies on Interaction of Anthracycline Antibiotics and Deoxyribonucleic Acid: Equilibrium Binding Studies on the Interaction of Daunomycin with Deoxyribonucleic Acid. Biochemistry 1982, 21, 3933–3940. DOI: 10.1021/bi00260a005
(37) Wilson, W. D.; Tanious, F. A.; Watson, R. A.; Barton, H. J.; Strekowska, A.; Harden, D. B.; Strekowski, L. Interaction of Unfused Tricyclic Aromatic Cations with DNA: A New Class of Intercalators. Biochemistry 1989, 28, 1984–1992. DOI: 10.1021/bi00431a005
(38) Xu, X.; Wang, D.; Sun, X.; Zeng, S.; Li, L.; Sun, D. Thermodynamic and Spectrographic Studies on the Interactions of ct-DNA with 5-fluorouracil and Tegafur. Thermochim. Acta 2009, 493, 30–36. DOI: 10.1016/j.tca.2009.03.017
(39) Long, E. C.; Barton, J. K. On Demonstrating DNA Intercalation. Acc. Chem. Res. 1990, 23, 271–273. DOI: 10.1021/ar00177a001
(40) Tselepi-Kalouli, E.; Katsaros, N. The Interaction of [Ru(NH3)5Cl]2+ and [Ru(NH3)6]3+ ions with DNA. J. Inorg. Biochem. 1989, 37, 271–282. DOI: 10.1016/0162-0134(89)85002-0
(41) Waring, M. J. Complex Formation Between Ethidium Bromide and Nucleic Acids. J. Mol. Biol. 1965, 13, 269–282. DOI: 10.1016/S0022-2836(65)80096-1
(42) Neyhart, G. A.; Grover, N.; Smith, S. R.; Kalsbeck, W. A.; Fairley, T. A.; Cory, M.; Thorp, H. H. Binding and Kinetics Studies of Oxidation of DNA by Oxoruthenium(IV). J. Am. Chem. Soc. 1993, 115, 4423–4428. DOI: 10.1021/ja00064a001
(43) Bi, S.; Qiao, C.; Song, D.; Tian, Y.; Gao, D.; Sun, Y.; Zhang, H. Study of Interactions of Flavonoids with DNA Using Acridine Orange as a Fluorescence Probe. Sensor. Actuat. B-Chem. 2006, 119, 199–208. DOI: 10.1016/j.snb.2005.12.014
(44) Zhou, X.; Zhang, G.; Wang, L. Probing the Binding Mode of Psoralen to Calf Thymus DNA. Int. J. Bio. Macromol. 2014, 67, 228–237. DOI: 10.1016/j.ijbiomac.2014.03.038
(45) Yu, X.; Yang, Y.; Lu, R.; Huang, H.; Chen, J.; Ji, D.; Li, X.; Yang, F.; Yi, P. The Investigation of the Interaction Between NCP–EDA and Bovine Serum Albumin by Spectroscopic Approaches. Spectrochim. Acta A 2011, 131, 1510–1514. DOI: 10.1016/j.saa.2011.09.014
(46) Lyng, R.; Härd, T.; Norden, B. Induced CD of DNA Intercalators: Electric Dipole Allowed Transitions. Biopolymers 1987, 26, 1327–1345. DOI: 10.1002/bip.360260809
(47) Lyng, R.; Rodger, A.; Nordén, B. The CD of Ligand-DNA systems. 2. Poly(dA-dT) B-DNA. Biopolymers 1992, 32, 1201–1214. DOI: 10.1002/bip.360320910
(48) Allenmark, S. Induced Circular Dichroism by Chiral Molecular Interaction. Chirality 2003, 15, 409–422. DOI: 10.1002/chir.10220
(49) Kypr, J.; Kejnovska, I.; Renciuk, D.; Vorlickova, M. Circular Dichroism and Conformational Polymorphism of DNA. Nucleic. Acids. Res. 2009, 37, 1713–1725. DOI: 10.1093/nar/gkp026
(50) Mitsopoulou, C. A.; Dagas, C. E.; Makedonas, C. Synthesis, Characterization, DFT Studies and DNA Binding of Mixed Platinum (II) Complexes Containing Quinoxaline and 1,2-Dithiolate Ligands. J. Inorg. Biochem. 2008, 102, 77–86. DOI: 10.1016/j.jinorgbio.2007.07.002
(51) Chen, L. M.; Liu, J.; Chen, J. C.; Shi, S.; Tan, C. P.; Zheng, K. C.; Ji, L. N. Experimental and Theoretical Studies on the DNA-Binding and Spectral Properties of Water-Soluble Complex [Ru(MeIm)4(dpq)]2+. J. Mol. Struct. 2008, 881, 156–166. DOI: 10.1016/j.molstruc.2007.09.010
(52) Kashanian, S.; Shahabadi, N.; Roshanfekr, H.; Shalmashi, K.; Omidfar, K. DNA Binding Studies of PdCl2(LL)(LL = Chelating Diamine Ligand: N,N-Dimethyltrimethylenediamine) Complex. Biochemistry (Mosc) 2008, 73, 929–936. DOI: 10.1134/S0006297908080117
(53) Shahabadi, N.; Kashanian, S.; Darabi, F. DNA Binding and DNA Cleavage Studies of a Water Soluble Cobalt(II) Complex Containing Dinitrogen Schiff Base Ligand: The Effect of Metal on the Mode of Binding. Eur. J. Med. Chem. 2010, 45, 4239–4245. DOI: 10.1016/j.ejmech.2010.06.020
(54) Bordelon, H.; Russ, P. K.; Wright, D. W.; Haselton, F. R. A Magnetic Bead-Based Method for Concentrating DNA from Human Urine for Downstream Detection. Plos One 2013, 8, 368–369. DOI: 10.1371/journal.pone.0068369
(55) Lepecq, J. B.; Paoletti, C. A Fluorescent Complex Between Ethidium Bromide and Nucleic acids: Physical—Chemical Characterization. J. Mol. Biol. 1967, 27, 87–106. DOI: 10.1016/0022-2836(67)90353-1
(56) Sattar, Z.; Iranfar, H.; Asoodeh, A.; Saberi, M. R.; Mazhari, M.; Chamani, J. Interaction Between Holo Transferrin and HSA–PPIX Complex in the Presence of Lomefloxacin: An Evaluation of PPIX Aggregation in Protein–Protein Interactions. Spectrochim. Acta A 2012, 97, 1089–1100. DOI: 10.1016/j.saa.2012.07.034
(57) Kalanur, S. S.; Katrahalli, U.; Seetharamappa, J. Electrochemical Studies and Spectroscopic Investigations on the Interaction of an Anticancer Drug with DNA and their Analytical Applications. J. Electroanal. Chem. 2009, 636, 93–100. DOI: 10.1016/j.jelechem.2009.09.018
(58) U, M.; Ma, Z. R.; Huang, L.; Chen, F. J.; Zeng, Z. Z. Spectroscopic Studies on the Interaction Between Pr(III) Complex of an Ofloxacin Derivative and Bovine Serum Albumin or DNA. Spectrochim. Acta A 2011, 78, 503–511. DOI: 10.1016/j.saa.2010.11.018
(59) Punith, R.; Hegde, A. H.; Jaldappagari, S. Binding of an Anti-inflammatory Drug Lornoxicam with Blood Proteins: Insights from Spectroscopic Investigations. J. Fluoresc. 2011, 21, 487–495. DOI: 10.1007/s10895-010-0735-9
(60) Li, Y. S.; Ge, Y. S.; Zhang, Y.; Zhang, A. Q.; Sun, S. F.; Jiang, F. L.; Liu, Y. Interaction of Coomassie Brilliant Blue G250 with Human Serum Albumin: Probing of the Binding Mechanism and Binding Site by Spectroscopic and Molecular Modeling Methods. J. Mol. Struct. 2010, 968, 24–31. DOI: 10.1016/j.molstruc.2010.01.015
(61) Eftink, M. R. “Fluorescence Quenching: Theory and Applications,” in Topics in Flourescence Spectroscopy; Springer, 1991, pp 53-126. DOI: 10.1007/0-306-47058-6_2
(62) Yang, M. M.; Yang, Q.; Xi, X. L.; Study of the Interaction of Cephalosporin Class Medicine with Albumin by Fluorescence Enhancement and Fluorescence Quenching Theories. Chin. J. Chem. 2006, 24, 642–648. DOI: 10.1002/cjoc.200690123
(63) Ross, P. D.; Subramanian, S. Thermodynamics of Protein Association Reactions: Forces Contributing to Stability. Biochemistry 1981, 20 (11), 3096–3102. DOI: 10.1021/bi00514a017
Jianan Lv, Junsheng Li*, Guoxia Huang, Liujuan Yan, and Ji Ma Guangxi Key Laboratory of Green Processing of Sugar Resources, Guangxi University of Science and Technology, Donghuan Road 268, Liuzhou 545006, Guangxi, P. R. China. *Correspondence should be addressed to Junsheng Li: junshenglee63@aliyun.com ●


Measurement of Ammonia Leakage by TDLAS in Mid-Infrared Combined with an EMD-SG Filter Method
April 9th 2024In this article, tunable diode laser absorption spectroscopy (TDLAS) is used to measure ammonia leakage, where a new denoising method combining empirical mode decomposition with the Savitzky-Golay smoothing algorithm (EMD-SG) is proposed to improve the signal-to-noise ratio (SNR) of absorbance signals.


