Monitoring the Drying Process of Pressure-Sensitive Adhesives
Application Notebook
The drying of a pressure-sensitive polymer adhesive was monitored by attenuated total internal reflection (ATR) IR spectroscopy. Correlational analysis revealed changes in the composition of the film surface with time.
The drying of a pressure-sensitive polymer adhesive was monitored by attenuated total internal reflection (ATR) IR spectroscopy. Correlational analysis revealed changes in the composition of the film surface with time.
On a fundamental level, adhesion is the interaction between the surface of one material and that of another (1). The formulation of new adhesives, the optimization of current compounds, and the trouble-shooting of manufacturing processes are greatly assisted by a characterization of the surface structure of the materials. This is particularly critical for pressure-sensitive adhesives (2) where no solvent or heat is applied during the bonding process.
Experimental Conditions
A 10-reflection ATR accessory named the HATR (PIKE Technologies) was used to analyze adhesive reactions (Figure 1). A butyl-acrylate-based adhesive containing acrylic acid was placed on a 4-mm, 45° incidence Ge ATR crystal. Spectra were collected at 4 cm-1 resolution with 200 co-additions, every hour for 12 h. The temperature was controlled to 21±0.5 °C, and the humidity set at 45±1%. Data acquisition and analyses were performed using custom lab-written software.

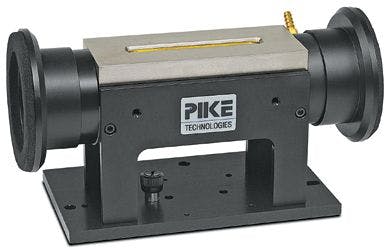

Figure 1: PIKE Technologies HATR accessory.
Results
Post-acquisition, spectra were analyzed using a two-dimensional correlation routine (3). Figure 2 shows results of the synchronous correlation maps, where the intensity of the diagonal peaks indicate the degree to which bands changed during the drying process.

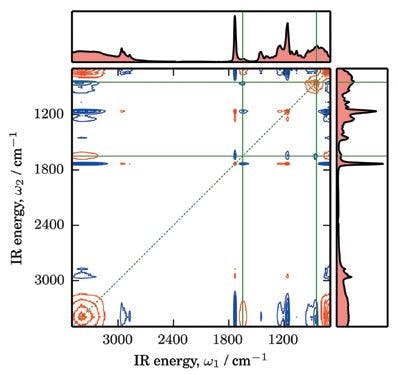
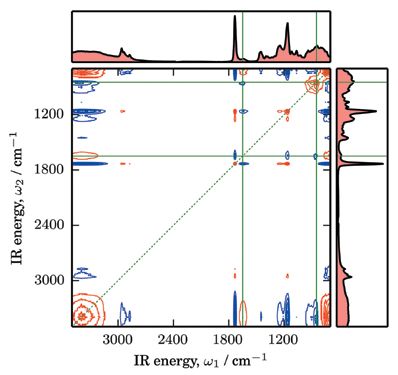
Figure 2: Synchronous correlation spectra of butyl acrylate pressure sensitive adhesive. Red cross peaks are positive; blue peaks are negative.
The bands corresponding to water (686, 1645 and 3300 cm-1) are all decreasing in intensity, and this is related to a subsequent overall increase in the strength of the polymer modes (1160, 1250, 1450, 1730, 2870, and 2935 cm-1). This is indicative of an increase in the polymer density within the penetration depth due to the loss of water. Cross peaks in Figure 2 indicate a synchronous change in intensity between bands; if the bands are both growing or shrinking during the drying process, the peaks are positive (red), if they evolve in opposite directions, they are negative (blue). For example, the negative cross peak at (850, 1650) indicates that the acrylic acid 850 cm-1 band is growing while the 1650 cm-1 monomer signal decays. This is evidence that the acrylic acid monomer is diffusing to the surface as the sample is drying, possibility concomitant with polymerization of some of the acrylic acid.
Conclusions
The HATR accessory is a valuable tool for studying changes in adhesive composition during the drying process. When time-resolved spectra are combined with correlation analysis, multiple components may be readily identified and trends in structural evolution observed.
References
(1) R. Blomquist, "Adhesives: Past, Present, and Future," Am. Soc. Testing and Mater., 1964.
(2) I. Benedek, Pressure-Sensitive Adhesives and Applications, 2nd ed. (Marcel Dekker, Inc., New York, New York, 2004).
(3) I. Noda and Y. Ozaki, Two-Dimensional Correlation Spectroscopy: Applicantions in Vibrational and Optical Spectroscopy (John Wiley & Sons Ltd., San Francisco, California, 2004).
PIKE Technologies, Inc.
6125 Cottonwood Drive, Madison, WI 53719
tel. (608) 274-2721
Website: www.piketech.com


Getting accurate IR spectra on monolayer of molecules
April 18th 2024Creating uniform and repeatable monolayers is incredibly important for both scientific pursuits as well as the manufacturing of products in semiconductor, biotechnology, and. other industries. However, measuring monolayers and functionalized surfaces directly is. difficult, and many rely on a variety of characterization techniques that when used together can provide some degree of confidence. By combining non-contact atomic force microscopy (AFM) and IR spectroscopy, IR PiFM provides sensitive and accurate analysis of sub-monolayer of molecules without the concern of tip-sample cross contamination. Dr. Sung Park, Molecular Vista, joined Spectroscopy to provide insights on how IR PiFM can acquire IR signature of monolayer films due to its unique implementation.


Deep Level Transient Spectroscopy Reveals Influence of Defects on 2D Semiconductor Devices
April 25th 2024A recent study used deep level transient spectroscopy to investigate the electrical response of defect filling and emission in monolayer metal-organic chemical vapor deposition (MOCVD)-grown materials deposited on complementary metal-oxide-semiconductor (CMOS)-compatible substrates.

