Prediction of the Harvest Time of Cabernet Sauvignon Grapes Using Near-Infrared Spectroscopy
Harvest time assessment during the grape-ripening process can provide meaningful information for vineyard harvest scheduling. The purpose of this study was to investigate the identification of the harvest time of grape clusters using near-infrared (NIR) spectroscopy. During the harvest season from September to October 2019, bunches of Cabernet Sauvignon grapes were examined. Before establishing two classification models, namely partial least-squares discriminant analysis (PLS-DA) and support vector machine (SVM) models, raw spectra were processed by different pre-processing methods, including multiplicative signal correction (MSC), mean-centering, the standard normal variable (SNV), and the Savitzky-Golay method. Competitive adaptive weighted sampling (CARS) and the successive projections algorithm (SPA) were employed to select the optimal wavenumbers. The results indicate that NIR spectroscopy is a potentially promising approach for the rapid identification of different harvest times of Cabernet Sauvignon grapes, and the proposed technique is helpful for the prediction of ripened and over-ripened Cabernet Sauvignon grapes during the harvest time.
Cabernet Sauvignon grapes are the most widely planted wine grapes worldwide. They are a high quality wine grape variety, with strong adaptability, vigorous growth, and strong aging potential (1). The ideal harvest time of grapes is the key to obtaining high quality wines; as the saying in the wine industry goes, “seven points for raw materials and three points for fermented,“ highlighting the importance of the grape harvest. The grape composition at harvest plays an important role in the future wine quality, and it is necessary for winemakers to carefully control the grape quality parameters during grape ripening, especially in the late stage and harvest period (2).
As a rule of thumb, grapes picked too early cannot reach a mature state, resulting in insufficient taste and aroma development; the taste of wine fermented at this stage is often green and astringent. The longer the grapes mature on the vine, the better the taste, but wine made with overripe grapes will have an overripe taste. Therefore, a suitable grape harvest period can ensure the production of high quality wine.
For generations, the determination of the grape harvest period has been primarily based on time and experience, and the fruit is monitored close to the presumed harvest date via various ripening parameters—for example, the soluble solids content (SSC), total acid content, and total phenol content (3). Growers decide when to pick grapes primarily by sensory evaluation based on experience. Because human judgment is always subjective, artificial experience cannot provide completely suitable identification of the harvest time of Cabernet Sauvignon grapes. Particularly, in the case of a large sample size, taste and visual fatigue are prone to occur, and the accuracy of assessment is relatively low. Moreover, while Cabernet Sauvignon grapes can be evaluated via destructive methods, they are characterized by several disadvantages. Via these techniques, analysis is performed on only a few samples that are often not completely representative of the variability within the fruit lots. Additionally, when destructive analysis techniques are adopted, it is not possible to monitor the physiological changes of the same samples over the entire ripening period. It is therefore necessary to utilize a rapid, reliable, and non-destructive analytical tool to determine the harvest time of Cabernet Sauvignon grapes to ultimately improve the competitiveness of the grape-growing industry.
Compared with traditional physical and chemical methods, spectroscopy provides a faster, more convenient, and more accurate non-destructive analysis method for the determinant of fruit harvest times. Near-infrared spectroscopy (NIR) technology has been widely applied in food evaluation in recent years (4,5). There are many newly published studies that have investigated the potential ability of NIR to predict the internal quality characteristics, such as the SSC, pH, and total phenol content, of various fruits such as pears, strawberries, and apples (6–8). Additionally, some researchers have attempted to apply NIR as a non-destructive method for the qualitative analysis of fruits, and the majority of this research is concentrated on the prediction of several varieties (9,10) and several geographical origins (11,12).
However, NIR results always include substantial information produced from sample characteristics, as well as environmental and instrumental effects. Therefore, it is necessary to construct a robust model using selected information variables to improve both the modeling efficiency and prediction accuracy. Moreover, variable selection can simplify the model, yield better explanations, and reduce the cost of the measurement system. Many variable selection methods have been exploited to achieve these goals—among them, competitive adaptive weighted sampling (CARS) is a commonly used method (13). Variable selection is also applied to improve the performance of models established by genetic algorithms (GA) (14). The successive projections algorithm (SPA) has also been identified as an important method for the enhancement of model performance (15).
Although the application of NIR in the evaluation of fruit quality is increasing, little research has sought to analyze the harvest time of Cabernet Sauvignon grapes by NIR. In particular, there have been few studies on the identification of Cabernet Sauvignon grapes at different harvest stages via the combination of NIR and wavenumbers screening.
The present work aims to investigate the use of NIR for the harvest time discrimination of Cabernet Sauvignon grapes. With the aim of harvest time discrimination, a partial least-squares discriminant analysis (PLS-DA) model and a support vector machine (SVM) model were established in combination with CARS and the SPA for use on NIR spectral data.
Materials and Methods
Grape Samples
Cabernet Sauvignon grapes had been collected from a vineyard located in Shihezi City, Xinjiang Uygur Autonomous Region in China; the harvest was performed through five different stages. The first harvest time was started at September 16, 2019; three samplings were performed on September 23, September 30, and October 7, and the fifth harvest was performed on October 14 after the grape ripening. Sampling intervals were weekly. Each time, forty bunches were randomly collected from different vines. The bunches were stored in a cooler filled with ice to keep the berries fresh until transport to the laboratory. Cabernet Sauvignon grapes were separated of the bunches with scissor, and each 10 grapes were individually into a group, which was regarded as representing the whole bunch of grapes. In addition, 200 bunches of grapes from the five harvest periods were divided into two subgroups; 150 samples were allocated in the calibration set and 50 samples were allocated in the validation set. Grape fruits should be kept to equilibrate to room temperature (25 °C) before spectral analysis.
Instruments and Analysis
Spectral acquisitions of Cabernet Sauvignon grapes were performed by a TANGO-RFT-NIR spectrometer (Bruker Optics) in a reflectance mode at room temperature, with a resolution of 8 cm−1 and a wavenumbers range of 12,500 to 4000 cm-1. Cabernet Sauvignon grape was placed the in the sample cup of the spectrometer with a diameter of 3 cm. In the process of collecting the sample spectra, it was necessary to scan the air background regularly. Each sample (10 berries) was measured in triplicate, and the average spectra of three spectra were processed. The sample cup was cleaned with distilled water and dried with cleaning tissue paper between measurements. The operation of the spectrometer and the acquisition of the initial spectra were carried out with OPUS software (OPUS v. 7.0 for Microsoft, Bruker Optics).
Data Analysis
NIR spectroscopy data usually contains a lot of information. However, the data acquired from spectrometers include background information and noise besides sample information. It is necessary to preprocess spectral data for establishing accurate and stable calibration models. Before establishing the models, raw spectra were pretreated by multiplicative signal correction (MSC) (16), mean centering, standard normal variable (SNV) (17), and Savitzky-Golay first derivative (18) to improve spectral quality. Furthermore, the number of spectra data used for the establishment of the qualitative models was very large. Due to this, to get models with a smaller number of input wavenumber variables, characteristic variable selection was performed by CARS and SPA to reduce invalid spectral information and speed up model calculation. Cabernet Sauvignon grapes were separated into calibration and prediction sets at a fixed ratio of 3:1 at each harvest time. Finally, the best supervised discriminant models were carried out with the selected variables applying PLS-DA and SVM for discriminating the harvest timing of Cabernet Sauvignon grapes. The procedure of these spectral preprocessing methods are performed in the Matlab2019a with spectral preprocessing methods toolbox available at http://www.libpls.net.
Characteristic Variable Selection
In this study, CARS, SPA and their synergic methods were used to select effective wavenumbers for building reliable identification models of noise reduction spectra, realizing the rapid and accurate discriminating of harvest timing of Cabernet Sauvignon grape. The effects of CARS and SPA methods on dimensional reduction of spectral data were compared in the preliminary screening process. In the second screening, synergic method of CARS and SPA were compared.
CARS algorithm evaluates the contribution of each wavenumbers variable in the models according to the absolute values of regression coefficients of partial least square model. CARS is used to select a subset of N variables by implementation of N sampling runs iteratively (19). Monte Carlo resampling uses an iterative and competitive way to select a certain number of variables subsets from a fixed proportion of sample sequences (20). In each resampling, this method is used to select sensitive spectral variables with larger absolute regression coefficients in the calibration model, and the number of selected variables is determined by the exponential decreasing function. Finally, the subset with the lowest root mean square error of cross validation (RMSECV) is chosen (21). More details on the steps involved in CARS application can be found in previous studies (22).
Successive projections algorithm (SPA) is a new wavenumbers variable selection method for multivariate calibration. This technique is a forward selection algorithm aimed to decrease the total number of wavenumber variables used for establishing models. In the SPA algorithm, candidate subsets of variables with minimum colinearity are generated and evaluated by the value of root mean square error obtained from validation set of MLR calibration, and the uninformative variables are then removed by a variable elimination procedure without significant loss of prediction capability (23). More details on the steps involved in SPA application can be found in previous studies (24). The procedure of SPA and CARS are performed in the Matlab2019a with related toolbox available at http://www.libpls.net.
The technique is a forward variable selection method with the aim of reducing the number of wavenumber variables used in modeling, reducing the linear relationship by calculating the projections of other variables, and enhancing the performance of multiple linear regression by minimizing the collinearity in the calibration set (25). The above characteristic wavenumbers optimization method can remove the system noise in the spectral acquisition process and screen out the key information in the spectral region, improving the predictive ability of modeling (26). For the CARS algorithm, Monte Carlo sampling number were set to 50. The parameters of SPA were set as follows: The number of initial population, window width, mutation rate, and genetic iterations were 64, 5, 0.05, and 100, respectively. In the case of SPA, the range of variables selection was set as 1–50.
PLS-DA
Partial least squares discrimination analysis (PLS-DA) is a simple and stable linear classification method in multivariate analysis combining the characteristics of partial least squares regression and the discriminant ability of classification technology. In fact, the PLS-DA model and the PLS regression model are implemented using the same principle. In short, the PLS-DA model is a classification problem transformed from one of regression, using classification variables to replace concentration variables. PLS-DA decomposes the spectral matrix and category matrix at the same time, strengthening the effect of category information in spectral decomposition and making the extracted spectral information most relevant to the category. PLS-DA accomplishes a rotation of the projection to latent variables focusing on class separation. A matrix of artificial variables, assuming a discrete numerical value (zero or one), was used as y data. The y dummy matrix is constructed to ensure that the value of the objects belonging to the class corresponds to one, and the value of all other objects corresponds to zero (27). All the classification rules were evaluated using a cross-validation leave-more-out procedure using five cancellation groups (28), and the PLS-DA cutoff value for samples discrimination was fixed at 0.5. More specific information about the algorithm can be found in the provided reference (29). The procedure of PLS-DA is performed in the Matlab2019a with libPLS toolbox available at http://www.libpls.net.
SVM
Support vector machine (SVM) is a new nonlinear method proposed in accordance with the idea of structural risk minimization, and has been widely used in qualitative discrimination and regression analysis (30). The basic principle of SVM classification is to establish decision boundaries in feature space to separate data belonging to different categories. The main advantage of SVM algorithm is to use kernel function to solve the qualitative discrimination problem, which not only can reduce the complexity of the model, but also minimize the prediction error of the model. Generally, there are three classical kernel functions: polynomial kernel function, radial basis function (RBF) kernel function, and sigmoid kernel function. Among these three functions, the structure of RBF kernel function is the simplest and fastest computation. Therefore, only RBF kernel function was attempted in this work. More specific information about the SVM algorithm can be found in the provided reference (31). The procedure of SVM is performed in the Matlab2019a with SVM toolbox available at https://www.csdn.net.
Results and Discussion
Spectral Analysis
Figure 1 presents the average measured raw absorbance spectra and preprocessed absorbance spectra of the grapes from the five harvest dates of September 16, September 23, September 30, October 7, and October 14, 2019. The raw spectra obtained from the Cabernet Sauvignon grapes include characteristic information. The stretching and bending vibrations of functional groups, such as C-H, O-H, and N-H, are related to the growth stage of grapes and affect the NIR spectral trend. The chemical ingredients and contents of grapes at different stages can influence the absorption intensity and sites of different groups. These functional groups are the basis of the composition of Cabernet Sauvignon, and are essential for the identification of the harvest period. As exhibited in Figure 1a, the Cabernet Sauvignon grapes from different harvest times had similar trends, but slightly different reflectance.

 Original average spectra of Cabernet Sauvignon grape samples (b) Reflectance spectra of Cabernet Sauvignon grape at five different harvest periods obtained after Savitzky-Golay first derivative.")
FIGURE 1: (a) Original average spectra of Cabernet Sauvignon grape samples (b) Reflectance spectra of Cabernet Sauvignon grape at five different harvest periods obtained after Savitzky-Golay first derivative.

The wavenumbers at 10,800 and 10,200 cm-1 may be associated with the OH groups in carbohydrates and water (32). The maximum absorption at 8340 cm-1 was related to the second overtone of the C-H stretch. Another peak at 5200 cm-1 was due to the combination of C-O deformation and the first overtone of OH stretching (33). Local maxima were observed around 9300, 7880, and 7150 cm-1. Additionally, the O-H functional groups in the water of Cabernet Sauvignon grapes produced absorption peaks at 9300 and 7150 cm-1. The Savitzky-Golay first-derivative method was used to eliminate the effects of baseline drift and scattering in the sample information for further spectral analysis (Figure 1b).
Full Spectra with PLS-DA and SVM
After using the previously cited pretreatment approaches, discriminant analysis models were established by applying the PLS-DA and SVM models for the identification of the harvest time of Cabernet Sauvignon grapes.
Table I reports the prediction results of the PLS-DA and SVM models for the analyzed harvest period after applying different pretreatment methods. For the PLS-DA models, the best pretreatment was achieved via the use of the Savitzky-Golay first-derivative method, which yielded 90% accuracy on the prediction set and 100% on the calibration set. For the SVM models, the application of the Savitzky-Golay first-derivative method also achieved the best pretreatment method, and yielded 100% accuracy on the prediction set and 100% on the calibration set. In recent research, via the use of pretreatment methods, Shao and associates (11) obtained similar results for distinguishing different types of Chinese quince fruit, and specifically achieved 98% accuracy on the prediction set.

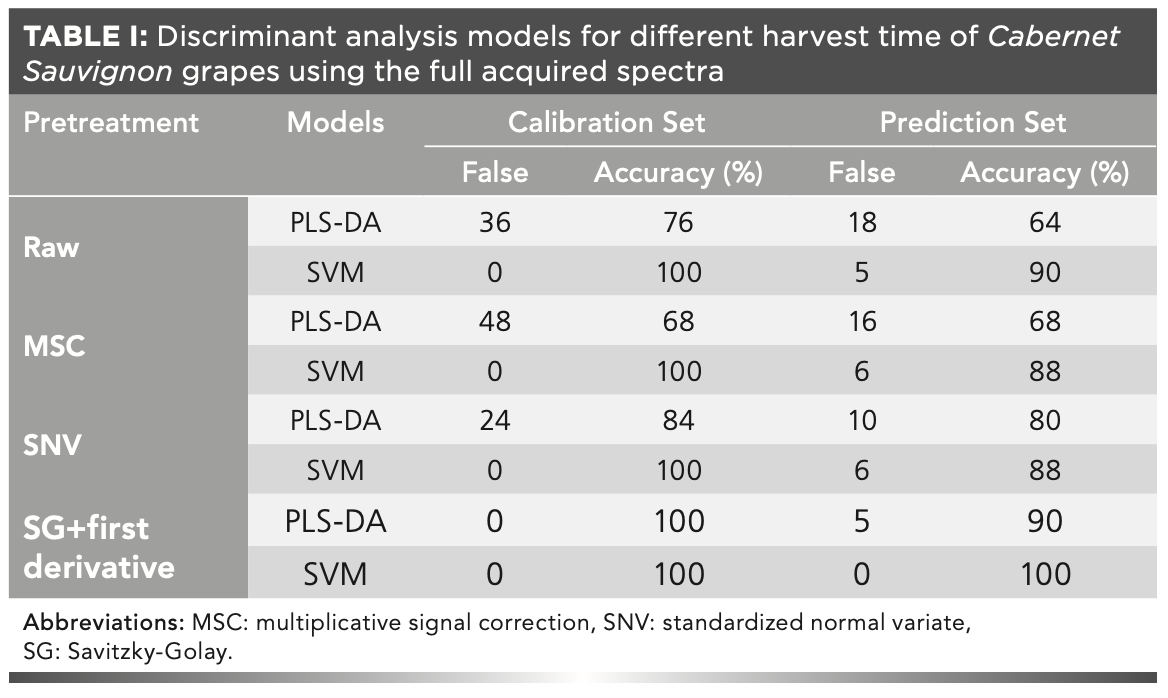

It is therefore evident that more satisfactory results can be obtained based on some suitable pretreat methods. The established predictive models that employ the pretreatment of the Savitzky-Golay first-derivative method exhibit sufficient robustness and precision for monitoring the harvest time of Cabernet Sauvignon grapes.
Effective Wavenumber Selection
The effects of different wavenumber variables on the establishment of the models were not considered in the previous discussion. Because key variables have more powerful impacts on predictive models, variable selection methods were applied via the CARS and SPA approaches to determine the harvest time of Cabernet Sauvignon grapes. The models were again reconstructed with the PLS-DA and SVM algorithms, and the results are reported in Table II.

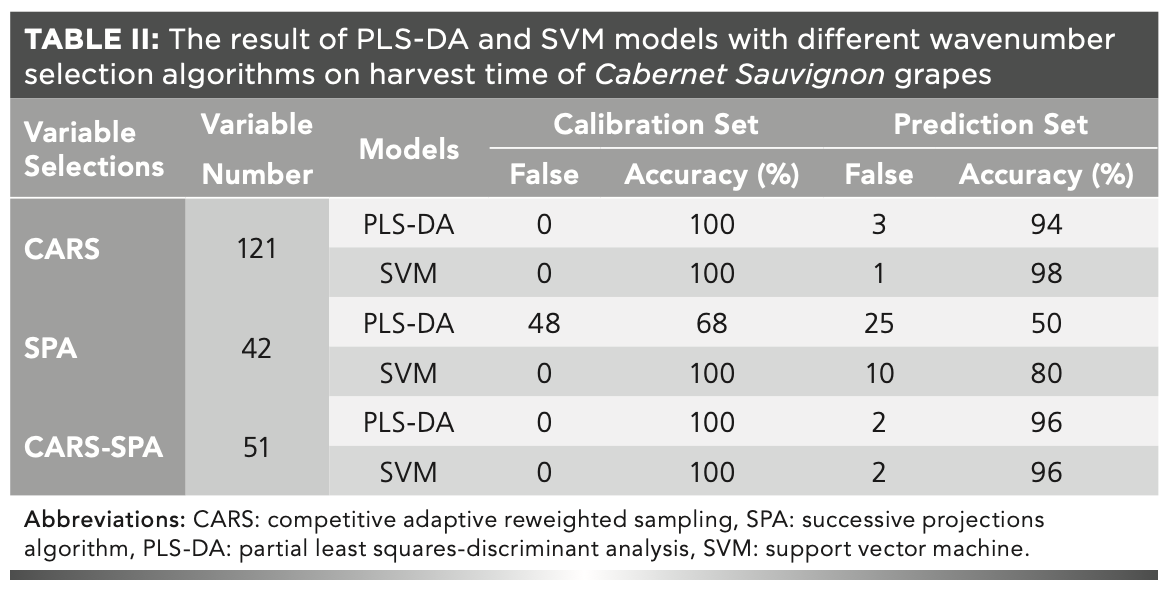

The CARS and SPA approaches achieved the efficient dimensionality reduction of the spectral wavenumbers in the initial screening, and the numbers of selected variables were 121 and 42, respectively.
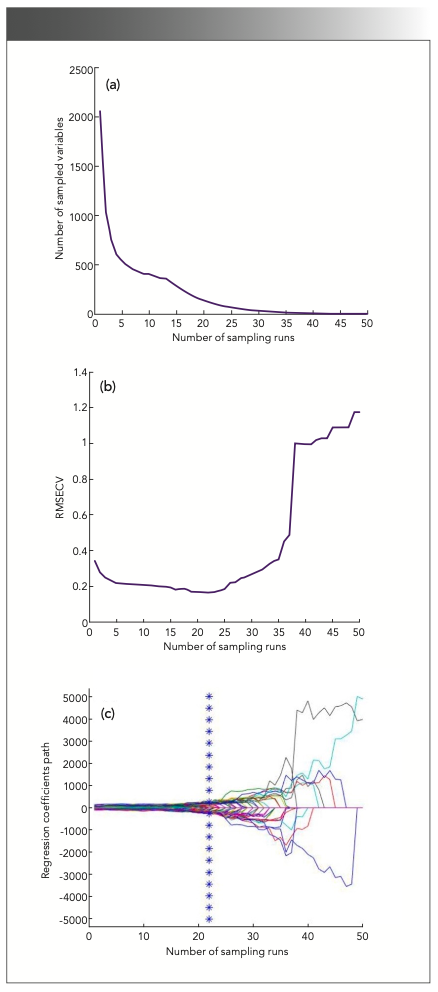
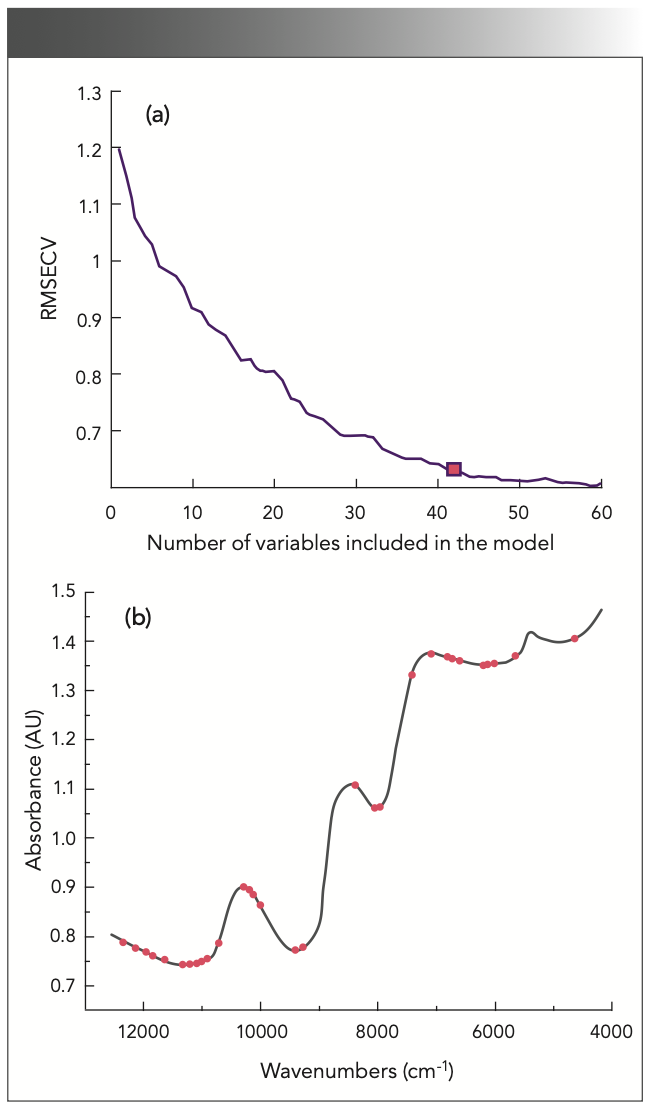
Figure 2 presents the change of the number of variables selected, the root-mean-square error of cross-validation (RMSECV) values, and the regression coefficient path with the increase of the number of sampling run. It is evident that the number of selected variables decreased quickly and then slowed; these results were similar to those of a previous study, which revealed a process of fast selection followed by refined selection by CARS (34). The change trend of the RMSECV values was found to be consistent with that of the selected wavenumber variables, which can be attributed to the elimination of unnecessary wavenumbers, and then increased with the loss of information due to the removal of some key variables in the suitable subset. Figure 2c records the regression coefficient path of each wavenumber at different sampling. The best subset with the lowest RMSECV value is indicated by the vertical line denoted by an asterisk, and the number of selected wavenumbers was 121. Figure 3a presents the root-mean-square error (RMSE) distribution curve plot acquired by applying the SPA. It can be seen that the root-mean-square error of validation (RMSEV) value decreased sharply as the number of wavenumbers increased from 1 to 42, because at least 42 variables were required to resolve the spectral overlap characteristics of the sample. After that, the RMSEV value continued to decrease, but as the number of variables further increased, the improvement was very small, and the curve became stable. Figure 3b presents the distribution of 51 wavenumber variables selected by CARS combined with the SPA in the wavenumber range of 12,500-4000 cm-1, from which it can be seen that the variables were mainly distributed in the range of 12,500-12,000 cm-1.

 The changing trend of the number of sampled variables with the increase of sampling runs, (b) root-mean-square error of cross-validation values with the increasing of sampling runs, and (c) regression coefficients path by competitive adaptive reweighted sampling for harvest periods of Cabernet Sauvignon. Abbreviations: RMSECV, root-mean-square error of cross-validation.")
FIGURE 2: (a) The changing trend of the number of sampled variables with the increase of sampling runs, (b) root-mean-square error of cross-validation values with the increasing of sampling runs, and (c) regression coefficients path by competitive adaptive reweighted sampling for harvest periods of Cabernet Sauvignon. Abbreviations: RMSECV, root-mean-square error of cross-validation.

 RMSECV plot and (b) distribution of variables selected by SPA for harvest periods of Cabernet Sauvignon grapes. Abbreviations: RMSECV, root-mean-square error of cross-validation. SPA, successive projections algorithm.")
FIGURE 3: (a) RMSECV plot and (b) distribution of variables selected by SPA for harvest periods of Cabernet Sauvignon grapes. Abbreviations: RMSECV, root-mean-square error of cross-validation. SPA, successive projections algorithm.
Results and Discussion of Different Identification Models
Based on the characteristic wavenumbers regions selected by the CARS and SPA methods, the PLS-DA and SVM models were respectively used to construct corresponding calibration and prediction models. For comparison, models were established over the whole spectra to predict the harvest time of Cabernet Sauvignon grapes. Table II reports the calibration and validation predictive results of models using different discrimination algorithms and wavenumber variable selection methods. The reconstructed models and their corresponding best mathematical pretreated methods were the same as those achieved using the whole spectra (Table I). In general, the simplicity and precision of the models were improved. This fact is evident by comparing the accuracies of the prediction and calibration sets of both the PLS-DA and SVM models using the whole spectra and those obtained via the use of the wavenumber variable selection methods. Hu and coauthors (35) demonstrated a similar situation, which proved that informative variable wavenumbers can be selected for the establishment of high-accuracy models. It can be clearly seen from Table II that the chemometrics results of the classification models using the CARS algorithm were better than those of the full-spectrum models, indicating that the CARS method can effectively select important variables. Fan and associates (36) also used the CARS characteristic wavenumber screening method to establish a prediction model of the total acid content in vinegar, which achieved good prediction performance. The SPA selects the least number of wavenumbers, and the performance of the model established based on the wavenumber variables selected by the SPA was worse than that of the model established by the original spectra. The reason for this phenomenon may be that the SPA may have deleted some useful wavenumber variables from the entire spectrum, so its performance was not as good as that of the CARS method. This was confirmed by Wu and coauthors (37), who noticed that some wavenumber variables had little or no effect on the models and did not use them in model development, leading to a reduction in the amount of feature information. Moreover, a variable selection process was implemented in another study (38), and it was found that the performance of the model declined, possibly because the selection algorithm was applied to the spectral range with a low signal-to-noise ratio. The wavenumber variables selected by the CARS and SPA methods respectively accounted for 5.9% and 2% of the whole spectral variables. Although the performance of the models based on the wavenumber variables selected by the CARS method was better than that of the models based on the wavenumber variables selected by the SPA, the number of wavenumber variables selected by the CARS method was more than two times that selected by the SPA. To establish a model with fewer selected wavenumber variables and better performance, the number of wavenumber variables screened by CARS was screened again by the SPA. Finally, the number of wavenumber variables screened by CARS-SPA was 52, accounting for 2.5% of the total wavenumbers. From the perspective of constructing the models using the same wavenumber variable selection method, the identification models with CARS-SPA-PLS-DA and CARS-SPA-SVM respectively achieved better performance during calibration and verification. Although the CARS-SVM model achieved the best identification rate, the number of variables selected by the CARS-SPA method was less than one-half that selected by CARS, and the discrimination of the models based on CARS-SPA and CARS were not significantly different. A similar result was achieved by Qiu and associates (34), who predicted the total volatile basic nitrogen content with models developed using a combination of wavenumber variable selection methods. Furthermore, the models based on a combination of wavenumber variable selection approaches had better performance than those based on single approaches. Therefore, it is extremely important to select an appropriate feature wavenumber extraction method to improve the performance of the model. Moreover, the SVM models based on all three characteristic variable selection approaches (CARS, SPA, and CARS-SPA) exhibited satisfactory prediction results with an average identification rate of over 90%, and the classification precision of the prediction models for which variables were selected by CARS, SPA, and CARS-SPA were 97%, 80%, and 96%, respectively. The PLS-DA models that applied these methods achieved relatively poor prediction results, the corresponding performance indicator had an average identification rate of 80% on the calibration set and prediction set, and the classification precision of the prediction models for which variables were selected by CARS, SPA and CARS-SPA were 94%, 50%, and 96%, respectively.
By comparison, the models combined with SVM performed better than those combined with PLS-DA. The reason for this phenomenon is the small amount of linear information in the spectral data or the small sample size used in this study. Nonlinear models may have more advantages in dealing with some potentially nonlinear information, which is consistent with the findings of another study (39). The combination of the SVM qualitative identification algorithm with CARS-SPA achieved the best comprehensive identification performance; the identification rates on the calibration set and prediction set reached 100% and 96%, respectively, and two predicted samples were merely misidentified in the prediction set. These results outperformed those reported by González-Caballero and coauthors (40), who employed NIR spectroscopy (1600–2400 nm) associated with PLS-DA as a classification method to distinguish the ripening stages of Cabernet Sauvignon grape bunches and achieved 88% accuracy, thereby allowing selective harvest for the production of young, vintage, and soft red wines. Furthermore, similar results were achieved by Fernández-Novales and associates (41), who used NIR spectroscopy (700–1060 nm) and PLS-DA to differentiate red and white grapes, for which respective accuracy rates of 91.3% and 100% were achieved. The identification results of sample prediction based on the CARS-SPA-SVM model are presented in Figure 4.


FIGURE 4: The best results for discriminant analysis of har- vest timing of Cabernet Sauvignon grapes in the prediction set by SG+1D-CARS-SPA-SVM model. Abbreviations: SG+1D, Savitzky-Golay first derivative. CARS, competitive adaptive reweighted sampling. SPA, successive projections algorithm. SVM: support vector machine.

From the identification results, it can be seen that two samples from the second harvest time were misjudged as samples from the fourth harvest time. Although identifying different harvest times of Cabernet Sauvignon grapes is a complicated process that includes changes in various physical and chemical indicators within the grapes, the satisfactory prediction performance effectively supports the superiority of the algorithms. Overall, the obtained results suggest that the combination of NIR with a wavenumber variable selection method is promising and useful for the non-destructive evaluation of harvest times in one bunch of Cabernet Sauvignon grapes during on-vine ripening. Further research should be carried out on other grape varieties (both red and white) to perfect and support the developed approaches and to construct models for individual or global grape varieties.
Conclusions
By applying the effective wavenumber variables selected by CARS and SPA, relatively good results were achieved in the discrimination of the harvest time of Cabernet Sauvignon grapes based on SVM, and the accuracy rate of harvest period discrimination reached 96% on the prediction set. Thi s research provided an appropriate approach for grape farmers to discriminate the harvest time of each bunch of Cabernet Sauvignon grapes. Finally, the results achieved in this research may be applicable to only a specific region, and it is therefore necessary to further analyze the robustness of the developed model in different regions.
Disclosure Statement
The authors report there are no conflicts of interest.
Acknowledgments
This study was supported by the Special Support Program for High-Level Personnel Recruitment of Shihezi University (Grant No. RCSX2018B04) and the National Natural Science Foundation of China (Grant No.61763043).
References
(1) Bowers, J. E.; Meredith, C. P. The Parentage of a Classic Wine Grape, Cabernet Sauvignon. Nat. Genet. 1997, 16 (1), 84–87. DOI: 10.1038/ng0597-84
(2) Du Plessis, C. S. Optimum Maturity and Quality Parameters in Grapes: A Review. S. Afr. J. Enol. Vitic. 1984, 5 (1), 35–40. DOI: 10.21548/5-1-2367
(3) Coombe, B. G. Distribution of Solutes within the Developing Grape Berry in Relation to Its Morphology. Am. J. Enol. Viticult. 1987, 38 (2), 120–127. DOI: 10.5344/ajev.1987.38.2.120
(4) Arslan, M., Xiaobo, Z., Tahir, H.E. et al. Near-Infrared Spectroscopy Coupled Chemometric Algorithms for Prediction of Antioxidant Activity of Black Goji Berries (Lycium ruthenicum Murr.). Food Measure 2018, 12, 2366–2376. DOI: 10.1007/s11694-018-9853-x
(5) Chapanya, P.; Ritthiruangdej, P.; Mueangmontri, R.; Anutin, P.; Wirat, V. S Temperature Compensation on Sugar Content Prediction of Molasses by Near-Infrared Spectroscopy (NIR). Sugar Tech. 2019, 21 (1), 162–169. DOI: 10.1007/s12355-018-0635-x
(6) Liu, X.; Wu, X.; Li, G. Optimized Prediction of Sugar Content in ‘Snow’ Pear Using Near-Infrared Diffuse Reflectance Spectroscopy Combined with Chemometrics. Spectrosc. Lett. 2019, 52 (7), 376–388, DOI: 10.1080/00387010.2019.1648297
(7) Yazici, A.; Tiryaki, G. Y.; Ayvaz, H. Determination of Pesticide Residual Levels in Strawberry (Fragaria) by Near-Infrared Spectroscopy. J. Sci. Food Agr. 2020, 100 (5), 1980–1989. DOI: 10.1002/jsfa.10211
(8) Zhang, Y.; Nock, J. F.; Shoffe, Y. A. Non-Destructive Prediction of Soluble Solids and Dry Matter Contents in Eight Apple Cultivars Using Near-Infrared Spectroscopy. Postharvest Biol Tec. 2019, 151, 111–118. DOI: 10.1016/j.postharvbio.2019.01.009
(9) Xiao, H.; Li, A.; Li, M.; Sun, Y.; Tu, K.; Wang, S.; Pan, L. Quality Assessment and Discrimination of Intact White and Red Grapes from Vitis vinifera L. at Five Ripening Stages by Visible and Near-Infrared Spectroscopy. Sci. Hortic-Amsterdam 2018, 233, 99–107. DOI: 10.1016/j.scienta.2018.01.041
(10) Suphamitmongkol, W.; Nie, G.; Liu, R.; Kasemsumran, S.; Shi, Y. An Alternative Approach for the Classification of Orange Varieties Based on Near Infrared Spectroscopy. Electron. Agr. 2013, 91, 87–93. DOI: 10.1016/j.compag.2012.11.014
(11) Shao, W.; Li, Y.; Diao, S.; Jiang, J.; Dong, R. Rapid Classification of Chinese Quince (Chaenomeles speciosa Nakai) Fruit Provenance by Near-Infrared Spectroscopy and Multivariate Calibration. Anal. Bioanal. Chem. 2017, 409 (1), 115–120. DOI: 10.1007/s00216-016-9944-7
(12) Eisenstecken, D.; Stürz, B.; Robatscher, P.; Lozano, L.; Zanella, A.; Oberhuber, M. The Potential of Near Infrared Spectroscopy (NIRS) to Trace Apple Origin: Study on Different Cultivars and Orchard Elevations. Postharvest Biol. Tec. 2019, 147, 123–131. DOI: 10.1016/j.postharvbio.2018.08.019
(13) Deng, B. C.; Yun, Y. H.; Liang, Y. Z.; Yi, L. Z. A Novel Variable Selection Approach That Iteratively Optimizes Variable Space Using Weighted Binary Matrix Sampling. Analyst 2014, 139 (19), 4836–4845. DOI: 10.1039/c4an00730a
(14) Leardi, R.; Seasholtz, M. B.; Pell, R. J. Variable Selection for Multivariate Calibration Using a Genetic Algorithm: Prediction of Additive Concentrations in Polymer Films from Fourier Transform-Infrared Spectral Data. Anal. Chim. Acta 2002, 461 (2), 189–200. DOI: 10.1016/S0003-2670(02)00272-6
(15) Liu, F.; He, Y. Application of Successive Projections Algorithm for Variable Selection to Determine Organic Acids of Plum Vinegar. Food Chem. 2009, 115 (4), 1430–1436. DOI: 10.1016/j.foodchem.2009.01.073
(16) Helland, I. S.; Naes, T.; Isaksson, T. Related Versions of the Multiplicative Scatter Correction Method for Preprocessing Spectroscopic Data. Chemom Intell Lab Syst. 1995, 29 (2), 233–241. DOI: 10.1016/0169-7439(95)80098-T
(17) Barnes, R. J.; Dhanoa, M. S.; Lister, S. J. Standard Normal Variate Transformation and De-Trending of Near-Infrared Diffuse Reflectance Spectra. Appl. Spectrosc. 1989, 43 (5), 772–777. DOI: 10.1366/0003702894202201
(18) Savitzky, A.; Golay, M. J. E. Smoothing and Differentiation of Data by Simplified Least Squares Procedures. Anal. Chem. 1964, 36 (8), 1627–1639. DOI: 10.1021/ac60214a047
(19) Wang, J.; Zareef, M.; He, P.; Sun, H.; Chen, Q.; Li, H.; Ouyang, Q.; Guo, Z.; Zhang, Z.; Xu, D. Evaluation of Matcha Tea Quality Index Using Portable NIR Spectroscopy Coupled with Chemometric Algorithms. J. Sci. Food Agr. 2019, 99, 5019–5027. DOI: 10.1002/jsfa.9743
(20) Yun, Y. H.; Li, H. D.; Deng, B. C.; Cao, D. S. An Overview of Variable Selection Methods in Multivariate Analysis of Near-Infrared Spectra. TrAC-Trend. Anal. Chem. 2019, 113, 102–115. DOI: 10.1016/j.trac.2019.01.018
(21) Liang, L.; Wei, L.; Fang, G.; Xu, F.; Deng, Y.; Shen, K.; Tian, Q.; Wu, T.; Zhu, B. Prediction of Holocellulose and Lignin Content of Pulp Wood Feedstock Using Near Infrared Spectroscopy and Variable Selection. Spectrochim. Acta A 2020, 225, 117515–117521. DOI: 10.1016/j.saa.2019.117515
(22) Li, H.; Liang, Y.; Xu, Q.: Cao, D. Key Wavelengths Screening Using Competitive Adaptive Reweighted Sampling Method for Multivariate Calibration. Anal. Chim. Acta 2009, 648 (1), 77–84. DOI: 10.1016/j.aca.2009.06.046.
(23) Galvão, R. K. H.; Araújo, M. C. U.; Fragoso, W. D. A Variable Elimination Method to Improve the Parsimony of MLR Models Using the Successive Projections Algorithm. Chemom. Intell. Lab. Syst. 2008, 92 (1), 83–91. DOI: 10.1016/j.chemolab.2007.12.004
(24) Araújo, M. C. U.; Saldanha, T. C. B.; Galvão, R. K. H. The Successive Projections Algorithm for Variable Selection in Spectroscopic Multicomponent Analysis. Chemom. Intell. Lab. Syst. 2001, 57 (2), 65–73. DOI: 10.1016/S0169-7439(01)00119-8
(25) Sun, J.; Zhou, X.; Hu, Y.; Wu, X.; Zhang, X.; Wang, P. Visualizing Distribution of Moisture Content in Tea Leaves Using Optimization Algorithms and NIR Hyperspectral Imaging. Comput. Electron. Agr. 2019, 160, 153–159. DOI: 10.1016/j.compag.2019.03.004
(26) Basati, Z.; Jamshidi, B.; Rasekh, M.; Abbaspour-Gilandeh, Y. Detection of Sunn Pest-Damaged Wheat Samples Using Visible/Near-Infrared Spectroscopy Based on Pattern Recognition. Spectrochim. Acta A 2018, 203, 308–314. DOI: 10.1016/j.saa.2018.05.123
(27) Liu, F.; He, Y.; Wang, L. Comparison of Calibrations for the Determination of Soluble Solids Content and pH of Rice Vinegars Using Visible and Short-Wave Near Infrared Spectroscopy. Anal. Chim.Acta 2008, 610, 196–204. DOI: 10.1016/j.aca.2008.01.039
(28) Casale, M.; Casolino, C.; Ferrari, G.; Forina, M. Near Infrared Spectroscopy and Class Modelling Techniques for the Geographical Authentication of Ligurian Extra Virgin Olive Oil. J. Near Infrared Spectrosc. 2008, 16, 39–47. DOI: 10.1255/jnirs.759
(29) Ballabio, D.; Consonni, V. Classification Tools in Chemistry. Part 1: Linear Models. PLS-DA. Anal. Meth. 2013, 5 (16), 3790–3798. DOI: 10.1039/C3AY40582F
(30) Suykens, J. A.; Vandewalle, J. Least Squares Support Vector Machine Classifiers. Neural Process. Lett. 1999, 9 (3), 293–300. DOI: 10.1023/A:1018628609742
(31) Cortes, C.; Vapnik, V. Support-Vector Networks. Mach. Learn. 1995, 20, 273–297. DOI: 10.1007/BF00994018
(32) Wang, X.; Huang, J.; Fan, W.; Lu, H. Identification of Green Tea Varieties and Fast Quantification of Total Polyphenols by Near-Infrared Spectroscopy and Ultraviolet-Visible Spectroscopy with Chemometric Algorithms. Anal. Methods-UK 2015, 7, 787–792. DOI: 10.1039/C4AY02106A
(33) Chen, S. S.; Zhang, F. F.; Ning, J. F.; Liu, X.; Zhang, Z. W.; Yang, S. Q. Predicting the Anthocyanin Content of Wine Grapes by NIR Hyperspectral Imaging. Food Chem. 2015, 172, 788–793. DOI: 10.1016/j.foodchem.2014.09.119
(34) Qiu, Y.; Zhu, R.; Fan, Z.; Yao, X.; Lewis, E. Comparison of Models and Visualization of Total Volatile Basic Nitrogen Content in Mutton Using Hyperspectral Imaging and Variable Selection Methods. Spectrosc. Lett. 2018, 51 (5), 226–235. DOI: 10.1080/00387010.2018.1452268
(35) Hu, L.; Yin, C.; Ma, S.; Li, Z. Rapid Detection of Three Quality Parameters and Classification of Wine Based on Vis-NIR Spectroscopy with Wavelength Selection by ACO and CARS Algorithms. Spectrochim. Acta A 2018, 205, 574–581. DOI: 10.1080/00387010.2018.1452268
(36) Fan, W.; Shan, Y.; Li, G.; Lv, H.; Li, H.; Liang, Y. Application of Competitive Adaptive Reweighted Sampling Method to Determine Effective Wavelengths for Prediction of Total Acid of Vinegar. Food Anal. Methods 2012, 5 (3), 585–590. DOI: 10.1007/s12161-011-9285-2
(37) Wu, D.; He, Y.; Nie, P.; Cao, F.; Bao, Y. Hybrid Variable Selection in Visible and Near-Infrared Spectral Analysis for Non-Invasive Quality Determination of Grape Juice. Anal. Chim. Acta 2010, 659, 229–237. DOI: 10.1016/j.aca.2009.11.045
(38) Costa, D. D. S.; Mesa, N. F. O.; Freire, M. S.; Ramos, R. P.; Mederos, B. J. T. Development of Predictive Models for Quality and Maturation Stage Attributes of Wine Grapes using Vis-Nir Reflectance Spectroscopy. Postharvest Biol. Technol. 2019, 150, 166–178. DOI: 10.1016/j.postharvbio.2018.12.010
(39) Zhang, N.; Liu, X.; Jin, X. D.; Li, C.; Wu, X.; Yang, S. Q.; Ning, J. F.; Yanne, P. Determination of Total Iron-Reactive Phenolics, Anthocyanins and Tannins in Wine Grapes of Skins and Seeds Based on Near-Infrared Hyperspectral Imaging. Food Chem. 2017, 237, 811–817. DOI: 10.1016/j.foodchem.2017.06.007
(40) González-Caballero, V.; Sánchez, M. T.; Fernández-Novales, J.; López, M. I.; Pérez-Marín, D. On-Vine Monitoring of Grape Ripening Using Near-Infrared Spectroscopy. Food Anal. Methods 2012, 5 (6), 1377–1385. DOI: 10.1007/s12161-012-9389-3
(41) Fernández-Novales, J.; López, M. I.; Sánchez, M. T.; Morales, J.; González-Caballeroet. Shortwave-Near Infrared Spectroscopy for Determination of Reducing Sugar Content During Grape Ripening, Winemaking, and Aging of White and Red Wines. Food Res. Int. 2009, 42 (2), 285–291. DOI: 10.1016/j.foodres.2008.11.008
Yijia Luo, Jingrui Zhao, He Zhu, Xiaohan Li, Juan Dong, and Jingtao Sun are with the School of Food Science and the Technology/Key Laboratory of Xinjiang Phytomedicine Resource and Utilization of Ministry of Education at Shihezi University, in Shihezi, China. Direct correspondence to Jingtao Sun at sunjingtaovv@126.com ●


Measurement of Ammonia Leakage by TDLAS in Mid-Infrared Combined with an EMD-SG Filter Method
April 9th 2024In this article, tunable diode laser absorption spectroscopy (TDLAS) is used to measure ammonia leakage, where a new denoising method combining empirical mode decomposition with the Savitzky-Golay smoothing algorithm (EMD-SG) is proposed to improve the signal-to-noise ratio (SNR) of absorbance signals.


