Preparation and Spectral Properties of MgAl2O4: Tb3+ Phosphor
A series of Tb3+ doped cubic MgAl2O4 green phosphors were synthesized via hydrothermal method followed by a post-annealing process. The variation regularity of phase structure, morphology, particle size and concentration quenching mechanism were investigated. The results showed that the crystal structure of matrix materials was not affected when Tb3+ ions were introduced. In addition, the micrometer-sized rods and excellent dispersion of the particles were obtained by adding urea. Under excitation at 377 nm, the phosphors exhibited the characteristic of Tb3+ emissions with the peaks located at 488 nm (5D4 → 7F6), 544 nm (5D4 → 7F5) and 588 nm (5D4 → 7F4), respectively. Moreover, based on optical analysis, it can be inferred that electric dipole-dipole (d-d) interaction plays an important role in concentration quenching process of Tb3+ ions. The green light emitting phosphor MgAl2O4: Tb3+ can be realized by adjusting the concentrations of Tb3+, and the optimum concentration of Tb3+ ions in MgAl2O4 was found to be 0.02. Finally, the average fluorescence decay lifetime and the CIE chromaticity coordinates of Mg0.98Al2O4: 0.02Tb3+ phosphor were calculated to be 1.2005 ms and (0.3197 0.4109), respectively. The above results suggest that the developed phosphor could have potential to be used as a single-phase green emission phosphor for near-ultraviolet light-emitting diode (NUV-LED) applications.
Aluminate-based luminescent materials activated by rare earth ions are of interest due to their good water resistance, stable chemical properties, high efficiency, and lower cost (1–3). As the use of phosphors becomes more widely spread, the scope of aluminate applications includes light-storing luminescent pigments and other products, like LED phosphors (4–6). But with many similar products in the market at present, the best method for aluminate phosphors to remain competitive will be for their raw materials to be adjusted in the areas of processes, environmental protection, and applicability.
With the gradual decrease in mineral resources in the world, more and more attention has been paid to the green chemistry concept while considering the economic cost. Spinel (MgAl2O4) is an important branch of aluminate that can be widely used in ceramics (7), catalyst support (8), refractories (9), and other fields because of its unique structure. MgAl2O4 has obvious superiority to traditional oxide especially for the host material, which not only inherits the stability of the oxide, but also has lower phonon energy (about 670 cm-1). A high-temperature, solid-state method is traditional to synthesize MgAl2O4 spinel, having the advantages of technical maturity, short duration, and simple operation, but there are some disadvantages, for example large particle size, poor dispersion, and easy agglomeration. Additionally, since it is difficult to mix trace additives evenly by ball milling, this method is not advisable for low concentrations. Moreover, carefully controlling the product morphology, size, and uniformity based on the advantages of the high-temperature solid-state method has become an urgent problem for researchers. To this end, scholars from various countries are further researching the synthesis and application of MgAl2O4. Mostafa Y. Nassar and coworkers described the preparation of MgAl2O4 particles by the sol-gel assisted solid phase method with oxalic acid as an additive (10). Guotian Ye and associates (11) prepared spherical MgAl2O4 particles via thermal decomposition method while an annealing process at 900–1000 oC for 5 h was needed to obtain the final product. Lu Yang and others (12) reported on a low-temperature hydrothermal method combined with a calcination process to prepare MgAl2O4: Er3+, Yb3+ phosphors, and obtained micro-rod products through the induction of cationic surfactant CTAB. This research indicates that under mild conditions, liquid-phase reaction and solvent, pH, surfactant, and other controllable operations can help control the shape and size of the realized product powder. On this basis, the solid-phase reaction can further improve the purity of the target product.
Herein, we present a controlled synthesis of Tb3+ doped MgAl2O4 microstructures with several well-defined morphologies via a urea-based hydrothermal method followed by a heat treatment process. The synthesis route developed in this work is environmentally benign without adding organic solvents except a small amount of urea. The size and morphology of the urea has been investigated in detail. In addition, the emission properties of the prepared MgAl2O4: Tb3+ have been carried out.
Experimental
Reagents and Phosphors Preparation
The Tb3+ doping MgAl2O4 green phosphors were prepared by the hydrothermal method followed by a post-annealing treatment, in which the starting chemicals included terbium nitrate pentahydrate [Tb(NO3)3·5H2O, 99.99%], magnesium nitrate hexahydrate [Mg(NO3)2·6H2O, ≥99%], aluminium nitrate nonahydrate [Al(NO3)3·9H2O, ≥99.5%], urea [CH4N2O, ≥99.5%] and ammonia solution [NH4OH, 20% (v/v)]. Proper amounts of Tb(NO3)3·5H2O, Mg(NO3)2·6H2O and Al(NO3)3·9H2O were accurately weighed and dissolved in deionized water to prepare solutions. Then, according to Mg1-xAl2O4: xTb3+ (x = 0.005, 0.010, 0.015, 0.020, and 0.030), the mixture containing Tb(NO3)3 and Mg(NO3)2 was dripped into Al(NO3)3 solution drop by drop. After the mixture was well mixed, the urea was added and the pH was adjusted to about 11 with ammonia solution, and the stirring continued for more than 15 min. Subsequently, the mixed solution was transferred into a hydrothermal reactor at 220 oC for 6 h. After cooling the autoclave to room temperature, the precipitate was separated by centrifugation and washed with deionized water. Finally, MgAl2O4: Tb3+ phosphor was obtained by calcining the precursor at 1200 oC for 3 h.
Characterization
The X-ray diffractometer (Empyrean X, Panalytical B.V.) was used to measure the phase structure of the samples. The micro-morphology of the phosphors was observed using a field emission scanning electron microscope (Supra 55). Meanwhile, the excitation and emission spectra and fluorescent decays were recorded by a fluorescence spectrometer (Fluoromax-4, HORIBA) equipped with a 150 W xenon lamp. For comparison, all excitation and emission spectra were measured at room temperature with the same instrumental parameters.
Results and Discussions
Crystal Structure
Figure 1a displays the XRD patterns of Tb3+ doped Mg1-xAl2O4 phosphor for different concentrations of Tb3+ (x = 0.005, 0.010, 0.015, 0.020, and 0.030). As shown in the figure, all the samples were readily indexed as cubic phase and identified as MgAl2O4, according to JCPDS Card No. 21-1152. The diffraction peaks were strong and sharp without any second phases traced, which implies that all of the products were of pure MgAl2O4 structure. Also verified was that the amount of Tb3+ dopant had almost no effect on the MgAl2O4 phase composition.

 XRD patterns of Mg1-xAl2O4: xTb3+ (x = 0.005, 0.010, 0.015, 0.020, and 0.030) samples; (b) Rietveld refinement of XRD patterns of MgAl2O4: 0.030 Tb3+ and molecular structure of MgAl2O4 (inset).")
FIGURE 1: (a) XRD patterns of Mg1-xAl2O4: xTb3+ (x = 0.005, 0.010, 0.015, 0.020, and 0.030) samples; (b) Rietveld refinement of XRD patterns of MgAl2O4: 0.030 Tb3+ and molecular structure of MgAl2O4 (inset).
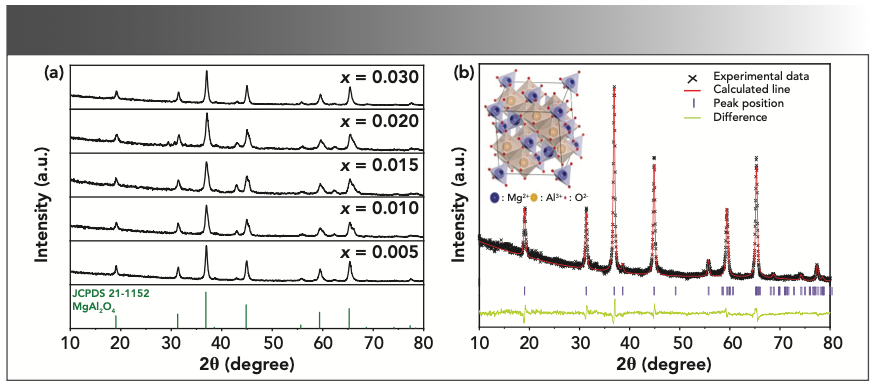
To further confirm that the samples possessed cubic structure, a structural refinement by the Rietveld analysis was performed using the GSAS soft- ware presented in Figure 1b. As the refinement converged to Rp(%) = 10.07, Rwp(%) = 12.39, the results revealed that Tb3+ doped MgAl2O4 samples had single-crystal cubic structure in space group Fd-3m. A schematic illustration of the crystal structure of MgAl2O4 is shown in the inset of Figure 1b. Here, O2- is arranged in the form of cubic close-packed, Mg2+ is located in the tetrahedral gap composed of four oxygen ions, and Al3+ is located in the octahedral gap composed of six oxygen ions. When Tb3+ ions incorporated in either of two lattice positions, one occupied the tetrahedral gap (Mg2+) and the other the octahedral gap (Al3+). Generally speaking, the substitution position of rare earth ions is related to the radius between doped ions and substituted ions, as well as charge. Based on ionic radius matching, the Tb3+ ion tends to occupy the site of Mg2+ because the ionic radius of Tb3+ is close to that of Mg2+ [Tb3+ (0.088 nm), Mg2+ (0.072 nm) > Al3+ (0.053 nm)].
Micromorphology
An SEM study was undertaken to investigate the surface morphology of Mg0.98Al2O4: 0.02Tb3+ phosphors with and without urea, as clearly displayed in Figures 2a and 2b respectively. As presented in Figure 2a, most of the products are irregular in shape, and these particles are composed of aggregated flakes. Obviously, the shape and size of the sample greatly changed with the addition of urea, and a micrometer-sized, rod-like shape with uniform morphology and excellent dispersion appeared, as shown in Figure 2b. It can be clearly seen that the length of the rod is approximately between 3 μm and 4 μm. In addition, it is obvious that with excellent dispersion and almost no aggregation, the distribution of particle size was homogeneous.

 SEM image of Mg0.98Al2O4: 0.02Tb3+ phosphors without urea and partial enlargement drawing; (b) SEM image of Mg0.98Al2O4: 0.02Tb3+ phosphors with urea and partial enlargement drawing.")
FIGURE 2: (a) SEM image of Mg0.98Al2O4: 0.02Tb3+ phosphors without urea and partial enlargement drawing; (b) SEM image of Mg0.98Al2O4: 0.02Tb3+ phosphors with urea and partial enlargement drawing.
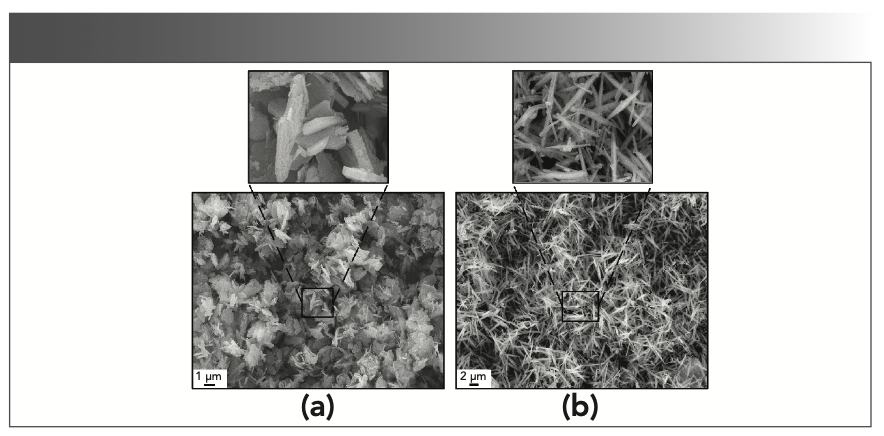
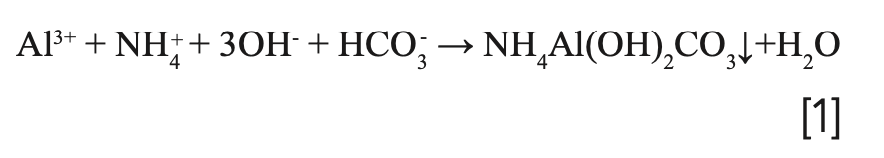
Obviously, urea played an important role in the tuning of the morphology and dispersion, whereas the rate of the crystal growth and nucleation might be accelerated by the generation of hydroxide ions supplied by the decomposition of urea. When the same amount of Al3+ and Mg2+ ions were deposited into hydrotalcite, the surplus Al3+ ions formed an ammonium aluminate carbonate with NH4+, OH- and HCO3- (equation 1) to avoid the formation of boehmite, which is easy to agglomerate under hydrothermal conditions. Therefore, the sample added with urea had better dispersion (13).


Fluorescence
Figure 3a shows the excitation spectra of Mg0.98Al2O4: 0.02Tb3+ phosphor recorded by monitoring emission wavelength at 543 nm. From 300 to 400 nm, there are a series of excitation peaks that can be observed, with excitation bands centered at 317, 339, 350, 367, and 377 nm originating from the 7F6 ground state to the 5H7, 5G2, 5L9, 5G6, and 5D3 excited states of Tb3+, respectively. Based on these results, obvious absorption peaks appear at 377 nm, indicating that such series of phosphors can be effectively excited by NUV–LED.

 the Mg0.98Al2O4: 0.02Tb3+ sample and emission spectra of (b) the Mg1-xAl2O4: xTb (x = 0.005, 0.010, 0.015, 0.020, and 0.030), and (c) MgAl2O4 host material without Tb3+ under excitation at 377 nm.")
FIGURE 3: Excitation spectra of (a) the Mg0.98Al2O4: 0.02Tb3+ sample and emission spectra of (b) the Mg1-xAl2O4: xTb (x = 0.005, 0.010, 0.015, 0.020, and 0.030), and (c) MgAl2O4 host material without Tb3+ under excitation at 377 nm.
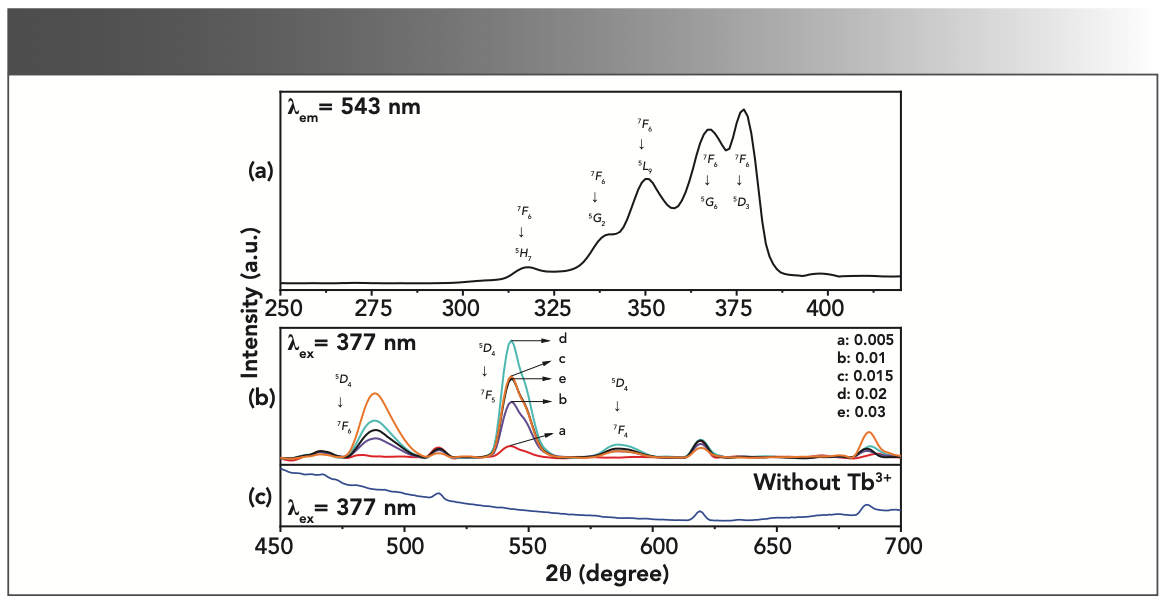
In Figure 3b, the emission lines of Tb3+ ions cover the visible spectral region, and the relative intensity of the emission lines of Tb3+ depends on the doping concentration (x) of Tb3+ in MgAl2O4: xTb3+. Under 377 nm near-ultraviolet light excitation, the most intense emission concentrated at 544 nm was attributed to 5D4 → 7F6 and 5D4 → 7F4 transitions, respectively. Moreover, weak emission peaks were detected at 514, 619, and 686 nm. By contrasting the energy structure and spectrum structure of Tb3+, it was found that none of these emission peaks belonged to characteristic transitions of Tb3+ ions. Therefore, in order to determine the source of the above emission peaks, the emission spectra of undoped Tb3+ ions were measured under the same conditions, as shown in Figure 3c. Obviously, the above emission peaks originated from the matrix. The emission intensity increased with Tb3+ concentration, while it reached the maximum at x = 0.02 and was found to decrease with further increase in the Tb3+ content due to a concentration quenching effect, originating from the greater probability of energy loss among the adjacent Tb3+.
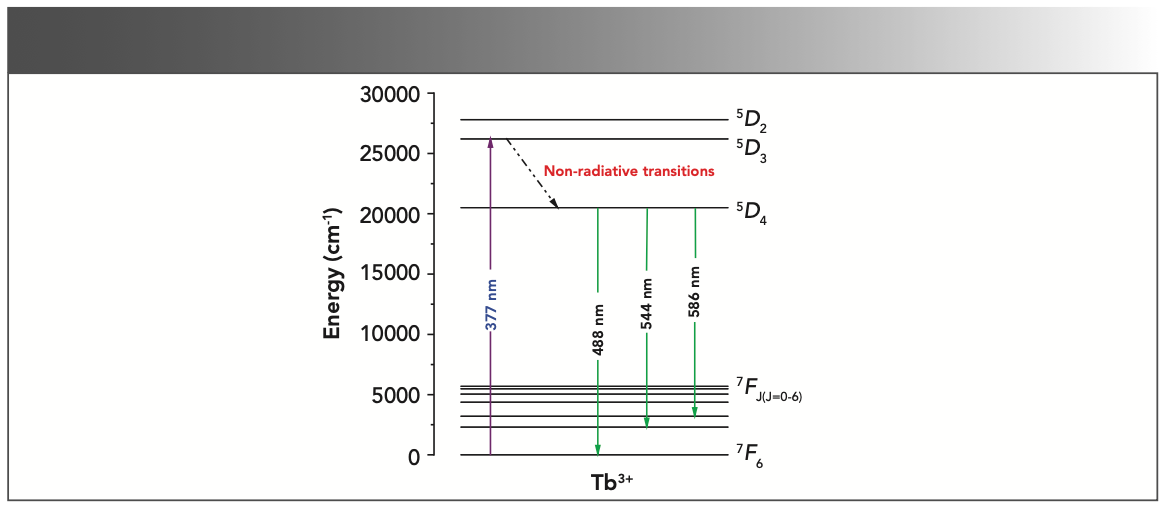
In order to explain the luminescence mechanism, Figure 4 presents the energy level scheme and the processes of photoluminescence excitation and emission of the Tb3+ ion (14). When Tb3+ doped MgAl2O4 phosphors were irradiated with 377 nm NUV light, the Tb3+ ions were excited from ground state to excitation state 5D3. The higher energy or excited quantum mechanical states quickly relaxed down to the lower energy excited state (5D4) via non-radiative relaxation. Subsequently, the radiative relaxation occurred between 5D4 → 7F4,5,6 states of the Tb3+ ion, resulting in the characteristics emission peaks at 488, 544, and 586 nm, respectively.


FIGURE 4: Energy level diagram for Tb3+ doped MgAl2O4 nanophosphor.
Decay Spectral and Concentration Quenching Analysis
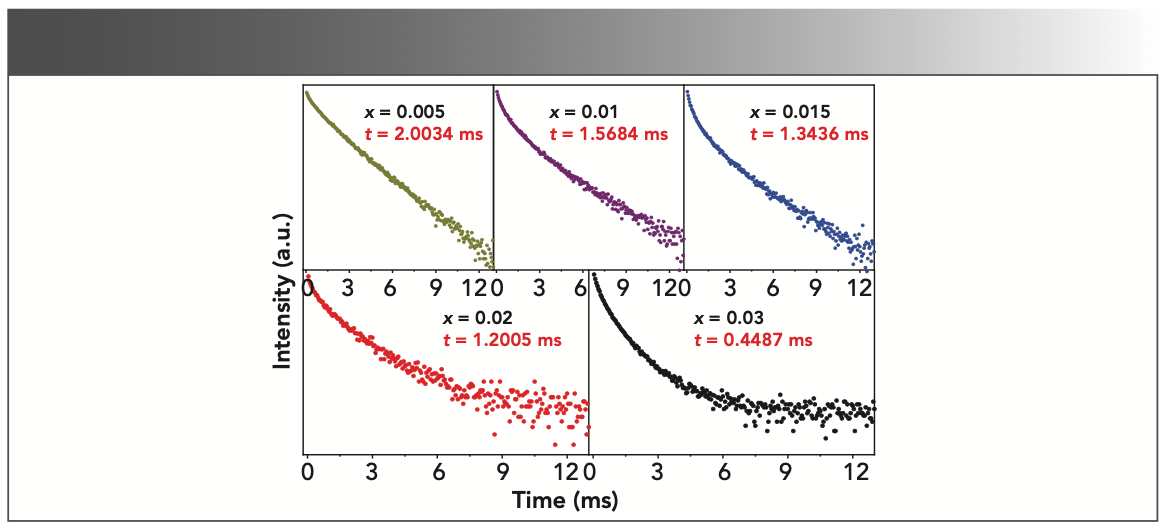
Generally, the decay kinetics behavior of a phosphor relates to the luminescent centers, amount of defects, energy transfer, and impurities in the matrix material (15). The fluorescence decay curve is measured with excitation wavelength at 377 nm and emission wavelength at 544 nm, as depicted in Figure 5. These curves, which can fit via a double-exponential function, are defined below (16):


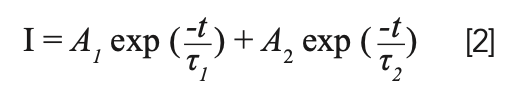


FIGURE 5: The fluorescence decay curve of MgAl2O4 with various Tb3+ concentration.
In this expression, I is the luminescence intensities at time t, A1 and A2 are constants, t represents the time, and τ1 and τ2 stand for the luminescence lifetimes for exponential composition. As a function of these parameters, average luminescence lifetime (τ) was determined to be:


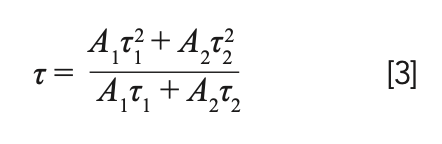
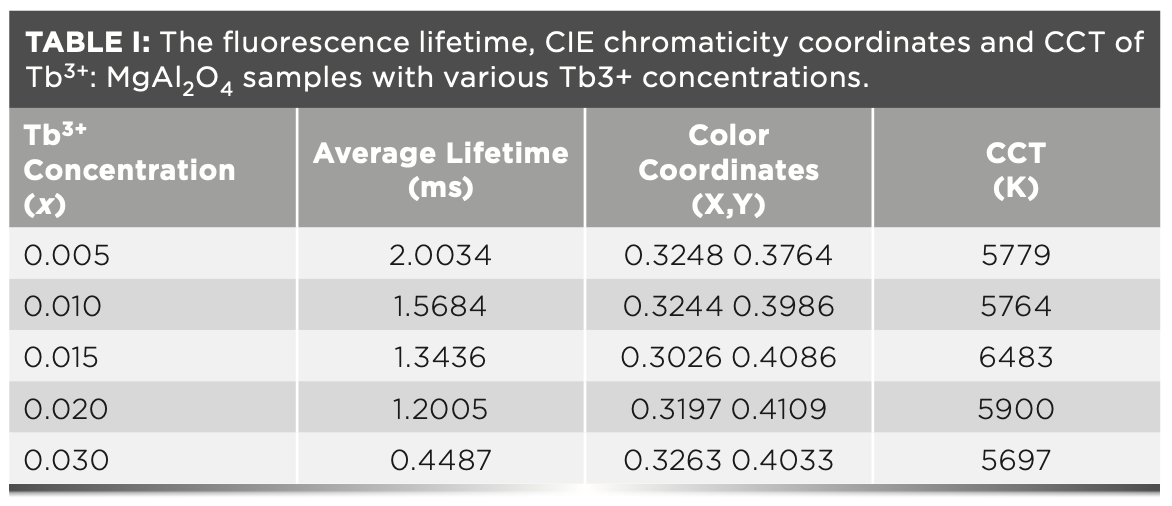
According to equations 2 and 3, the calculation results of average fluorescence lifetime are displayed in Table I. Obviously, the average lifetime of the 5D4 level decreases with the increase of Tb3+ ions’ doping concentration.


As an important parameter, the critical distance (Rc) related to the concentration quenching effect (17). Generally, the energy transfer process includes two interaction ways: one is exchange interaction, the other is electric multipole interaction. According to Blasse, if exchange interaction occurs, the critical distance between sensitized ions and activated ions should be less than 4 Å (18). As a function of the Blasse formula (19), the critical distance Rc can be expressed as:


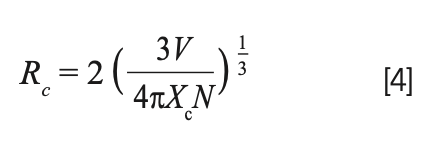
In the above-mentioned equation, Xc is the critical doping concentration of Tb3+ at the point that the quenching occurs, V is the unit cell volume and N refers to the number of formula units per unit cell.
By using Xc = 0.02, V = 521.66 Å3 and N = 8; the critical distance (Rc) of adjacent terbium ions was found to be 18.40 Å. Obviously, the energy transfer in the present case occurred through electric multipolar interaction.
In order to further study the concentration quenching mechanism of Tb3+, the integral area of the emission peaks were calculated according to the Figure 3b spectrum data. The dependence of integrated emission intensities of 5D4 → 7F4,5,6 transitions on Tb3+ concentration are depicted in Figure 6. Using Van Uitert’s theoretical model, in which the dependence of the doping concentration of the luminescence center on luminescence intensity can be expressed by the following equation (20):


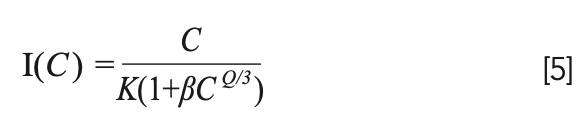


FIGURE 6: Dependence of integrated emission intensities of 5D4 → 7F4,5,6 transitions on Tb3+ concentration.
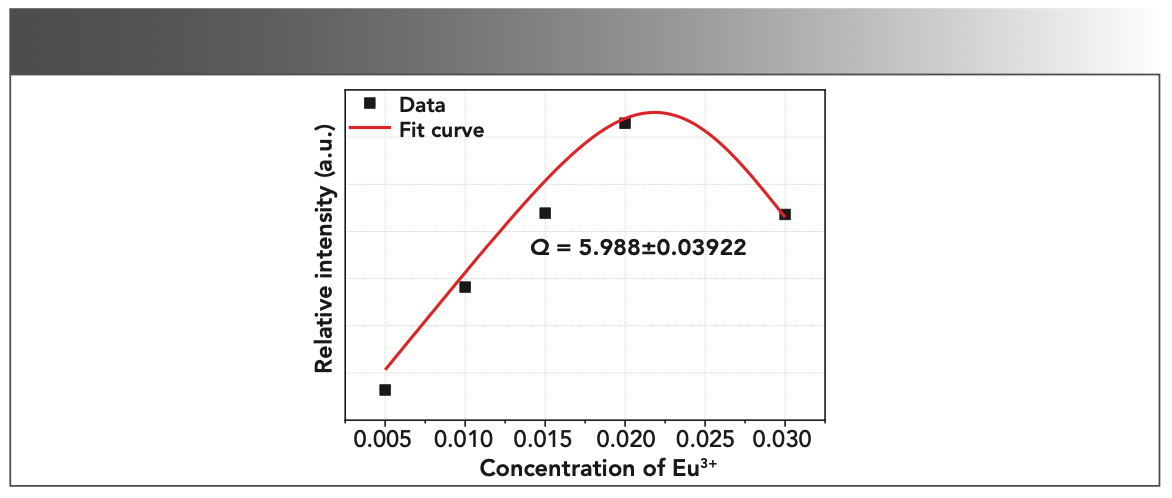
Among them, C is the concentration of the luminescence center, K and β are parameters related to the research system and measurement system parameters, and Q is the interaction mechanism between luminescence centers where Q = 6, 8, and 10 stand for the dipole-dipole (d-d) interaction, the dipole-quadrupole (d-q) interaction, and the electric quadrupole-quadrupole (q-q) interaction, respectively. Based on these, the concentration quenching experimental data of Tb3+ are nonlinear fitted according to equation 5. A good agreement with the fit curve for the whole range of concentrations was found (see Figure 6), and the Q value was obtained from the fitting process to be 5.988±0.03922, which indicated that the fluorescence quenching behavior of 5D4 level of Tb3+ was caused by the d-d interaction.
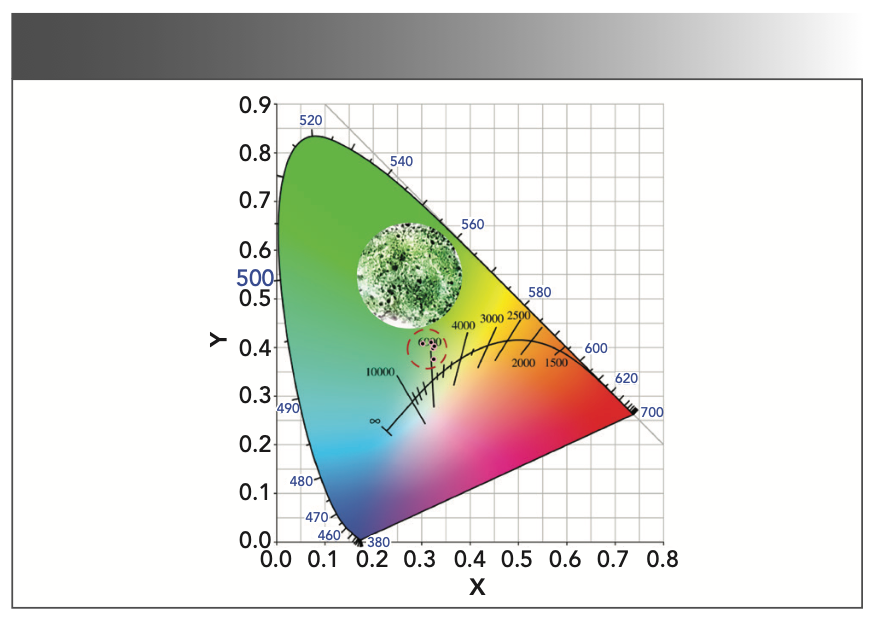
Figure 7 exhibits the CIE chromaticity diagram for the emission spectra of MgAl2O4: Tb3+ as a function of the Tb3+ doping concentration. The calculated values of color coordinate are presented in Table I. It can be found that the measured CIE coordinates of all the samples are located in the green area. Moreover, the corresponding luminescent photographs are presented in the inset of Figure 7, in which a dazzling green emission can be clearly observed in the Tb3+ doped MgAl2O4 sample with naked eyes under the 377 nm laser radiation. The correlated color temperature (CCT) as one of the characteristics of phosphor has also been calculated by using the approximate formula reported by McCamy (21,22):


where n = (X - 0.3320)/(Y - 0.1858). The results are also shown in Table I.


FIGURE 7: The CIE color coordinate diagram for MgAl2O4: Tb3+ phosphors.
Conclusions
With water as a solvent, a series of MgAl2O4: Tb3+ phosphors were synthesized via a hydrothermal assisted solid-phase method adjusting the concentration of Tb3+. The X-ray diffraction analysis revealed that the phosphors demonstrated cubic phase microcrystals; meanwhile, SEM results confirmed that particle size, morphology and dispersion of the product could be effectively controlled by adding urea. The phosphor emitted green luminescence centered at 586, 544, and 488 nm because of the 5D4 → 7F4,5,6 transition at an excitation wavelength of 377 nm. Furthermore, the emission intensity increased firstly and then decreased with the increasing of Tb3+ concentration and reached a maximum value at x = 0.02 Tb3+, at which concentration quenching was attributed to the electric d-d interaction mechanism, and the critical energy transfer distance was estimated to be 18.40 Å.
Acknowledgments
This work was supported by the National Key Research and Development Program of China (2017YFB0310300), the Natural Science Foundation of Liaoning Province (2019-DZ-0090), and Petrochemical Research Institute, PetroChina (PRIKY21001).
References
(1) Zhu, Y.; Zeng, J.; Li, W.; Xu, L.; Guan, Q.; Liu, Y. Encapsulation of Strontium Aluminate Phosphors to Enhance Water Resistance and Luminescence. Appl. Surf. Sci. 2009, 255 (17), 7580–7585. DOI: 10.1016/j.apsusc.2009.04.031
(2) Bartram, R. H.; Hamilton, D. S.; Kappers, L. A.; Lempicki, A. Electron Traps and Transfer Efficiency of Cerium-Doped Aluminate Scintillators. J. Lumin. 1997, 75 (3), 183–192. DOI: 10.1016/S0022-2313(97)00125-7
(3) Wako, A. H.; Dejene, F. B.; Swart, H. C. Combustion Synthesis, Characterization and Luminescence Properties of Barium Aluminate Phosphor. J. Rare Earths 2014, 32 (9), 806–811. DOI: 10.1016/S1002-0721(14)60145-9
(4) Abdelhameed, M. M.; Attia, Y. A.; Abdelrahman, M. S.; Khattab, T. A. Photochromic and Fluorescent Ink Using Photoluminescent Strontium Aluminate Pigment and Screen Printing towards Anticounterfeiting Documents. Luminescence 2021, 36 (4), 865–874. DOI: 10.1002/bio.3987
(5) Lü, X.; Sun, M.; Zhang, J.; Wang, T. Effect of Mixing Process on the Luminescent Properties of SrAl2O4:Eu2+, Dy3+ Long Afterglow Phosphors. J. Rare Earths 2010, 28 (1), 150–152. DOI: 10.1016/S1002-0721(09)60069-7
(6) Gao, Z. W.; Sun, P. F.; Zhong, Y. F.; Yu, R.; Deng, B. Eu3+-Doped Highly Thermal-Stable Barium Yttrium Aluminate as a Red-Emitting Phosphor for UV Based White LED Opt. Laser Technol. 2019, 111, 163–168. DOI: 10.1016/j.optlastec.2018.09.026
(7) Osipov, V. V.; Shitov, V. A.; Maksimov, R. N.; Lukyashin, K. E.; Solomonov, V. I.; Ishchenko, A.V. Fabrication and Characterization of IR-Transparent Fe2+ Doped MgAl2O4 Ceramics. J. Am. Ceram. Soc. 2019, 102 (8), 4757–4764. DOI: 10.1111/jace.16333
(8) Cho, E.; Yu, Y. J.; Kim, Y.; Phan, T. N.; Park, D.; Ko, C. H. Egg-Shell-Type Ni Supported on MgAl2O4 Pellets as Catalyst for Steam Methane Reforming: Enhanced Coke-Resistance and Pellet Stability Catal. Today 2020, 352, 157–165. DOI: 10.1016/j.cattod.2019.11.013
(9) Gu, Q.; Liu, G. Q.; Li, H. X.; Jia, Q.; Zhao, F.; Liu, X. Synthesis of MgO–MgAl2O4 Refractory Aggregates for Application in MgO–C Slide Plate. Ceram. Int. 2019, 45 (18), 24768–24776. DOI: 10.1016/j.ceramint.2019.08.218
(10) Nassar, M. Y.; Ahmed, I. S.; Samir, I. A Novel Synthetic Route for Magnesium Aluminate (MgAl2O4) Nanoparticles Using Sol–Gel Auto Combustion Method and Their Photocatalytic Properties. Spectrochim. Acta A 2014, 131, 329–334. DOI: 10.1016/j.saa.2014.04.040
(11) Ye, G. T.; Oprea, G.; Troczynski, T. Synthesis of MgAl2O4 Spinel Powder by Combination of Sol–Gel and Precipitation Processes. J. Am. Ceram. Soc. 2005, 88 (11), 3241–3244. DOI: 10.1111/j.1551-2916.2005.00564.x
(12) Lu, Y.; Wang, J.; Shi, Z. X.; Shi, J.; Liu, Y.; He, L. Site Occupation and Fluorescence Properties of MgAl2O4: Eu3+ Phosphors. Mater. Sci. Semicond. Process. 2022, 137, 106233. DOI: 10.1016/j.mssp.2021.106233
(13) Lu, Y.; Wang, J.; Shi, Z. X.; Dai, L. J.; Zhang, H. M.; Sun, Z. T.; Liu, Y. F.; Preparation and Upconversion Luminescence Properties of MgAl2O4:Er3+, Yb3+ Phosphors. Chinese J. Inorg. Chem. 2020, 36 (4), 688–694.
(14) Dieke, G. H.; Crosswhite, H. M. The Spectra of the Doubly and Triply Ionized Rare Earths. Appl. Opt. 1963, 2 (7), 675–686. DOI: 10.1364/AO.2.000675
(15) Yawalkar, M. M.; Zade, G. D.; Singh, V.; Dhoble, S. J. Investigation of Luminescence Processes in Li6Gd(BO3)3:Eu3+ Phosphor. J. Mater. Sci.: Mater. Electron. 2016, 28 (1), 1–10. DOI: 10.1007/s10854-016-5509-y
(16) Zhang, X. J.; Wang, J.; Huang, L.; Pan, F.; Chen, Y.; Lei, B.; Peng, M.; Wu, M. Tunable Luminescent Properties and Concentration-Dependent, Site-Preferable Distribution of Eu2+ Ions in Silicate Glass for White LEDs Applications. ACS Appl. Mater. Inter. 2015, 7 (18), 10044–10054. DOI: 10.1021/acsami.5b02550
(17) Ren, Y. D.; Liu, Y. H.; Tan, S. M.; Cui, H. Y.; Wang, Y. L.; Li, X. M.; Yang, R.; Wei, X.; Zhang, H. W.; Sun, Y. D. Energy Transfer Rate and Electron–Phonon Coupling Properties in Eu3+-Doped Nanophosphors. Luminescence 2017, 32 (3), 425–433. DOI: 10.1002/bio.3198
(18) Dexter, D. L.; Schulman, J. H. Theory of Concentration Quenching in Inorganic Phosphors. J. Chem. Phys. 1954, 22 (6), 1063–1070. DOI: 10.1063/1.1740265
(19) Zhu, X. M.; Zhou, Z. F. Photoluminescence and Energy Transfer Mechanism of a Novel Tunable Color Phosphor Na2MgSiO4:Tb3+, Eu3+. J. Lumin. 2017, 188, 589–594. DOI: 10.1016/j.jlumin.2017.05.003
(20) Van Uitert, L. G. Characterization of Energy Transfer Interactions Between Rare Earth Ions. J. Electrochem. Soc. 1967, 114 (10), 1048–1053. DOI: 10.1149/1.2424184
(21) Li, R. Q.; Yu, G. H.; Liang, Y. M.; Zhang, N.; Liu, Y.; Gan, S. Morphology-Controllable Synthesis of LaOF:Ln3+ (Ln=Eu, Tb) ZCrystals with Multicolor Luminescence Properties. J. Colloid Interface Sci. 2015, 460, 273–280. DOI: 10.1016/j.jcis.2015.09.001
(22) McCamy, C. S. Correlated Color Temperature as an Explicit Function of Chromaticity Coordinates. Color Res. Appl. 1992, 17 (2), 142–144. DOI: 10.1002/col.5080170211
Shi Zhongxiang, Shi Jun, Wang Jing, Lu Yang, and Liu Yongfu are with the Liaoning Key Laboratory for Fabrication and Application of Superfine Inorganic Powders, at Dalian Jiaotong University, in Dalian, China. Lu Yang is also with the Department of Materials Science and Engineering at Yingkou Institute of Technology, in Yingkou, China. Direct correspondence to: shijun@djtu.edu.cn or wangjing@djtu.edu.cn. ●


 thwart the host immune response. Coronavirus structure. | Image Credit: © Design Cells - stock.adobe.com.")


Measurement of Ammonia Leakage by TDLAS in Mid-Infrared Combined with an EMD-SG Filter Method
April 9th 2024In this article, tunable diode laser absorption spectroscopy (TDLAS) is used to measure ammonia leakage, where a new denoising method combining empirical mode decomposition with the Savitzky-Golay smoothing algorithm (EMD-SG) is proposed to improve the signal-to-noise ratio (SNR) of absorbance signals.


