Raman Scattering for Label-Free Chemical Imaging
Raman spectroscopy provides chemical information by detecting light scattered from a monochromatic source (such as a laser) at energies that correspond to molecular vibrations. Because Raman spectroscopy commonly uses visible lasers, the spatial resolution is approximately the same as what can be seen with an optical microscope. First demonstrated in the 1970s, coupling Raman spectroscopy with microscopes enabled the chemical information to be obtained from a focused laser spot. By moving the laser across the sample and recording the Raman spectrum at each location, images can be generated from changes in intensity at different Raman shifts that spatially characterize the molecules present. From the development of the Raman microprobe to today, advances in instrumentation have increased the speed, sensitivity, and spatial resolution of Raman microscopy. This article covers the fundamentals of Raman microscopy and how technological advances are enabling a variety of applications.
Since the invention of the microscope, people have been interested in understanding the organization and function that occurs on the microscopic and smaller dimensions. As the spatial dimensions decrease, the ability to identify and quantify interactions increasingly requires insight into the molecular nature of samples. Fluorescence is an optical technique that is commonly used to provide colorful images of the world, whereas emission from a fluorophore can provide highly sensitive detection and labeling of species. The use of fluorescence is particularly widespread in biology because of the development of antibodies that can recognize specific proteins and the exquisite recognition of nucleic acid sequences, both of which can incorporate fluorophores for imaging purposes. This ability to label specific targets has enabled diverse applications; however, not all targets can be labeled, and cross-reactivity can lead to misinterpretation. Ideally, the molecular properties intrinsic to the target can be used for investigations. Unfortunately, many molecules do not fluoresce, and the fluorescence signals that are emitted are broad and overlap with one another. Raman scattering is an approach that provides a unique optical signal for the identification and quantification of species observed in a microscope.
Raman Scattering
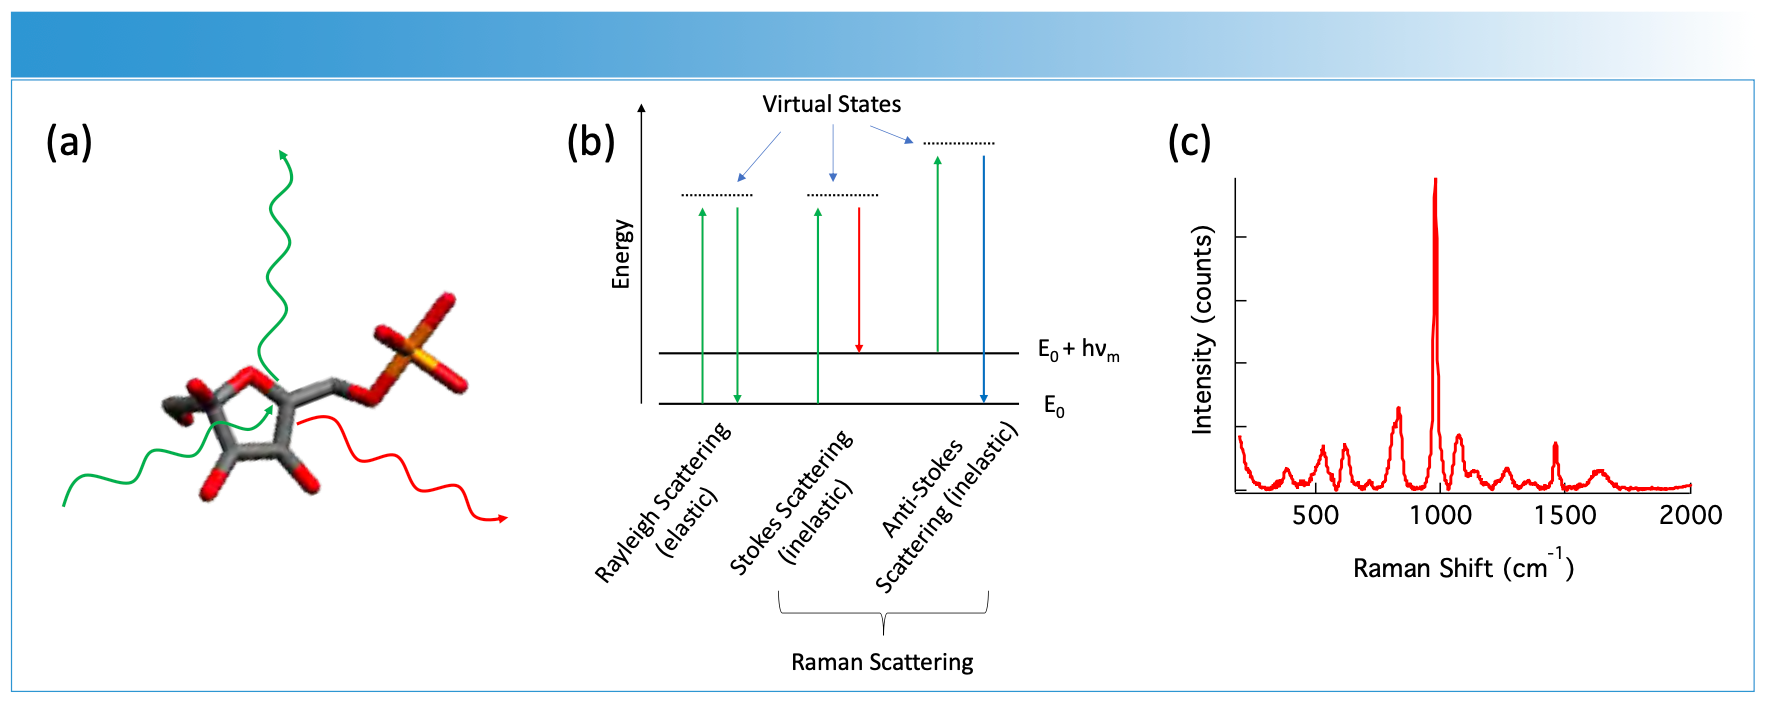
Raman scattering, first observed in the 1920s (1,2), is the inelastic scattering of light from a molecule. When light is incident upon a sample, most of the light scatters elastically at the same wavelength as the incident photons. Elastic scattering, also called Rayleigh scattering, accounts for most of the scattered light. When the incident light distorts the electron cloud of a molecule, the energy can be transferred to vibrational modes. This distortion of the electron cloud, or change in molecular polarizability, is the origin of the bands observed in a Raman spectrum (3). The transfer of energy can occur in either direction as an increase or decrease in the wavelength of the scattered light. In contrast to absorbance or fluorescence, Raman scattering does not rely on a well-defined electronic state; rather, any wavelength excitation laser can cause a change in polarizability. The commonly used construct to explain this is a virtual state, which is the energy difference from the ground state plus the excitation laser. Figure 1 illustrates the processes that are commonly associated with Raman scattering, where Raman scattering is the term used to collectively describe the light that scatters at energy shifted from incident light. The x-axis of the Raman spectrum (Figure 1c) is referred to as Raman shift to note the absolute frequency is relative to the incident laser wavelength. Because the Raman shift is measured from the incident wavelength, it is vital to use narrow bandwidth lasers as excitation sources in Raman spectroscopy.

 An illustration of light incident on a molecule is shown. The incident light (green) scatters off the molecule. (b) Some of the light is scattered at a different wavelength (red), which can be connected to the vibrational energy levels (vm) of the molecule. This loss (Stokes scattering, red) or gain (Anti-Stokes scattering, blue) can be measured as the shift in energy from the incident light. (c) Plotting the intensity of the scattered light gives a Raman spectrum as shown.")
FIGURE 1: (a) An illustration of light incident on a molecule is shown. The incident light (green) scatters off the molecule. (b) Some of the light is scattered at a different wavelength (red), which can be connected to the vibrational energy levels (vm) of the molecule. This loss (Stokes scattering, red) or gain (Anti-Stokes scattering, blue) can be measured as the shift in energy from the incident light. (c) Plotting the intensity of the scattered light gives a Raman spectrum as shown.
The intensity of the Raman band is proportional to the magnitude of change in polarizability. Equation 1 describes all the factors that contribute to the intensity of Raman scattering.

 is also important.")
EQUATION 1: The Raman scattering intensity is related to both molecular and instrumental parameters. The terms in red are properties the instrument, while the molecule cross section, pathlength, and number density are typically properties of the sample. The acquisition time (t) is also important.
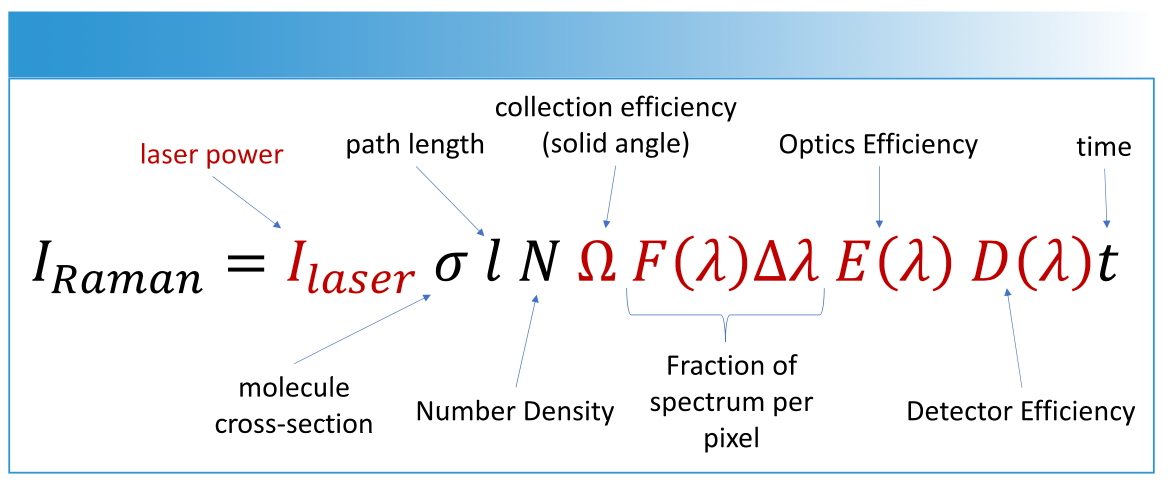
The molecular cross section is dependent on the Raman active vibrations, which accounts in part for the differences in intensity seen in the Raman spectrum. It is important to recognize that the detector also has a wavelength dependence, presented as D(λ). The different wavelengths of scattered light will be affected by the collection efficiency, properties of the optics, and detector efficiency. The absolute relative intensity of Raman bands requires correcting for the wavelength response of the detector, sometime referred to as a flatfield correction.
Raman Microscopy
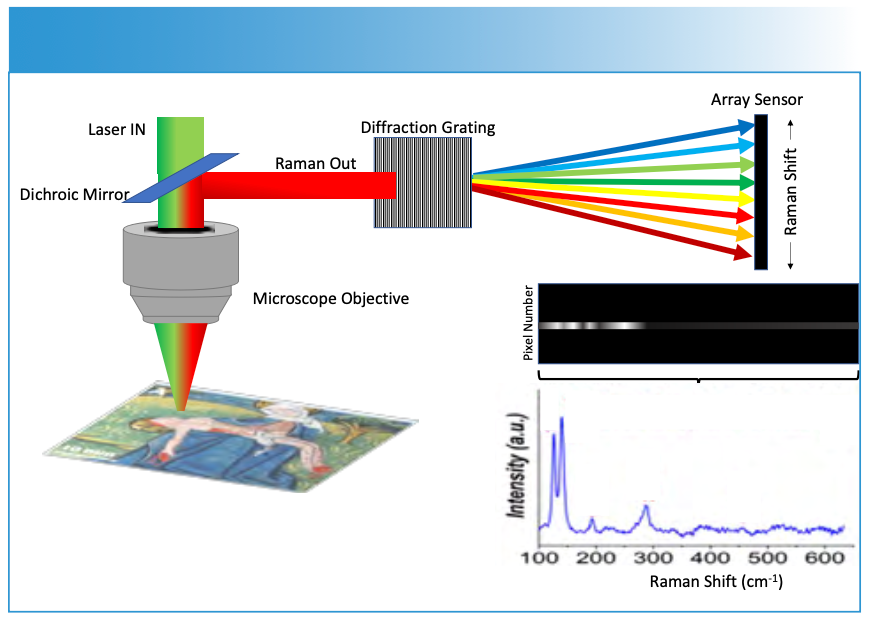
Because visible lasers are often used for Raman spectroscopy, it is relatively straight forward to incorporate Raman into a microscope. This was initially demonstrated in the 1970s (4), which included a demonstration on a tissue (5). Since then, a number of commercial Raman microscopes have been developed. The underlying premise of Raman microscopy, sometimes referred to as microspectroscopy, is illustrated in Figure 2. In this example, the excitation laser is focused to a diffraction limited spot (~1 mm in diameter), and the Raman scattering from this point is collected and recorded using a spectrograph and array detector. The example is adapted from analysis of a medieval book of hours, and it shows the spot in question was colored using the pigments massicot and lead tin yellow (6). By moving the sample under the laser, a map of the Raman spectra can be acquired and used to discern chemical differences.


FIGURE 2: The underlying principle of Raman microscopy is shown. The excitation can be focused through the objective of a microscope to point. The Raman scattering from that point is then collected, typically on an array detector after being dispersed by a diffraction grating. Columns on the array detector correspond to the wavelength dependent changes in intensity, which can be calibrated and converted into a Raman spectrum.
The spatial resolution of Raman microscopy is governed by the same principles as any optical technique. Essentially, the diffraction limit, [dspot ≈λ⁄((2 ×NA))], indicates that the wavelength of the incident laser (λ) and the numerical aperture (NA) of the objective control how small a spot can be selectively recorded. An important aspect to recognize is the NA controls the resolution and not the magnification.
The main challenge associated with Raman microscopy is that Raman cross-sections are generally very low, which requires long acquisition times to acquire images. To address this challenge, several different approaches have been researched. In the remainder of this article, we explore advances in instrumentation, as well as signal enhancement phenomena, that are being pursued to facilitate chemical imaging with Raman scattering.
Point, Line, and Wide-Field Imaging
Changing how you collect the Raman signal can reduce acquisition time and impact the spectral and spatial resolution (7). Three general approaches have been termed point mapping, line scanning, and global imaging (as shown in Figure 3). Raman microspectroscopy, discussed above, builds up an image one spot at a time. This approach, also called point mapping, uses the optimum laser power onto the sample and collects the signal from a single spot to record the Raman spectrum of the molecules within that spot. The spot is then scanned across the image. It has been noted that this approach often achieves the best signal-to-noise ratio; however, the drawback is the long acquisition times to acquire an image.

 corresponds to a different point in the image. Moving the line across the image builds the Raman map. Wide-field imaging defocuses the laser across the entire image and uses filters to select the wavelength, or Raman shifts, being imaged.")
FIGURE 3: Point mapping, line scanning, and wide-field imaging are illustrated. Point mapping focusses the laser to a diffraction limited spot to obtain a spectrum. By scanning across the image, a Raman map is obtained. Line scanning spreads the laser into a line and images the line on the array detector such that each row (yi) corresponds to a different point in the image. Moving the line across the image builds the Raman map. Wide-field imaging defocuses the laser across the entire image and uses filters to select the wavelength, or Raman shifts, being imaged.
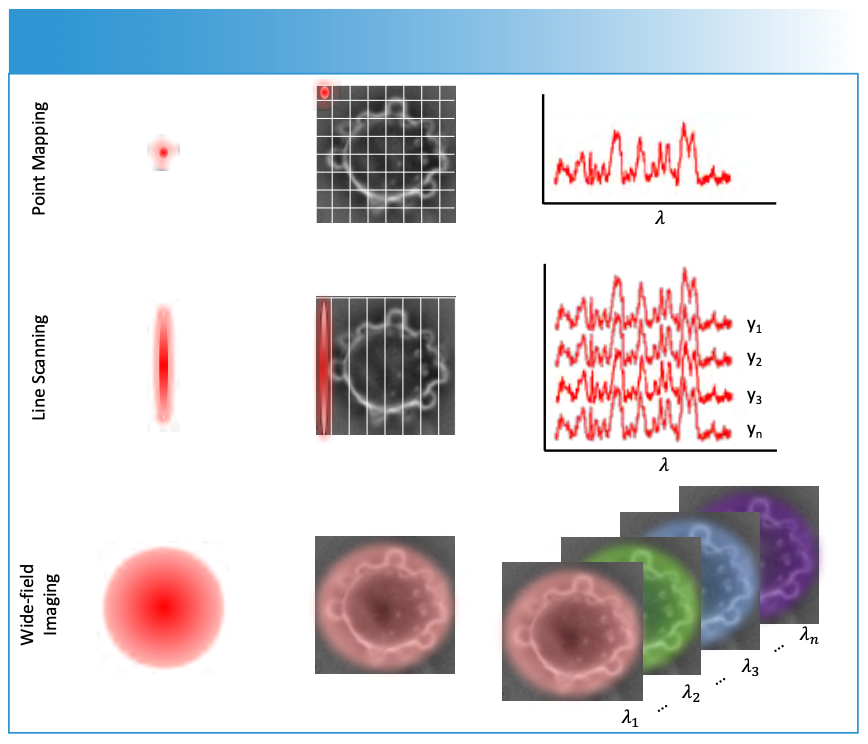
An alternative approach to point mapping is line scanning. If one was paying attention in Figure 2, one might have noticed that the spectrum is confined to a few rows of the array detector. Line scanning uses the vertical position (y) along a line to encode the spatial position of the spectrum to a row on the array detector. The excited line is imaged onto the detector after again being spectrally dispersed by a diffraction grating, such that each row now corresponds to a region of the line. The spatial resolution along the line is combination of the diffraction limit and array pixel size. This provides multiple points simultaneously for detection, which can significantly reduce imaging time while not sacrificing spectral resolution. The key trick for line scanning is to disperse the excitation laser into a line. This can be done a few different ways. Perhaps the simplest method is to use a cylindrical lens. This is relatively easy to do; however, the laser intensity along the line will vary. Alternatively, a galvo-mirror (or similar optical device) can rapidly move the focused laser into a line (8). The laser spot is moved rapidly such that during the acquisition of the Raman spectrum, the laser intensity along the line is relatively constant. Commercial instruments have been developed that incorporate both line scanning approaches noted.
Rather than image a line, why not collect the Raman image all at one time? This approach is referred to as global imaging, where the entire image is recorded, and a wavelength selector is used to discriminate between the respective Raman shifts for each image collected in series. These wavelength selectors include devices like liquid-crystal tunable filters (LCTF), or even simple filter wheels. The challenge is to obtain high spectral resolution. At narrow spectral resolution, the transmitted intensity of these devices can be quite low. Nonetheless, global imaging approaches have seen applications in Raman imaging in recent years (9,10). With advances in technology, such as improved sensitivity detectors and higher throughput narrow band filters, these approaches may see increased use.
Signal Enhancements
Increasing the magnitude of the Raman signal is another method to facilitate Raman imaging. There are several approaches that exhibit increased Raman signals.
One phenomenon that can significantly increase Raman signals is resonance Raman. As noted above, the virtual state used to explain Raman scattering does not correspond to a well-defined electronic state; however, when the energy of the laser is resonant with the energy difference between the ground and an excited state the Raman cross section can increase significantly (11,12). For colored molecules, this can generate Raman enhancements at appropriate excitation wavelengths. One example is the demonstration of live cell mapping of lycopene in cancer cells, by resonantly exciting the lycopene with a 532-nm laser (13). The increased resonance Raman signal enabled mapping the distribution of lycopene within a couple minutes. Like fluorescence, photobleaching can also be a problem in resonance Raman. One interesting approach pioneered by the Asher group takes advantage or nearly universal ultraviolet electronic states of molecules to generate ultraviolet (UV)-resonance Raman (14). Although most molecules have UV electronic states, there can be complications with interactions with the optics and detectors at UV wavelengths.
Surface-enhanced Raman scattering (SERS) has also catalyzed a tremendous increase in Raman microscopy (15). In SERS, having the laser excite the localized plasmon resonance on a nanostructure generates an increased local electric field intensity (Ilaser in Equation 1). Because the Raman scattering is close in energy to the excitation laser, the Raman scattered light is also reradiated by the nanoparticle, resulting in substantial enhancements of the Raman signal from the molecules in close proximity to the nanoparticle (16). One approach commonly used with Raman microscopy is to put reporter molecules on nanoparticles to provide a more selective signal for detection that can be readily multiplexed (17). Other applications include enhancing the intrinsic signals from molecules near the nanoparticles (18). The ability to detect the intrinsic signal from molecules is enabling spectroscopy at sensitivities, even single molecules (19,20), previously unattainable in Raman experiments. One example is the mapping of proteins in cells based on the Raman spectrum of the target protein that was detected (21).
Another approach that is commonly considered to increase sensitivity is nonlinear Raman microscopy (22). Two common methods are coherent anti-Stokes Raman spectroscopy (CARS) and stimulated Raman spectroscopy (SRS) (23,24). These approaches increase the sensitivity of Raman scattering by generating a coherent Raman signal that can be collected with high efficiency relative to non-directional scattering characteristic of spontaneous Raman spectroscopy. Careful design of molecules containing specific functional groups with distinct vibrations have been reported and used for selective nonlinear Raman imaging (25,26). Nonlinear Raman methods require pulsed lasers, which makes the techniques more complicated; however, these approaches are seeing increased use, particularly for biological applications.
Super-Resolution Raman Microscopy
Recent advances in optical microscopy have enabled imaging with spatial resolution below the optical diffraction limit, collectively referred to as super-resolution imaging, which garnered the 2014 Nobel Prize (27,28). This is also true in Raman microscopy.
For Raman, many of the advances have involved plasmonic nanoparticles, which provide the necessary signal enhancements for trace detection. Tip-enhanced Raman scattering (TERS) uses the local electric field to increase the Raman signal from molecules near an enhancing nanostructure at the apex of scanning probe tip. In ultra-high vacuum (UHV), TERS measurements have shown the ability to image parts of a single molecule (29,30). TERS measurements have now been demonstrated in electrochemical experiments (31) and with a few nanometer spatial resolution in liquids (32).
There also has been super-resolution Raman microscopy that does not use scanning probe microscopes. An early example of super-resolution Raman included imaging the diffusion of single molecules on nanoparticles (33). Another example includes using super-resolution Raman imaging to determine the location of hotspots on nanostructures (34). In these examples, the total Raman scattering was collected and changes in intensity were analyzed using stochastic optical reconstruction microscopy (STORM) algorithms to deduce the center of the emission. These methods leverage widefield collection across the Raman spectrum to deduce nanometer spatial resolution. More recently, this approach was used to monitor the movement of a nanoparticle bound to protein receptor on a cell, where localization precision of ~6 nm was observed (35).
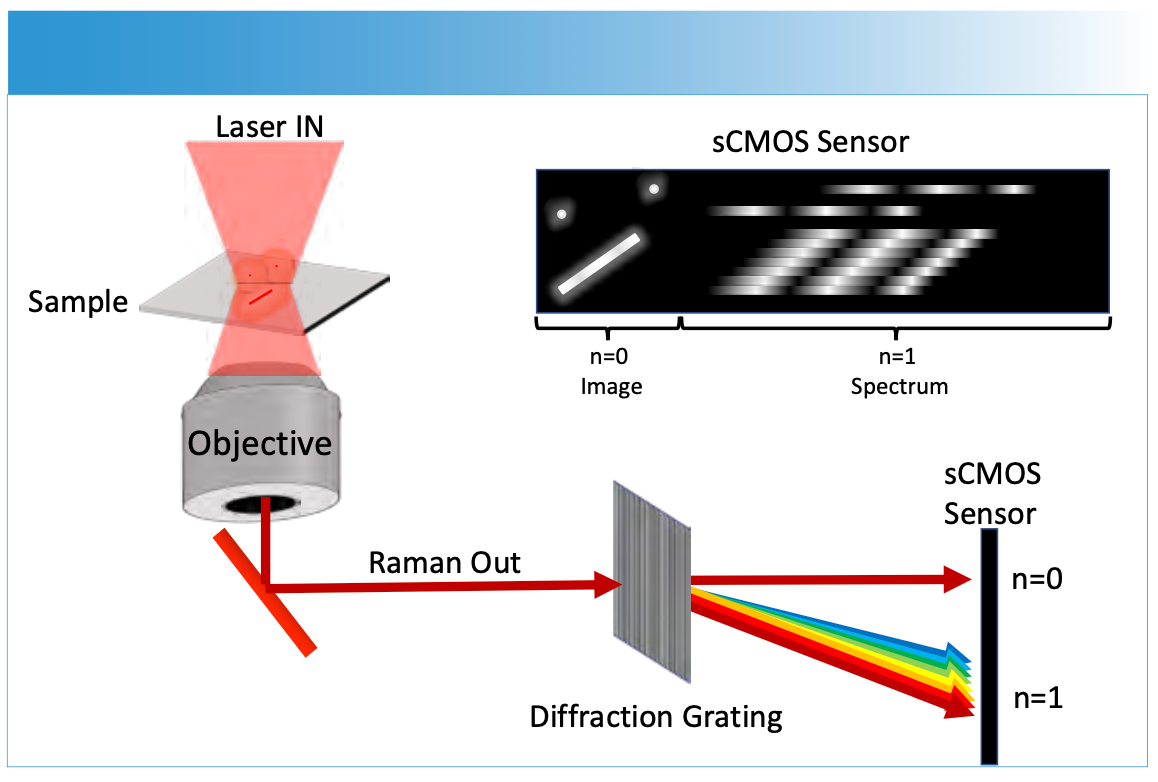
In the super-resolution SERS examples noted, little spectroscopic information is correlated with the nanometer spatial resolution. In most cases, diffraction limited spectra are acquired and connected after the fact or through inference based on the limited number of molecules in the sample. Figure 4 shows an approach that appears capable of advancing Raman spectroscopic imaging involves capturing the image and first order diffraction on the array sensor (36–39). Using enhancements from nanoparticles, the Raman signal associated with chemical species in the image can be observed and correlated to the super-resolved Raman image. This correlation of nanoscale resolved imaging and spectroscopy has exciting potential for further advances in Raman microscopy.

 light provides an image where bright features, such as nanoparticles, can be correlated directly to their spectrum (n = 1 diffracted light).")
FIGURE 4: Wide-field spectroscopic imaging is obtained by capturing a limited field of view and dispersing the first order diffraction onto a single array sensor. The undiffracted (n = 0) light provides an image where bright features, such as nanoparticles, can be correlated directly to their spectrum (n = 1 diffracted light).
Conclusion
Since the initial discovery of Raman and its incorporation into microscopes, advances are enabling chemical identification and monitoring reactions on ever decreasing length scales. The advances in technology are enabling faster measurements. The field of Raman imaging holds exciting potential to address current and future research challenges.
References
(1) Raman, C. V.; Krishnan, K. S. A New Type of Secondary Radiation. Nature 1928, 121, 501–502. DOI: 10.1038/121501c0
(2) Landsberg, G.; Mandelstam, L. A New Appearance in the Light Diffusion in Crystals. Naturwissenschaften (1913-2014) 1928, 16 (41), 772.
(3) Smith, E.; Dent, G. Modern Raman Spectroscopy : A Practical Approach; J. Wiley, 2005.
(4) Rosasco, G. J.; Roedder, E.; Simmons, J. H. Laser-Excited Raman Spectroscopy for Nondestructive Partial Analysis of Individual Phases in Fluid Inclusions in Minerals. Science 1975, 190 (4214), 557–560. DOI: 10.1126/science.190.4214.557
(5) Abraham, J. L.; Etz, E. S. Molecular Microanalysis OF Pathological Specimens in situ with a Laser-Raman Microprobe. Science 1979, 206 (4419), 716–718. DOI: 10.1126/science.493979
(6) Manukyan, K. V.; Guerin, B. J.; Stech, E. J.; Aprahamian, A.; Wiescher, M.; Gura, D. T.; Schultz, Z. D. Multiscale X-ray Fluorescence Mapping Complemented by Raman Spectroscopy for Pigment Analysis of a 15th Century Breton Manuscript. Anal. Meth. 2016, 8 (42), 7696–7701, DOI: 10.1039/C6AY02301K
(7) Schlucker, S.; Schaeberle, M. D.; Huffman, S. W.; Levin, I. W. Raman Microspectroscopy: A Comparison of Point, Line, and Wide-Field Imaging Methodologies. Anal. Chem. 2003, 75 (16), 4312–4318. DOI: 10.1021/ac034169h
(8) Kong, L.; Zhang, P.; Yu, J.; Setlow, P.; Li, Y.-q. Rapid Confocal Raman Iimaging Using a Synchro Multifoci-Scan Scheme for Dynamic Monitoring of Single Living Cells. Appl. Phys. Lett. 2011, 98 (21), 213703. DOI: 10.1063/1.3595482
(9) Wang, L.; Dai, Y.; He, H.; Lv, R.; Zong, C.; Ren, B. Dynamic Raman Imaging System with High Spatial and Temporal Resolution. Rev. Sci. Instrum. 2017, 88 (9), 095110. DOI: 10.1063/1.5002569
(10) Mazaheri, L.; Jelken, J.; Aviles, M. O.; Legge, S.; Lagugne-Labarthet, F. Investigating the Performances of Wide-Field Raman Microscopy with Stochastic Optical Reconstruction Post-Processing. Appl. Spectrosc. 2022, 76 (3), 00037028211056975. DOI: 10.1177/00037028211056975
(11) Asher, S. A. UV Resonance Raman-Spectroscopy for Analytical, Physical, and Biophysical Chemistry (2). Anal. Chem. 1993, 65 (4), 201A–210A. DOI: 10.1021/ac00052a715
(12) Lewis, A.; Spoonhow, J; Bogomoln, R. A.; Lozier, R. H.; Stoecken, W. Tunable Laser Resonance Raman-Spectroscopy of Bacteriorhodopsin. Proc. Natl. Acad. Sci. USA. 1974, 71 (11), 4462–4466. DOI: 10.1073/pnas.71.11.4462
(13) Scarpitti, B. T.; Chitchumroonchokchai, C.; Clinton, S. K.; Schultz, Z. D. In Vitro Imaging of Lycopene Delivery to Prostate Cancer Cells. Anal. Chem. 2022, 94 (12), 5106–5112. DOI: 10.1021/acs.analchem.1c05442
(14) Asher, S. A. UV Resonance Raman-Spectroscopy for Analytical, Physical, and Biophysical Chemistry (1). Anal. Chem. 1993, 65 (2), 59A–66A. DOI: 10.1021/ac00050a717
(15) Langer, J.; Jimenez de Aberasturi, D.; Aizpurua, J.; Alvarez-Puebla, R. A.; Auguié, B.; Baumberg, J. J.; Bazan, G. C.; Bell, S. E. J.; Boisen, A.; Brolo, A. G.; et al. Present and Future of Surface-Enhanced Raman Scattering. ACS Nano 2019, 14 (1), 28–117. DOI: 10.1021/acsnano.9b04224
(16) Stiles, P. L.; Dieringer, J. A.; Shah, N. C.; Van Duyne, R. P. Surface-Enhanced Raman Spectroscopy. Annu. Rev. Anal. Chem. 2008, 1 (1), 601–626. DOI: 10.1146/annurev.anchem.1.031207.112814
(17) Laing, S.; Gracie, K.; Faulds, K. Multiplex in vitro Detection Using SERS. Chem. Soc. Rev. 2016, 45 (7), 1901–1918. DOI: 10.1039/c5cs00644a
(18) Nguyen, A. H.; Peters, E. A.; Schultz, Z. D. Bioanalytical Applications of Surface-Enhanced Raman Spectroscopy: De Novo Molecular Identification. Rev. in Anal. Chem. 2017, 36 (4), 20160037. DOI: 10.1515/revac-2016-0037
(19) Nie, S. M.; Emery, S. R. Probing Single Molecules and Single Nanoparticles by Surface-Enhanced Raman Scattering. Science 1997, 275 (5303), 1102–1106. DOI: 10.1126/science.275.5303.1102
(20) Kneipp, K.; Wang, Y.; Kneipp, H.; Perelman, L. T.; Itzkan, I.; Dasari, R.; Feld, M. S. Single Molecule Detection Using Surface-Enhanced Raman Scattering (SERS). Phys. Rev. Lett. 1997, 78 (9), 1667–1670. DOI: 10.1103/PhysRevLett.78.1667
(21) Sloan-Dennison, S.; Schultz, Z. D. Label-Free Plasmonic Nanostar Probes to Illuminate in vitro Membrane Receptor Recognition. Chem. Sci. 2019, 10 (6), 1807–1815. DOI: 10.1039/c8sc05035j
(22) Antonio, K. A.; Schultz, Z. D. Advances in Biomedical Raman Microscopy. Anal. Chem. 2014, 86 (1), 30-46. DOI: 10.1021/ac403640f
(23) Freudiger, C. W.; Min, W.; Saar, B. G.; Lu, S.; Holtom, G. R.; He, C.; Tsai, J. C.; Kang, J. X.; Xie, X. S. Label-Free Biomedical Imaging with High Sensitivity by Stimulated Raman Scattering Microscopy. Science 2008, 322 (5909), 1857–1861. DOI: 10.1126/science.1165758
(24) Evans, C. L.; Xie, X. S. Coherent Anti-Stokes Raman Scattering Microscopy: Chemical Imaging for Biology and Medicine. Annu. Rev. Anal. Chem. 2008, 1 (1), 883–909. DOI: 10.1146/annurev.anchem.1.031207.112754
(25) Tipping, W. J.; Wilson, L. T.; An, C.; Leventi, A. A.; Wark, A. W.; Wetherill, C.; Tomkinson, N. C. O.; Faulds, K.; Graham, D. Stimulated Raman Scattering Microscopy with Spectral Phasor Analysis: Applications in Assessing Drug–Cell Interactions. Chem. Sci. 2022, 13 (12), 3468–3476. DOI: 10.1039/D1SC06976D
(26) Wei, L.; Chen, Z.; Shi, L.; Long, R.; Anzalone, A. V.; Zhang, L.; Hu, F.; Yuste, R.; Cornish, V. W.; Min, W. Super-Multiplex Vibrational Imaging. Nature 2017, 544 (7651), 465–470. DOI: 10.1038/nature22051
(27) Willets, K. A.; Wilson, A. J.; Sundaresan, V.; Joshi, P. B. Super-Resolution Imaging and Plasmonics. Chem. Rev. 2017, 117 (11), 7538–7582. DOI: 10.1021/acs.chemrev.6b00547
(28) Moerner, W. E. Nobel Lecture: Single-Molecule Spectroscopy, Imaging, and Photocontrol: Foundations for Super-Resolution Microscopy. Rev. Mod. Phys. 2015, 87 (4), 1183–1212. DOI: 10.1103/RevModPhys.87.1183
(29) Zhang, R.; Zhang, Y.; Dong, Z. C.; Jiang, S.; Zhang, C.; Chen, L. G.; Zhang, L.; Liao, Y.; Aizpurua, J.; Luo, Y.; et al. Chemical Mapping of a Single Molecule by Plasmon-Enhanced Raman Scattering. Nature 2013, 498 (7452), 82–86. DOI: 10.1038/nature12151
(30) Li, L.; Schultz, J. F.; Mahapatra, S.; Lu, Z.; Zhang, X.; Jiang, N. Chemically Identifying Single Adatoms with Single-Bond Sensitivity During Oxidation Reactions of Borophene. Nat. Commun. 2022, 13 (1), 1796. DOI: 10.1038/s41467-022-29445-8
(31) Zeng, Z.-C.; Huang, S.-C.; Wu, D.-Y.; Meng, L.-Y.; Li, M.-H.; Huang, T.-X.; Zhong, J.-H.; Wang, X.; Yang, Z.-L.; Ren, B. Electrochemical Tip-Enhanced Raman Spectroscopy. J. Am. Chem. Soc. 2015, 137 (37), 11928–11931. DOI: 10.1021/jacs.5b08143
(32) El-Khoury, P. Z. Tip-Enhanced Raman Chemical and Chemical Reaction Imaging in H2O with Sub-3-nm Spatial Resolution. J. Am. Chem. Soc. 2023, 145 (12), 6639–6642. DOI: 10.1021/jacs.3c01626
(33) Titus, E. J.; Weber, M. L.; Stranahan, S. M.; Willets, K. A. Super-Resolution SERS Imaging beyond the Single-Molecule Limit: An Isotope-Edited Approach. Nano. Lett. 2012, 12 (10), 5103–5110. DOI: 10.1021/nl3017779
(34) Lindquist, N. C.; de Albuquerque, C. D. L.; Sobral-Filho, R. G.; Paci, I.; Brolo, A. G. High-Speed Imaging of Surface-Enhanced Raman Scattering Fluctuations from Individual Nanoparticles. Nat. Nanotechnol. 2019, 14 (10), 981–987. DOI: 10.1038/s41565-019-0535-6
(35) de Albuquerque, C. D. L.; Schultz, Z. D. Super-resolution Surface-Enhanced Raman Scattering Imaging of Single Particles in Cells. Anal. Chem. 2020, 92 (13), 9389–9398. DOI: 10.1021/acs.analchem.0c01864
(36) Schmidt, M. M.; Farley, E. A.; Engevik, M. A.; Adelsman, T. N.; Bido, A. T.; Lemke, N. D.; Brolo, A. G.; Lindquist, N. C. High-Speed Spectral Characterization of Single-Molecule SERS Fluctuations. ACS Nano. 2023, 6675–6686. DOI: 10.1021/acsnano.2c12457
(37) Olson, A. P.; Spies, K. B.; Browning, A. C.; Soneral, P. A. G.; Lindquist, N. C. Chemically Imaging Bacteria with Super-Resolution SERS on Ultra-Thin Silver Substrates. Sci. Rep-Uk 2017, 7 (1), 9135. DOI: 10.1038/s41598-017-08915-w
(38) Shoup, D. N.; Scarpitti, B. T.; Schultz, Z. D. A Wide-Field Imaging Approach for Simultaneous Super-Resolution Surface-Enhanced Raman Scattering Bioimaging and Spectroscopy. ACS Meas. Sci. Au 2022, 2 (4), 332–341. DOI: 10.1021/acsmeasuresciau.2c00013
(39) de Albuquerque, C. D. L.; Zoltowski, C. M.; Scarpitti, B. T.; Shoup, D. N.; Schultz, Z. D. Spectrally Resolved Surface-Enhanced Raman Scattering Imaging Reveals Plasmon-Mediated Chemical Transformations. ACS Nanosci. Au 2021, 1 (1), 38–46. DOI: 10.1021/acsnanoscienceau.1c00031
Zachary D. Schultz is with the Department of Chemistry and Biochemistry at The Ohio State University, in Columbus, Ohio. Direct correspondence to: schultz.133@osu.edu●


Nanometer-Scale Studies Using Tip Enhanced Raman Spectroscopy
February 8th 2013Volker Deckert, the winner of the 2013 Charles Mann Award, is advancing the use of tip enhanced Raman spectroscopy (TERS) to push the lateral resolution of vibrational spectroscopy well below the Abbe limit, to achieve single-molecule sensitivity. Because the tip can be moved with sub-nanometer precision, structural information with unmatched spatial resolution can be achieved without the need of specific labels.


