Rapid Quantitative Method in the Determination of Total Flavonoids in Tibetan Medicine Meconopsis integrifolia (Maxim.) Franch. from Qinghai-Tibet Plateau by Near Infrared Spectroscopy
Meconopsis integrifolia (Maxim.) Franch. is a traditional Tibetan medicine for treating pneumonia and hepatitis. Studies on quality evaluation of M. integrifolia by near-infrared spectroscopy (NIR) are lacking. This study aimed to establish a fast, accurate method for quality evaluation of herbal medicine using NIR and chemometrics with ultraviolet-visible spectrophotometry (UV-vis) as a standard method to determine the total flavonoids content. The NIR spectra of 372 M. integrifolia from 14 different populations in the Qinghai-Tibet Plateau and the total flavonoids content were determined using NIR and UV-vis, respectively. The total flavonoids content was 1.63–10.17%. The quantitative model conditions were partial least squares + Constant + first derivatives + No smoothing. The root mean square error of calibration, validation, and cross-validation were 0.459, 0.590, and 0.824, respectively. The coefficient of calibration, validation, and cross-validation were 0.9626, 0.9294, and 0.8750, respectively. The residual predictive deviation of the building model was 3.59, and the value was greater than 3.0. These indexes indicate that the model evaluation performs applicably for rapid and accurate quality evaluation of M. integrifolia. The correlation and multiple stepwise regression analysis of environmental factors established altitude was the dominant factor, and low altitude was conducive for accumulating compounds. These results will guide the selection and utilization of M. integrifolia medicine.
The quality of traditional herbal medicine determines the efficacy of medicinal materials and products (1). Good quality traditional herbal medicinal materials influence the safety and effectiveness of clinical medication, and form the basis for developing the Chinese medicine industry. Currently, chromatographic technology is the primary method for evaluating traditional herbal medicinal materialsquantitatively (2). However, the limitations of this method include destruction of the original medicinal sample and complicated sample preparation. Near-infrared spectroscopy (NIR) combines spectroscopy, the computer, and basic nondestructive testing technology to perform multi-component analysis and online medicine. NIR is a rapid and accurate technology requiring simple operation, fewer materials, and simple sample preparation (3–6). However, the NIR spectral information of medicinal samples is generalized, and needs the combined application of chemometric methods to effectively extract information from complex spectra; therefore, the NIR technology is convenient. The NIR technology is used in agriculture, medicine, food, petroleum, and medicinal materials (4,7–9). In medicinal materials, Wang and associates (10) analyzed the active ingredients in 636 wild and cultivated Macrohyporia cocos using ultra-fast liquid chromatography-mass spectrometry (LC–MS). The spectral data distinguished wild and cultivated Macrohyporia cocos. A combined attenuated total reflectance (ATR) and partial least squares (PLS) satisfactorily predicted contents of active ingredients using qualitative and quantitative analysis.
Meconopsis integrifolia (Maxim.) Franch, a traditional Tibetan medicine, is a perennial herb, mainly distributed in the Tibet region, Qinghai, Sichuan, northwestern Yunnan, and Gansu provinces of China. The M. integrifolia herb clears heat, detoxifies, reduces inflammation, relieves pain, and is an effective treatment for pneumonia and hepatitis because of their high flavonoid contents (11,12). Flavonoids are the main active ingredients of anti-hepatic fibrosis and antioxidant activity (13–16). The total flavonoids content is usually determined by ultraviolet-visible spectrophotometry (UV-vis), a time-consuming, labor-intensive technique unsuitable for the quality-controlled evaluation of medicinal material. Furthermore, the contents of active ingredients vary with growth environments because environmental factors affect effective components accumulation in medicinal plants (17–18). Mykhailenko (19) concluded that environmental factors, including habitat types, soil composition, climatic factors, and altitude, affect the phenolic contents of Iris plants from different populations. However, there are inconclusive reports on evaluations and ecological factor analysis of M. integrifolia.
In this study, multi-point M. integrifolia samples from the Qinghai-Tibet Plateau were analyzed using the combined NIR-chemometric approach for the quantitative detection of total flavonoids. The correlation and stepwise regression analysis established the environmental factors affecting total flavonoids accumulation in M. integrifolia. These results will enhance the quality control of medicinal materials and provide a scientific basis for selecting and using high-quality M. integrifolia.
Materials and Methods
Samples and Instruments
Samples and Reagents
M. integrifolia from 14 different populations in the Qinghai-Tibet Plateau, China (Figure 1) was authenticated by Prof. Sun Jing (Northwest Institute of Plateau Biology [NWIPB], Chinese Academy of Sciences, Xining) according to the Flora Reipublicae Popularis Sinicae. The 14 populations covered typical M. integrifolia growth habitats. The GPS recorded the altitude, longitude, and latitude of the sampling points while collecting samples. Before analysis, the 372 obtained samples were taken to the laboratory for washing, drying, crushing, sieving, and desiccation. The specimen (No: 2019-002) was deposited in Qinghai Provincial Key Laboratory of Qinghai-Tibet plateau biological resource, NWIPB.


FIGURE 1: Samplings geographic distribution of M. integrifplia from the Qinghai-Tibet Plateau.

Soils samples from the 14 populations were collected and sieved through a 40-mesh sieve to remove gravel and weeds. After that, soil pH (NY/T 1377-2007, China), total soil salt content (NY/T 1121.16-2006, China), available phosphorus content (NY/T 1121.7-2014, China), available potassium content (NY/T889-2004, China), and organic matter content (NY/T 1121.6-2006, China) were determined following the recommended standards of the Ministry of Agriculture, China. The total nitrogen content (LY/T 1228-2015, China), total phosphorus content (LY/T 1232-2015, China), and total potassium content (LY/T 1234-2015, China) were determined following the forest soil measurement standard of China. The soil available nitrogen was determined using local standards (DB13/T 843-2007, Qinghai, China).
The rutin reference standard was provided by the Chengdu Institute of Biology-Chinese Academy of Science, Sichuan, China (batch No. MUST-13040302). Ethanol was provided by Chengdu Cologne Co., Ltd. Sodium hydroxide and aluminum nitrate were purchased from the Shanghai Macklin Biochemical Co., Ltd. Sodium nitrite was purchased from Tianjin Dengke Chemical Reagent Co., Ltd.
Instruments
The Thermo Scientific Nicolet iS 50 (Thermo Fisher) equipped with NIR, mid-infrared [MIR], and ATR accessories with 1.20 cm cup diameter performed the NIR analysis. The Cary 60 UV-Vis (Agilent Technologies) determined the total flavonoids content. Samples were weighted by a balance with 0.0001 g resolution (ME104, Zurich, Switzerland). Ultrapure water produced by a Milli-Q system (Milli-Q Integral3, Merck & Co., Inc.) was used for all solutions and dilutions. Centrifugation was performed using Eppendorf 5810R (Eppendorf AG) and drying using DHG9245A (Shanghai Yiheng Technical Co., Ltd.).
NIR Spectroscopy
The smashed samples were sieved through 100 mesh sieves before NIR analysis. Briefly, samples (0.10 cm) were placed in respective sample cups with air as the reference, and the NIR spectra were measured (n = 3) in the 10000–4000 cm-1 and scanned 64 times with 8 cm-1 scanning resolution.
The common absorption peaks were determined with a <5% missing rate (20). One-way analysis of variance (ANOVA) analyzed the common absorption peaks to determine the NIR spectra differences from the different populations.
Determination of Total Flavonoids by UV Method
The rutin reference standard was accurately weighed (20.0 mg) and diluted to 10.00 mL using 75% ethanol to formulate a mother liquor of 2.00 mg/mL. The mother liquor was diluted to 0.10 mg/mL, 0.30 mg/mL, 0.50 mg/mL, 0.70 mg/mL and 0.90 mg/mL. Standard solutions (2.00 mL) from the different concentrations were placed into 25 mL volumetric flasks, and 1.00 mL of 5% NaNO2 was added to each flask and shaken well. After 5 min, 1.00 mL of 10% Al(NO3)3 was added to the mixture, shaken well, and left to stand for 6 min. Another 1.00 mL of 40% NaOH was added to the mixture, and lastly, topped to 25 mL with 75% ethanol. The solution was mixed and set for 15 min. The blank control, 75% ethanol, was treated with the same procedure. The UV absorbance was measured at 510 nm wavelength (21–23). A standard curve was drawn using absorbance (A) as the ordinate and the rutin concentration as the abscissa.
Total flavonoids were extracted using ultrasonic extraction (1˸50 material˸liquid ratio with 55% ethanol at 60 °C for 20 min and 200 W ultrasonic power, [n = 3]). The UV determined the absorbance of the samples and substituted absorbance into the standard curve to calculate the contents. The average content of each population was then calculated and analyzed.
Quantitative Modeling
Sample Set Selection
Outliers were eliminated by the Mahalanobis distance and the remaining samples used for modeling. Samples were randomly divided into calibration and verification sets at a 2˸1 ratio to meet the analysis requirements. The content range of the verification set should fall within the verification set (24).
Modeling Conditions and Model Evaluation
The measurements of NIR and total flavonoids content were analyzed with the TQ analyst software. Under the PLS modeling method, the root mean squared error of calibration (RMSEc), root mean squared error of validation/prediction (RMSEp), root mean squared error of cross-validation (RMSEcv), coefficient of calibration (Rcal), coefficient of validation (Rval), coefficient of cross-validation (Rcv), residual predictive deviation (RPD) were considered as model evaluation indexes. A single-factor test optimized the optical pathlength, spectrum type, and smoothing methods. The single factor levels were shown in Table I.


The R coefficients (Rcal, Rval, Rcv), root mean square error (RMSEc, RMSEp, RMSEcv), and RPD were indicators for evaluating the performances of the models. The RMSEp estimated the deviation between the predicted and actual values. The RPD tested the applicability of the model, where RPD > 3.0 indicated an accurate model, RPD > 2.5 indicated an applicable model, and RPD < 2.5 showed a flawed inapplicable model for performance prediction.
Statistical Analysis
The one-way ANOVA performed by the IBM SPSS Statistics 25 analyzed the differences in sample quality from the different populations.
Correlation and stepwise regression analysis established the effects of ecological factors (altitude, longitude, latitude) and soil factors (pH, total salt content, available nitrogen, available phosphorus, available potassium, organic matter, total nitrogen, total phosphorus, and total potassium) on total flavonoids.
The PLS model, characterized with high prediction accuracy, small computation, robustness, and widely used in quantitative analyses (25), was adopted in this study as the quantitative model.
Results and Discussion
Spectral Characteristics
The NIR spectra of the 372 samples were collected under the optimized acquisition conditions (Figure 2). Using <5% missing rate as an indicator, five common absorption peaks including 6808 cm-1, 5779 cm-1, 5174 cm-1, 4682 cm-1, and 4256 cm-1 were determined (Table II). The relative standard deviations (RSD) were >5%, indicating a large absorption difference among samples. This large difference was probably caused by the wide sampling range, discrepant growth conditions, and the divergence in compound content among samples (26).


FIGURE 2: Near infrared spectra of M. integrifplia.
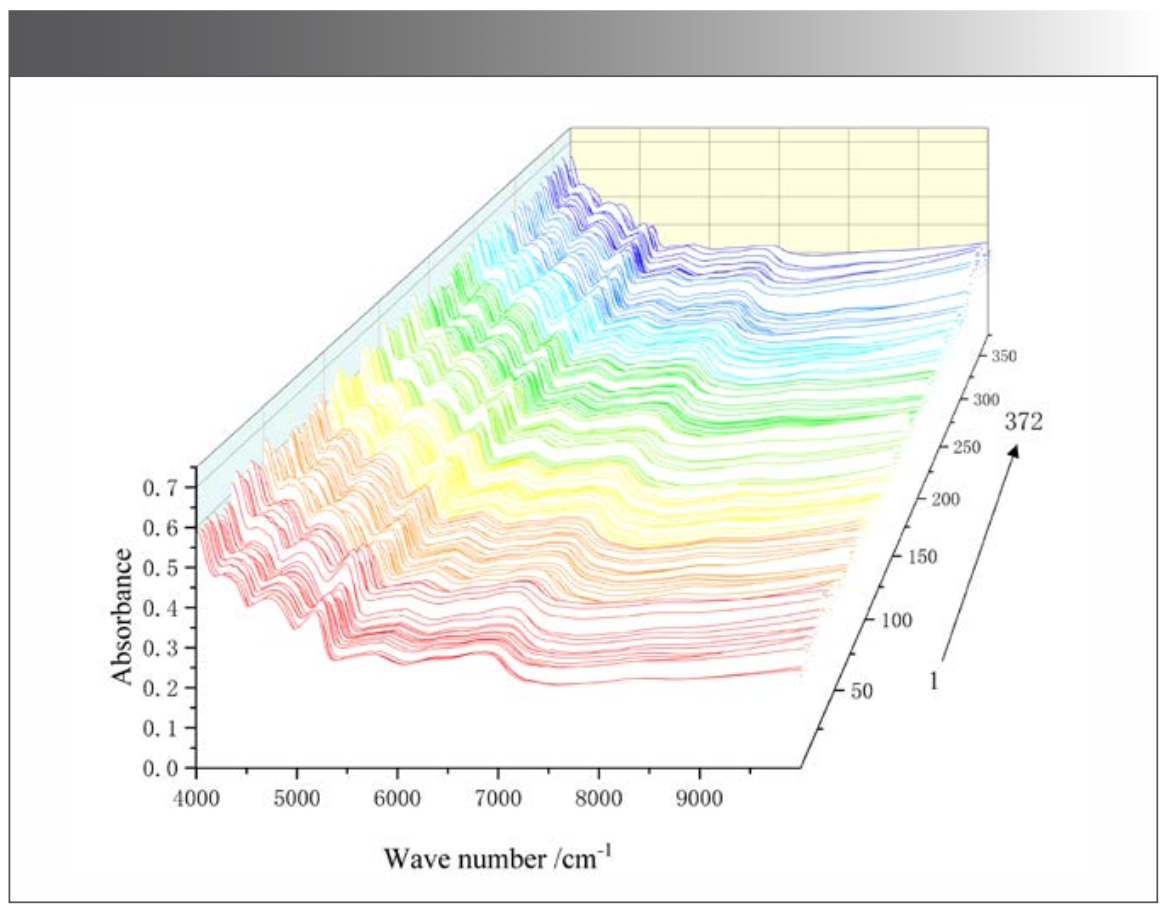


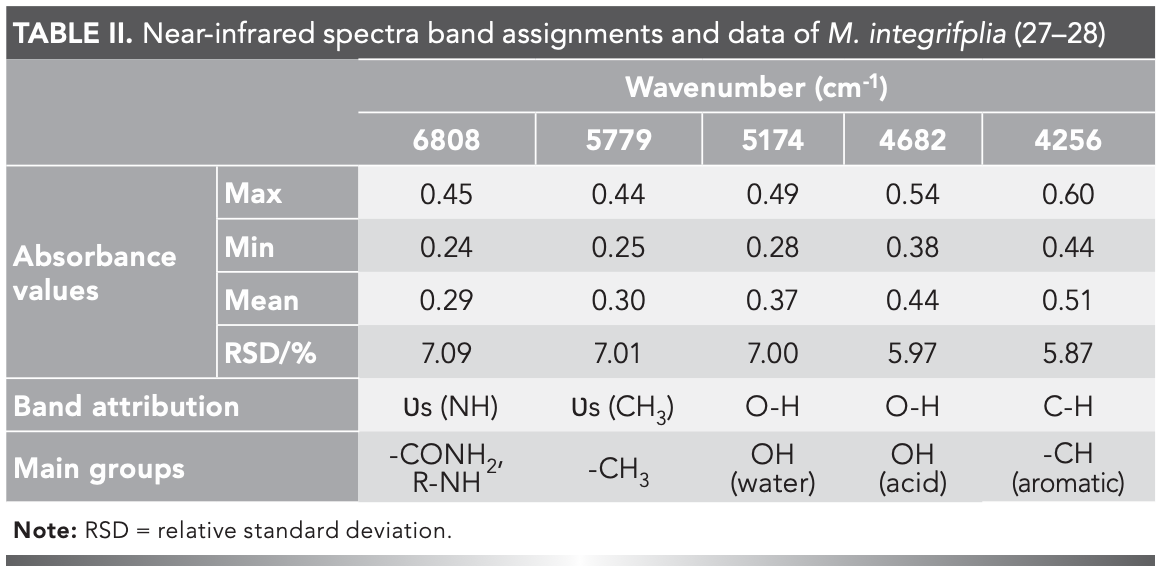
Common absorption peaks were analyzed, and the results were as follows. The stretching vibration of -NH was symmetric at 6808 cm-1, representing the CONH2 and R-NH groups. The stretching vibration of CH3 was symmetric at 5779 cm-1, -OH in water at 5174 cm-1, -OH in acid at 4682 cm-1, and -CH vibration in aromatics at 4256 cm-1 (Table II).
The one-way ANOVA of the five common absorption peaks showed an extremely significant difference (P = 0.00 < 0.01) between populations. The NIR spectrum showed different compound contents of M. integrifolia from the different populations.
Quantitative Analysis of Total Flavonoids
Using the rutin reference standard, the linear regression equation of 0.00 mg/mL-1.00 mg/mL was Y = 0.8551X-0.0153, R2 = 0.9990. There was a strong, positive linear relationship between rutin concentration and absorbance.
The RSD of total flavonoids from the repeatability, precision, and stability tests were less than 1.50%, and the standard addition recovery rate was 99.75%. The methodology test showed that the detection effect of this method was good. The total flavonoids content in 372 samples ranged from 1.63% to 10.17%.
The average total flavonoids contents were 3.0-8.0% in the 14 populations (Figure 3). Population ten (P10) had the highest average total flavonoids content (7.66%), and P2 had the lowest content (3.24%). The geographic distance between P10 and P2 was significantly different (Figure 1). The differences in total flavonoid contents relate to environmental factors, as in Hawk tea sampled from six botanical origins according to Tan and associates (29).


FIGURE 3: Results of average total flavonoids content of 14 populations.
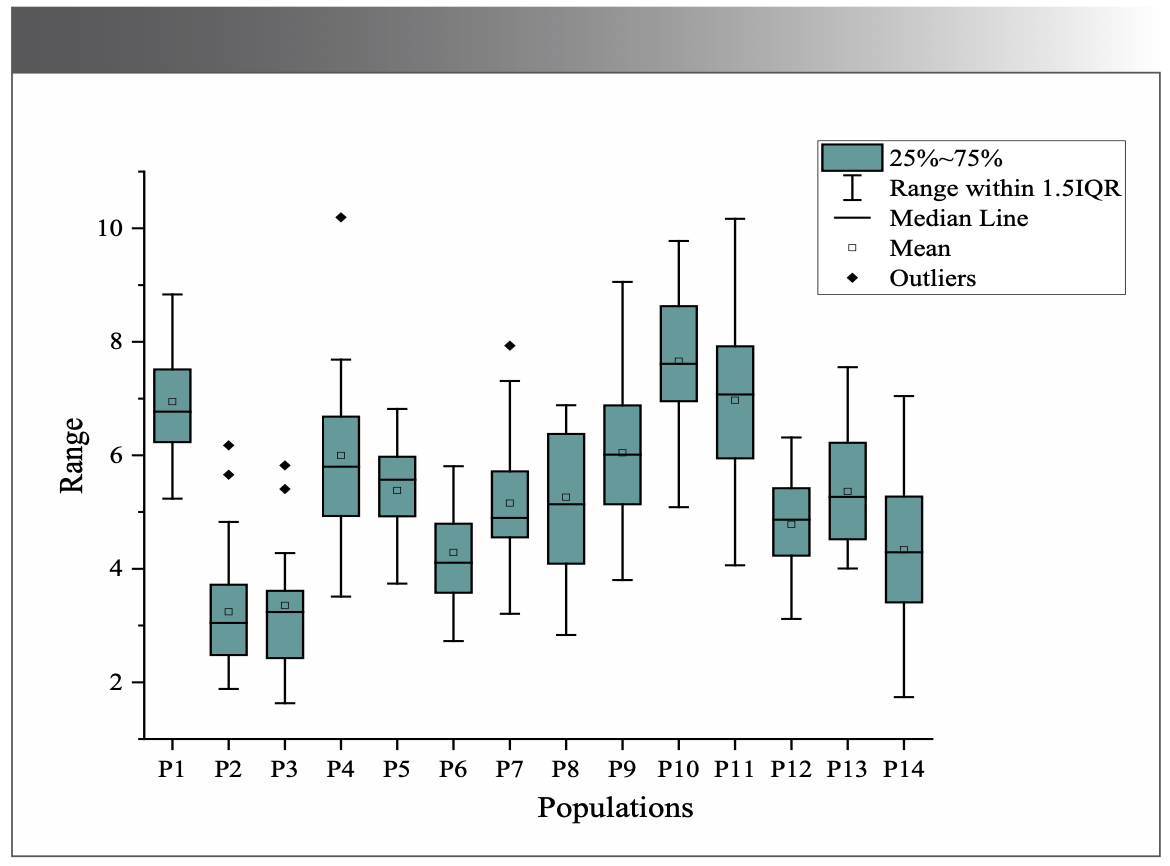
The one-way ANOVA results were consistent with the results of NIR. Both analyses revealed that the total flavonoids contents in M. integrifolia from the 14 populations had highly significant differences (P = 0.00 < 0.01), indicating the different qualities of M. integrifolia under the different growth environments for the 14 populations.
Quantitative Modeling
Sample Set Selection
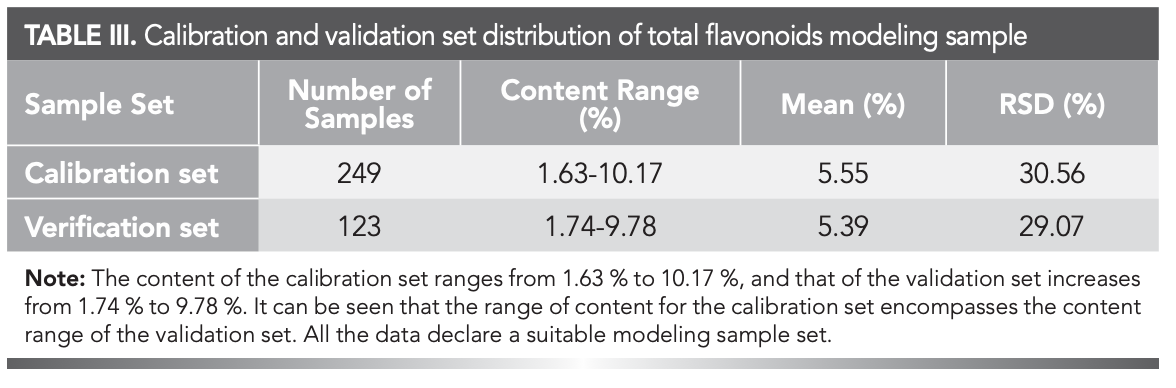
The sample distribution of the calibration and verification sets from the 372 retained samples (after eliminating outliers by the Mahalanobis distance, one sample was rejected) after outlier elimination were presented in Table III. The mean, RSD, and range of percentage content were similar between the calibration and verification sets—therefore, suitable for modeling (30).


Modeling Conditions and Model Evaluation
PLS is a classic quantitative modeling method widely used in spectral analysis. It can simultaneously decompose the independent and dependent variable matrices and conduct multiple linear regression of the obtained score matrices. Goncalves and colleagues (31) used NIR combined with PLS for rapid determination of solids content of amino resins.
The results showed that PLS model could be used to evaluate the performance of amino resin. In addition, it achieves dimension reduction and noise elimination effect. Under the PLS, single-factor experiment, nine tests of optimized pathlength, spectrum type, and smoothing methods, were performed (Table IV). The model with PLS + Constant + D1 + No smoothing worked best in the full band.


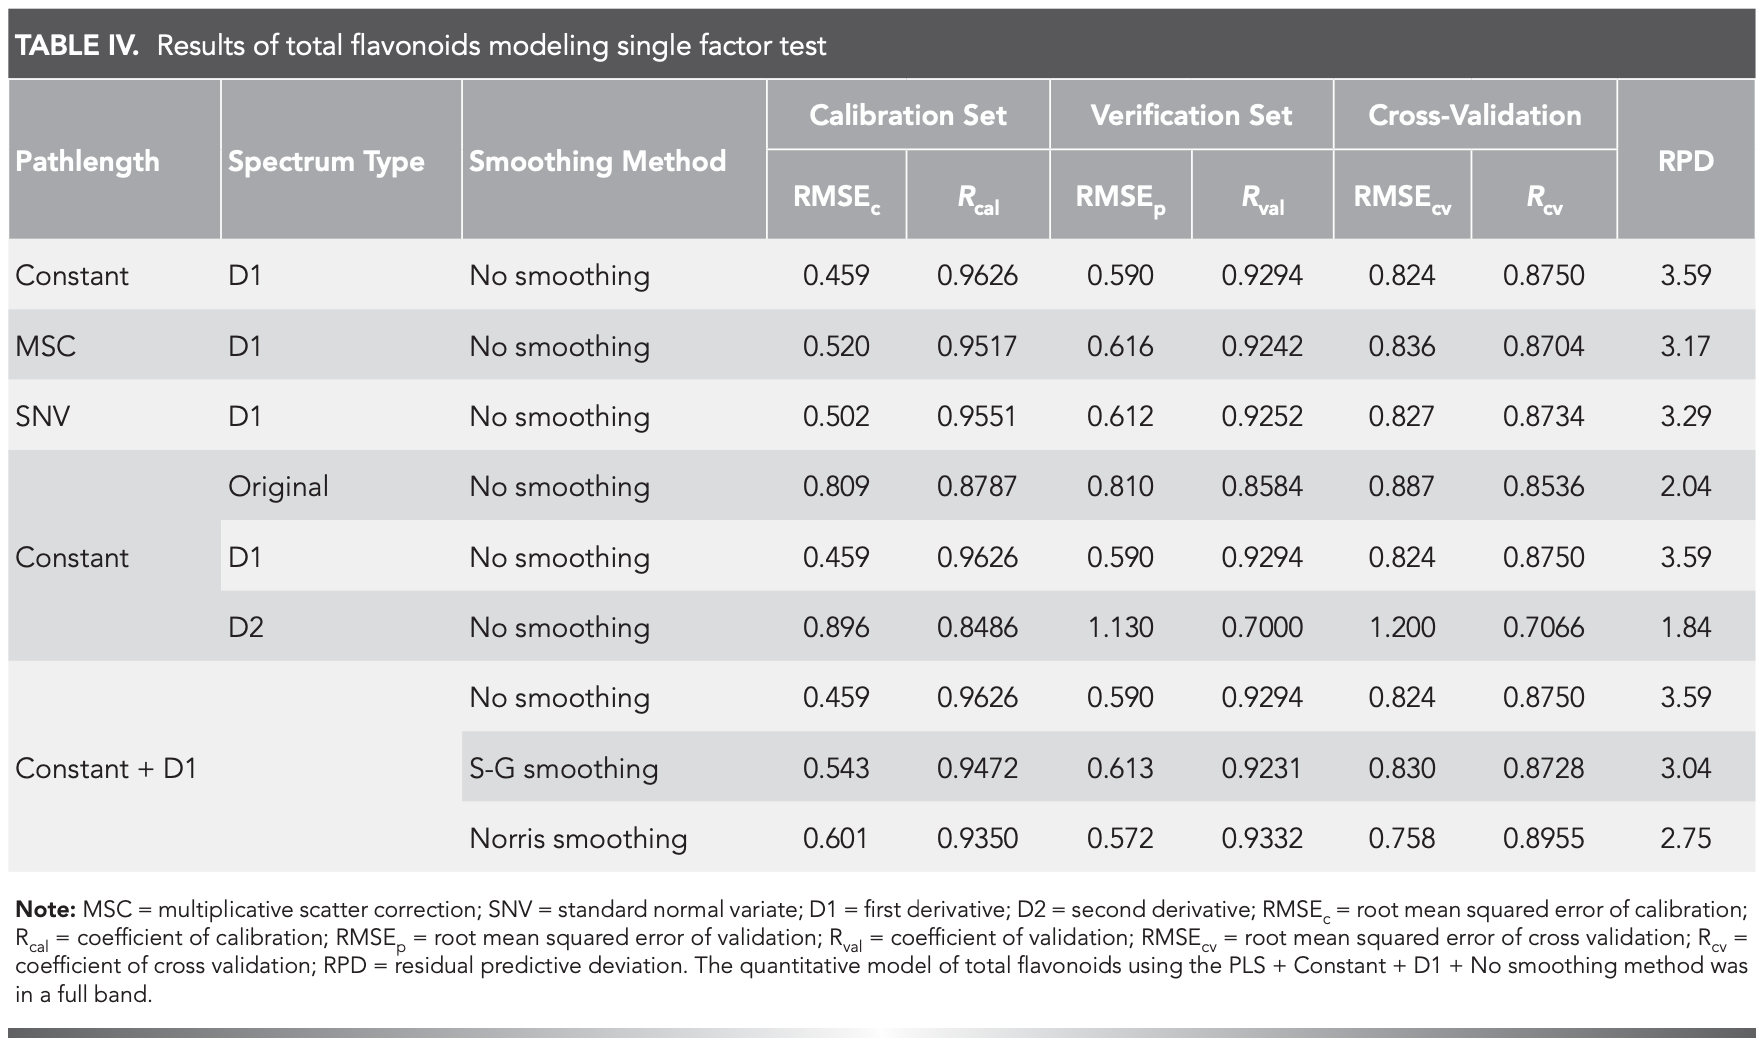
R-value represented the correlation between the value predicted by the model and the value analyzed by standard methods, with closer values to 1 indicating a better correlation. The RMSEc, RMSEp, and RMSEcv values correlated with the sample chemistry values, showing good stability and predictive ability of the model when results were smaller and closer together. Low RMSEc, RMSEp, and RMSEcv and high Rcal, Rval, and Rcv indicate a good quantitative model. An RPD > 3.0 denotes that the model accurately predicted the contents (32). These parameters established the effectiveness of the model.
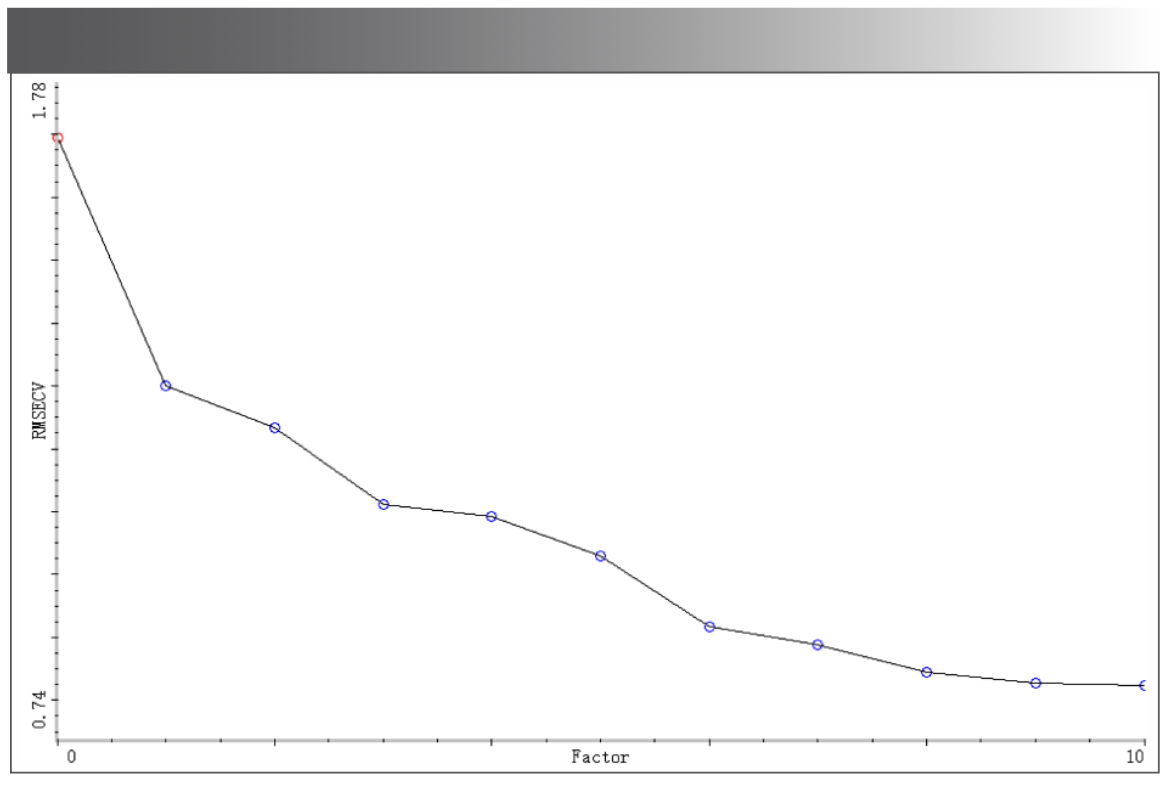
The quantitative model of total flavonoids using the PLS + Constant + D1 + No smoothing method was in a full band, and the number of factor was ten. Figure 4 was a graph of RMSECV vs number of factors. It can be seen that with the increase of the number of factors, the value of RMSECV gradually decreases, so the optimal number of factors was 10. The calibration and verification set parameters (RMSEc = 0.459, RMSEp = 0.590, Rcal = 0.9626, Rval = 0.9294), the cross-validation set parameters (RMSEcv = 0.824, Rcv = 0.8750), and RPD (3.59 > 3.0) were shown (Figure 5). These results confirmed that the model correctly predicted the flavonoids content of M. integrifolia (33–34).


FIGURE 4: Figure of RMSECV vs number of factors.

 shows the calibration set and verification set parameters; (b) shows the cross-validation set parameters.")
FIGURE 5: Quantitative model parameters of total flavonoids. (a) shows the calibration set and verification set parameters; (b) shows the cross-validation set parameters.

When Leng (34) applied the support vector regression (SVR) and PLS methods to establish quantitative models for detecting the total volatile basic nitrogen (TVB-N) content in beef and pork, the prediction performance of the PLS model (R = 0.9366, RMSEP = 3.15) performed better than the SVR model (R = 0.8314, RMSEP = 4.61), showing that the PLS method was more suitable than SVR for quantitative analyses. However, the model parameters from this study performed better than that in the Leng (35) experiment, implying a better prediction effect. The speculation was that the first derivative processing promoted that effect (36).
Environmental Factors
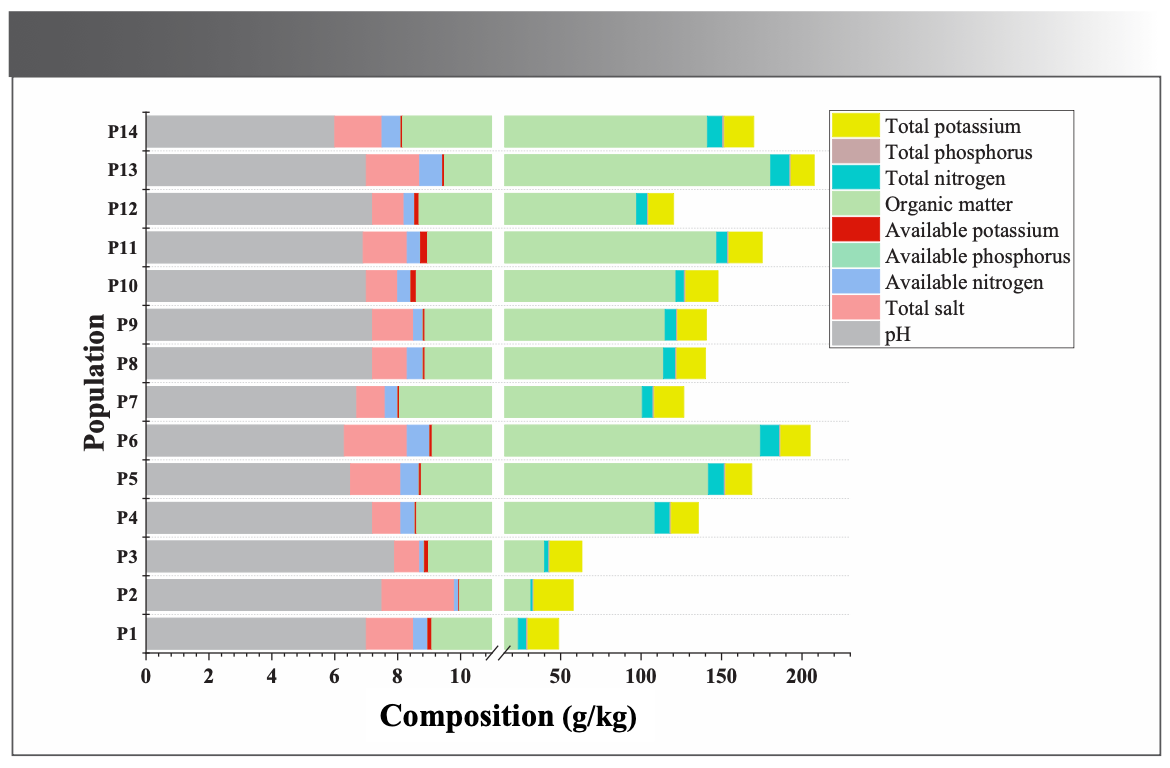
The genetic characteristics, adaptation, and selection to complex external environmental variations during evolution determined the formation and accumulation of secondary metabolic components (18). Ecological environments are crucial for screening high-quality medicinal plants. For this study, the altitude, latitude, and longitude of each collection site were measured while sampling, and soils from each sampling site were collected for analysis. The ecological factors and soil parameters at respective collection sites were listed in Figure 6.


FIGURE 6: Environmental factors from different populations of M. integrifplia.
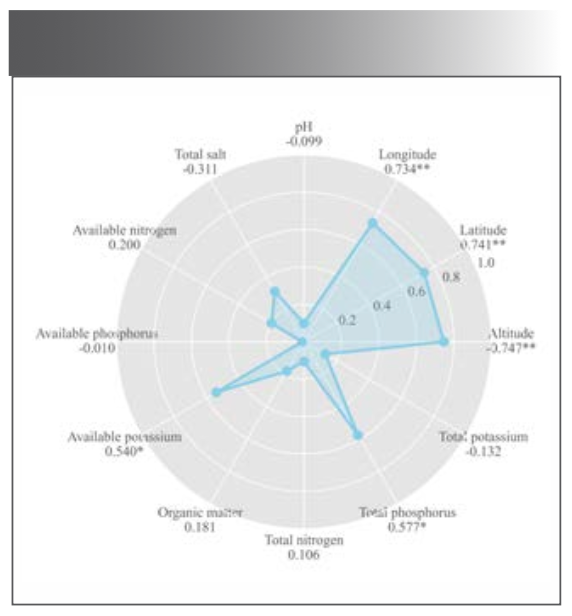
The altitude, latitude, and longitude were significantly correlated with the total flavonoids contents (Figure 7), confirming the analysis in Section “Quantitative Analysis of Total flavonoids.” Altitude was negatively correlated with the total flavonoids, indicating that low altitude was conducive for flavonoids accumulation. The temperature at low altitudes was probably more suitable for M. integrifolia growth. Liu and associates (36) studied the influence of ecological factors on the active ingredients in Sinopodophyllum hexandrum (Royle) T.S. Ying from eight locations. The organic matter, significantly and positively correlated with the active substances, was the most critical limiting factor. In this study, the total flavonoids contents positively correlated with available potassium and total phosphorus in the soil. These findings indicated the nutrients in the soil positively influence the accumulation of active ingredients, consistent with the results of Liu and colleagues (37).


FIGURE 7: Radar chart of correlation analysis between content and environmental factors. * represent significant correlation; **represent extremely significant correlation
Although there was a range of significant correlation between the total flavonoids content and some environmental factors, environmental factors do not affect plants alone, but often affect each other. The environmental factors displayed no significant linearity among respective variables indicating that environmental factors do not affect plants, which is inconsistent with the results in the “Quantitative Modeling” section of this paper. These responses were possibly caused by the mutual interaction between the independent variables. The multiple stepwise regression analysis revealed altitude as the dominant factor (P = 0.002 < 0.01). The combined correlation and multiple stepwise regression analysis showed that the total flavonoids accumulation was affected by ecological and soil factors, with greater influence from ecological factors. These results were consistent with the Olha and Zou studies on the environmental factors affecting the contents of active constituents in medicinal materials (19, 38).
Conclusion
In this study, the total flavonoids contents in M. integrifolia from 14 different populations was 1.63% to 10.17%. The one-way ANOVA results showed differences in M. integrifolia quality from the different populations.
For the first time, NIR facilitated a quick and accurate analysis of M. integrifolia quality from the different populations. The three factors and three levels of single-factor experiments optimized the quantitative modeling conditions, and the results revealed that the spectra were preprocessed by constant, first derivative, and no smoothing, and the full band modeling range from the PLS method. All the parameters of the model met the prerequisite requirements, and RPD > 3.0 indicated good evaluation performance suitable for rapid quantitative analysis. This model provided a rapid and accurate detection method for the quality control of M. integrifolia medicinal material.
Based on these results, the dominant factor affecting the M. integrifolia quality was altitude. Low altitude was conducive for accumulating compounds, providing a scientific basis for high-quality selections and applications of M. integrifolia medicine.
Funding
This study was supported Qinghai Special Project of Innovation Platform for Basic Conditions of Scientific Research (2020-ZJ-T05), Function Development and Technical Innovation Project of Instrument of Chinese Academy of Sciences (2022gl09), the Development Project of Qinghai Provincial Key Laboratory (2021-ZJ-Y14), and the Transfer and Transformation Project of Scientific and Technological Achievements of Qinghai Province (2022ZY012).
ORCID iD
Duo Li: https://orcid.org/0000-0003-1865-6529
References
(1) China Association of Chinese Medicine, Chinese Herbal Medicine Quality Evaluation Methodology Guidance; China Press of Traditional Chinese Medicine, 2017.
(2) Da, F. F.; Dai, Z. H.; Zhu, H. H. Research Status and Development Trends of Quality Evaluation of Traditional Chinese Medicines. Chin. Arch. Tradit. Chin. Med. 2017, 35, 1485–1488. DOI: 10.13193/j.issn.1673-7717.2017.06.036
(3) Chen, X. Y.; Sun, X. F.; Hua, H. M.; Yi, Y.; Li, H. L.; Chen, C. Quality Evaluation of Decoction Pieces of Rhizoma Atractylodis Macrocephalae by Near Infrared Spectroscopy Coupled with Chemometrics. Spectrochim. Acta A Mol. Biomol. Spectrosc. 2019, 221, 117169. DOI: 10.1016/j.saa.2019.117169
(4) Yin, L. H.; Zhou, J. M.; Chen, D. D.; Han, T. T.; Zheng, B. S.; Younis, A.; Shao, Q. S. A Review of the Application of Near-Infrared Spectroscopy to Rare Traditional Chinese Medicine. Spectrochim. Acta A Mol. Biomol. Spectrosc. 2019, 221, 117208. DOI: 10.1016/j.saa.2019.117208
(5) Sun, S. Q.; Zhou, Q.; Chen, J. B. Analysis of Traditional Chinese Medicine by Infrared Spectroscopy; Chemical Industry Press, 2010.
(6) Yan, H.; Li, P. H.; Zhou, G. S.; Wang, Y. J.; Bao, B. H.; Wu, Q. N.; Huang, S. L. Rapid and Practical Qualitative and Quantitative Evaluation of Non-Fumigated Ginger and Sulfur-Fumigated Ginger via Fourier-Transform Infrared Spectroscopy and Chemometric Methods. Food Chem. 2021, 341, 128241. DOI: 10.1016/j.foodchem.2020.128241
(7) Murugesu, S.; Ahmed , Q. U.; Uzir, B. F.; Yusoff, N. I. N.;Perumal, V.; Ibrahim, Z.; Abas, F.; Saari, K.; Alfi Khatib, A.Rapid investigation of α-glucosidase Inhibitory Activity of Clinacanthus nutans Leaf Using Infrared Fingerprinting. Vib. Spectrosc. 2019, 100, 22–29. DOI: 10.1016/j.vibspec.2018.10.007
(8) Elmi, F.; Movaghar, A. F.; Elmi, M. M.; Alinezhad, H.; Nikbakhsh,N. Application of FT-IR Spectroscopy on Breast Cancer Serum Analysis. Spectrochim. Acta A Mol. Biomol. Spectrosc. 2017, 187, 87–91. DOI: 10.1016/j.saa.2017.06.021
(9) Ni, L. J.; Han, M. Y.; Zhang, L. G.; Luan, S. R.; Li, W.; Deng, H. X.; Lan, Z. H.; Wu, Z. X.; Luo, X. F.; Mleczko, L. Qualitative Analysis of the Roots of Salvia miltiorrhiza and Salvia yunnanensis Based on NIR, UHPLC and LC–MS-MS. J. Pharmaceut. Biomed. 2019, 170, 295–304. DOI: 10.1016/j.jpba.2019.01.010
(10) Wang, Q. Q.; Zuo, Z. T.; Huang, H. Y.; Wang, Y. Z. Comparison and Quantitative Analysis of Wild and Cultivated Macrohyporia cocos Using Attenuated Total Refection-Fourier Transform Infrared Spectroscopy Combined with Ultra-fast Liquid Chromatography. Spectrochim. Acta A Mol. Biomol. Spectrosc. 2020, 226, 117633. DOI: 10.1016/j.saa.2019.117633
(11) Northwest Institute of Plateau Biology, Tibetan Medicine Journal; Qinghai People’s Publishing House, 1991, pp. 466-467.
(12) Li, R.; Ma, X. Y.;Zhang, X. F.; Zhou, D. W.; Wang, H.; Cheng, T. F.; Wang, W. J. Complete Chloroplast Genome of Meconopsis integrifolia (Papaveraceae). Mitochondrial DNA B 2020, 5 (1), 142–144. DOI: 10.1080/23802359.2019.1698353
(13) Zhou, G.; Chen, Y. X.; Liu, S.; Yao, X. C.;Wang, Y. W. In vitro and in vivo Hepatoprotective and Antioxidant Activity of Ethanolic Extract from Meconopsis integrifolia (Maxim.) Franch. J. Ethnopharmacol. 2013, 148 (2), 664–670. DOI: 10.1016/j.jep.2013.05.027
(14) Xiang, H. Y.; Huang, Y. F.; Li, B. C.; Liu, Y. Enrichment and Purification of Total Flavonoids of Meconopsis integrifolia (Maxim.) Franch in Tibetan Herbs with Macroporous Resins. Chin J. Tradit. Chin. Med. Pharm. 2017, 32 (09), 4269–4272.
(15) Huang, Y. F.; Han, Y. T.; Chen, K. L.; Huang, B. S.; Liu, Y. J. Separation and Purification of Four Flavonol Diglucosides from the Flower of Meconopsis integrifolia by High-Speed Counter-Current Chromatography. Sep. Sci. 2015, 38 (23), 4136–4140. DOI: 10.1002/jssc.201500783
(16) Liu, G. Y.; Shao, J.; Peng, X. X.; Guo, M. Study on Purification Technology of Total Flavones of Tibetan Medicine Meconopsis Quintuplinervia Regel by Macroporous Resin. J. Tradit. Chin. Veteran. Med. 2019, 38 (05), 13–18. DOI: 10.13823/j.cnki.jtcvm.2019.05.003
(17) Monschein, M.; Jaindl, K.; Buzimkic,S.; Bucar, F. Content of Phenolic Compounds in Wild Populations of Epilobium angustifolium Growing at Different Altitudes. Pharm. Biol. 2015, 53 (11), 1576–1582. DOI: 10.3109/13880209.2014.993039
(18) L. Geng, L. Master’s dissertation, Universty of Chinese Medicine, Beijing, China, 2018.
(19) Mykhailenko, O.; Gudžinskas, Z.; Kovalyov, V.; Desenko, V.; Ivanauskas, L.; Bezruk, I.; Georgiyants, V. Effect of Ecological Factors on the Accumulation of Phenolic Compounds in Iris Species from Latvia, Lithuania and Ukraine. Phytochem. Anal. 2020, 31 (5), 545–563. DOI: 10.1002/pca.2918
(20) Li, P. P. Master’s dissertation, University of Chinese Academy of Sciences, Beijing, China, 2019.
(21) She, L. P. Master’s dissertation, University of Chinese Academy of Sciences, Beijing, China, 2014.
(22) Song, S. Y.; Kim, C. H.; Im, S. J.; Kim, I. J. Discrimination of Citrus Fruits Using FT-IR Fingerprinting by Quantitative Prediction of Bioactive Compounds. Food Sci. Biotechnol. 2018, 27 (2), 367–374. DOI: 10.1007/s10068-017-0263-3
(23) Sheng, Z. L.; Wan, P. F.; Dong, C. L.; Li, Y. H. Optimization of Total Flavonoids Content Extracted from Flos Populi Using Response Surface Methodology. Ind. Crop and Prod. 2013, 43, 778–786. DOI: 10.1016/j.indcrop.2012.08.020
(24) Wu, C. Y. PhD dissertation, Zhejiang University, Hangzhou, China, 2017.
(25) Shi, J. Y.; Li, W. T.; Zou, X. B.; Zhang, F.; Chen, Y. Multi-Index Rapid Detection of Salmon Quality Based on Near-Infrared Spectroscopy. Spectrosc. Spect. Anal. 2019, 39 (07), 2244–2249 (2019). DOI: 10.3964/j.issn.1000-0593(2019)07-2244-06
(26) Tang, L.; Wang, C. Y.; Long, H.; Li, J.; Chen, G. X.; Zhou, Q. Effects of Environmental Factors on Growth and Effective Component Contents in Dendrobium officinale. J. Chin. Med. Mater. 2019, 42, 251–255. DOI: 10.13863/j.issn1001-4454.2019.02.002
(27) Ke, Y. K.; Dong, H. R. Handbook of Analytical Chemistry-Molecular Spectroscopy; Chemical Industry Press, 2015.
(28) Workman, J.; Weyer, L. Practical Guide and Spectral Atlas for Interpretive Near-Infrared; CRC Press, 2012.
(29) Tan, L. H.; Zhang, D.; Wang, G.; Yu, B.; Zhao, S. P.; Wang, J. W.; Yao, L.; Cao, W. G. Comparative Analyses of Flavonoids Compositions and Antioxidant Activities of Hawk Tea from Six Botanical Origins. Ind. Crop Prod. 2016, 80, 123–130. DOI: 10.1016/j.indcrop.2015.11.035
(30) Hu, T. Master’s dissertation, Shandong University, Jinan, China, 2016.
(31) Goncalves, M.; Paiva, N. T.; Ferra, J. M.; Martins, J.; Carvalho, L. Near Infrared Spectroscopy for Rapid Determination of Solids Content of Amino Resins. J. Near Infrared Spec. 2020, 28, 344–350. DOI: 10.1177/0967033520947824
(32) de Lima, G. G.; Ruiz, H. Z.; Matos, M.; Helm, C. V.; Liz, M. V.; Magalhaes, W. L. E. Prediction of Yerba Mate Caffeine Content Using Near Infrared Spectroscopy. Spectrosc. Lett. 2019, 52, 282–287. DOI: 10.1080/00387010.2019.1622567
(33) Tian, X. Y.; Aheto, J. H.; Bai, J. W.; Dai, C. X.; Ren, Y.; Chang, X. H. Quantitative Analysis and Visualization of Moisture and Anthocyanins Content in Purple Sweet Potato by Vis–NIR Hyperspectral Imaging. J. Food Process. Pres. 2020, 45 (2), 1–16 (2020). DOI: 10.1111/jfpp.15128
(34) Li, P. P.; Luan, Z. J.; Li, D.; Meng, X. P.; Sun, J. A Novel Method to Rapidly Evaluate the Quality of the Traditional Chinese Medicine Gentiana straminea Maxim. Using Near Infrared Spectroscopy Coupled with Chemometrics.Spectrosc. Lett. 2020, 53 (7), 1–11. DOI: 10.1080/00387010.2020.1773858
(35) Leng, T.; Li, F.; Chen, Y.; Tang, L. J.; Xie, J. H.; Yu, Q. Fast Quantification of Total Volatile Basic Nitrogen (TVB-N) Content in Beef and Pork by Near-Infrared Spectroscopy: Comparison of SVR and PLS Model. Meat Sci. 2021, 180 (5), 108559. DOI: 10.1016/j.meatsci.2021.108559
(36) Yan, H.; Pu, Z. J.; Wang, Y. J.; Guo, S.;Wang, T. S.; Li, S. M.; Zhang,Z. Y.; Zhou, G. S.; Zhan, Z. L.; Duan, J. N. Rapid Qualitative Identification and Quantitative Analysis of Flos Mume Based on Fourier Transform Near Infrared Spectroscopy. Spectrochim Acta A Mol Biomol Spectrosc. 2021, 249 (5), 119344. DOI: 10.1016/j.saa.2020.119344
(37) Liu, W.; Liu, J. J.; Yin, D. X.; Zhao, X. W. Influence of Ecological Factors on the Production of Active Substances in the Anti-Cancer Plant Sinopodophyllum hexandrum (Royle) T.S. Ying Plos One 2015, 10 (4), e0122981. DOI: 10.1371/journal.pone.0122981
(38) Zou, S. H.; Chen, Y. R.; Xu, W. F.; He, S. Z.; Wang, B. Grey Correlation Degree Analysis Between Flavonoids Ingredient in Guizhou Miao Medicine Laportea bulbifera and Environmental Factors. Chin. J. Exp. Tradit. Med. Form. 2016, 22 (16), 30–35.


New Near-Infrared Machine Learning Technique Identifies Dangerous Blood for Transfusion Safety
May 6th 2024Researchers in China have developed a cutting-edge machine learning approach that can detect chylous blood in blood intended for transfusion with more than 90% accuracy. This development promises to significantly reduce the risks associated with blood transfusions and improve the efficiency of blood donation centers.


New Probes for NIR Monitoring of Polymer Injection Molding Composition in Real-Time
May 2nd 2024Researchers from Kyoto University and Japan's National Institute of Advanced Industrial Science and Technology have developed innovative probes to monitor the chemical composition of biodegradable polymer blends during injection molding. This breakthrough could lead to improved production efficiency and reduced waste in the polymer industry.


