Resolving Diagonal Peaks in Two-Dimensional and Transient Absorption Spectroscopy Using a New Polarization Scheme
Transient absorption (TA) spectroscopy is a spectroscopic technique routinely used for biological and chemical applications, including kinetics and nanostructure analysis. Because TA spectroscopy generally deploys only two laser pulses, there are limitations on polarization control. Often in TA spectroscopy studies, cross peaks overlap with diagonal peak features, resulting in spectroscopists’ being unable to determine the molecular structure of what is being studied. Professor Martin Zanni, the Meloche-Bascom Professor of Chemistry at the University of Wisconsin-Madison, and his colleagues explored how to resolve diagonal peaks using a polarization scheme that can be implemented in pump-probe beam geometry—not only in two-dimensional infrared (2D-IR) spectroscopy but also in TA spectroscopy. Zanni is the 2022 recipient of the Ellis R. Lippincott Award. This interview is part of an ongoing series of interviews with the winners of awards that are presented at the annual SciX conference, which will be held this year from October 2 through October 7, in the Greater Cincinnati/Northern Kentucky area.
You and your colleagues conducted a 2019 study that helped determine the role of amyloids in cataracts (1). Why is studying amyloids an important problem to solve, and how can 2D-IR spectroscopy contribute to understanding the relationship between amyloid β-sheet secondary structure and cataract lenses?
Understanding the nature of the disease is an important step in developing treatments. Before our 2D-IR imaging studies, it was not known that cataracts contained amyloid fibrils. Amyloid fibrils are a type of structure in which many copies of proteins stack on top of one another to create long fibrils of very stable beta sheets. Amyloid is involved in many diseases, including Alzheimer’s and Type 2 diabetes. Knowing that cataracts also contain amyloid fibrils and that the fibrils are the deposits that scatter light, this information suggests that those are the structures that one should target with therapies. It is especially intriguing that fibrils form so early in one’s life, much before the symptoms of cataracts. It suggests that a therapy that targets amyloids, if applied early in life, might help prevent cataracts later in life.
2D-IR spectroscopy has some unique characteristics that make it well suited for addressing amyloid deposits in vitro and in tissues. 2D-IR signals scale quadratically with the size of secondary structures and so amyloid fibrils, which are very large, create large and sharp signals that are easily identified. There are other identifying markers, including anharmonicities and cross peaks, that are also useful. 2D-IR spectroscopy can be applied to tissues to create hyperspectral images. This cataract report is one of the first examples of 2D-IR applied to tissues, but we expect many more in the future.
Would you explain for our general readers what is meant by cross-peaks and diagonal peaks when using 2D spectroscopy?
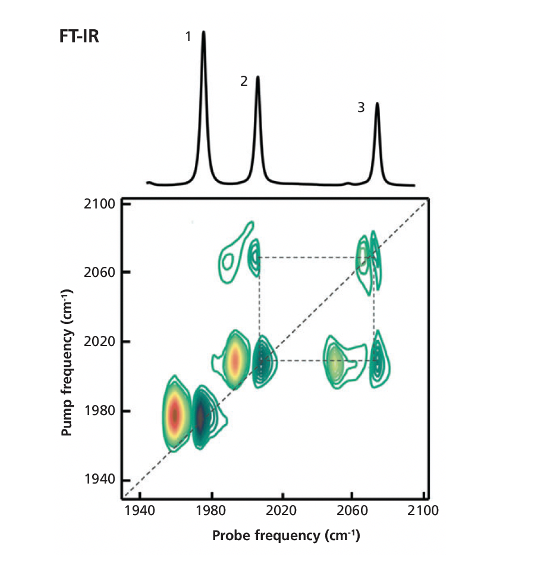
Most spectroscopies produce a peak for each subset of molecules that they are measuring. For example, a spectrum of pentacene has an absorption peak at approximately 600 nm, whereas rubrene is at approximately 550 nm, because they have different conjugated ring systems. In 2D spectroscopy, those absorptions will each create a diagonal peak. For example, if the molecules are electronically coupled to one another because they are touching, then cross peaks will also appear in the spectrum. If the molecules are floating in solution and not interacting, then the cross peaks would be missing. By utilizing various theories or calculations for the coupling, they have enabled the cross peaks to be related to the relative distances and orientations of the molecules or simply the connectivity between molecules or functional groups within a molecule. It can often be difficult to distinguish these two situations, touching or not, with standard absorption spectroscopies. Spectroscopy published an article on 2D spectroscopy back in 2013 (2). Figure 1 from that article shows an example of a 2D-IR spectrum of a solution made from two compounds.

6 and a rhodium dicarbonyl (RDC). For each peak in the FT-IR spectrum, the 2D-IR spectrum exhibits a pair of diagonal peaks. The cross peaks in the 2D-IR spectrum reveal that the two higher frequency peaks are coupled to one another, which is because peaks 2 and 3 are from a rhodium dicarbonyl (RDC) whereas peak 1 is from W(CO)6. W(CO)6 and RDC do not have cross peaks between them because the mixture is too dilute. (Data collected by Tianqi Zhang.)")
Figure 1: Experimental FT-IR and 2D-IR spectra for a mixture of W(CO)6 and a rhodium dicarbonyl (RDC). For each peak in the FT-IR spectrum, the 2D-IR spectrum exhibits a pair of diagonal peaks. The cross peaks in the 2D-IR spectrum reveal that the two higher frequency peaks are coupled to one another, which is because peaks 2 and 3 are from a rhodium dicarbonyl (RDC) whereas peak 1 is from W(CO)6. W(CO)6 and RDC do not have cross peaks between them because the mixture is too dilute. (Data collected by Tianqi Zhang.)
Fast forwarding to your most recent study on pulse polarization (3), how precisely does this polarization scheme enhance signal and reduce spectral congestion for 2D spectroscopy and how is this an improvement over previous applications of 2D spectroscopy?
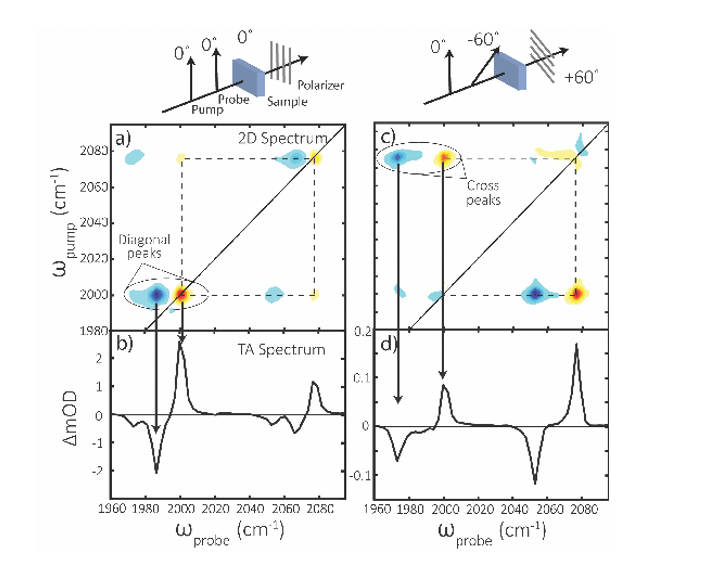
2D-IR spectra were first invented 20 years ago at a time when laser and spectroscopy technology was much less developed than it is now. The technology is 1000 times better now, literally, and both technological and conceptual advances continue to be made. We believe the polarization scheme reported in this PNAS article is an important technological step because it allows the diagonal peaks to be removed from the spectra, leaving the cross peaks, which are what give connectivity (couplings) that are related to structure. Figure 2 below shows data using our technique on a model compound with two carbonyl vibrations. The spectra on the left are a normal 2D-IR spectrum, with pairs of diagonal and cross peaks. The spectra on the right are using our polarization trick, which makes the cross peaks the most intense feature. Also shown are transient absorption spectra (often called pump-probe spectra) using the same polarization. In a normal transient absorption spectra, the features that are equivalent to the cross peaks in the 2D spectra are obscured by the much stronger diagonal features. With the new polarization, the only features in the transient absorption spectra are from the cross peaks. Thus, 2D spectroscopy is not necessarily needed. The cross peaks of 2D spectra can be measure using more standard pump-probe spectroscopy when this polarization experiment is used. It is an idea that could have been implemented 20 years ago but was somehow overlooked until my student Kieran Farrell discovered it.

 Standard 2D-IR spectrum and transient absorption spectrum of a model compound in which both laser pulses (the pump and probe) have the same polarization, as show in the top. Both diagonal and cross peaks are observed. In more interesting compounds, with smaller separations or more modes, the cross peaks are not as easily resolved from the diagonal peaks. (right) The new polarization scheme in which the pump and probe pulses are oriented 60° to one another and a polarizer is added after the sample at -60°. The only features now seen in the 2D-IR and transient absorption spectra are the cross peaks.")
Figure 2: Diagonal peak suppression using a new polarization trick. (left) Standard 2D-IR spectrum and transient absorption spectrum of a model compound in which both laser pulses (the pump and probe) have the same polarization, as show in the top. Both diagonal and cross peaks are observed. In more interesting compounds, with smaller separations or more modes, the cross peaks are not as easily resolved from the diagonal peaks. (right) The new polarization scheme in which the pump and probe pulses are oriented 60° to one another and a polarizer is added after the sample at -60°. The only features now seen in the 2D-IR and transient absorption spectra are the cross peaks.
As mentioned in the literature (2), multidimensional spectroscopy has a significant advantage in that it can observe cross-peaks, but they often overlap with diagonal peak features. What did you do in your study to better resolve cross-peaks that is different from what other researchers have done?
One tricky part about 2D spectroscopy is that the cross peaks are not always well-resolved from the diagonal peaks. They are smaller than the diagonal peaks and so can be obscured if they are close to the diagonal. Several techniques have been developed to better resolve the cross peaks. One of the most successful techniques is using polarizations of the laser pulses. Many people think that absorption spectroscopies involve a single-laser pulse and pump-probe spectroscopies involve a two-laser pulse (a pump and a probe), but molecules need to interact twice with the electric field of each laser pulse. Thus, there are two electric field polarizations in absorption spectroscopy and four in pump-probe spectroscopy. Each field polarization can be set independently with the right kind of spectrometer. 2D spectroscopies are like pump-probe spectroscopy and have four electric field interactions. It turns out that if the absorption of two molecules is not parallel to one another (absorptions have directionality, vectors, such as along the length of conjugated rings in pentacene), then the cross-peak intensities and phases differ from the diagonal peaks. As a result, a spectrometer that has all four electric field polarizations set at different locations will remove the diagonal peaks from the spectra, leaving just the cross peaks that give the structure information that everyone is after.
Your study demonstrated that polarization could expand the capabilities of pump-probe spectroscopy measurements, including TA and 2D spectroscopy. What are your next steps in this work, and which applications would benefit from testing this new polarization scheme?
The elimination of the diagonal peaks from the spectra significantly decongests the spectra, resolving cross peaks that would otherwise be unnoticeable. We are currently using the technique to study amyloid aggregation of a hormone, hIAPP, involved in Type 2 diabetes. We are uncovering features in hIAPP that have been hidden to us for the past 10 years. But its application is also much broader. There are thousands of pump-probe spectrometers on the planet, all of which can be easily modified to do this polarization trick and thereby measure the same cross peaks that was previously relegated to 2D spectroscopy. Hyperspectral microscopy is also an exciting application. By adding a polarizer after the sample in a transient absorption microscope, one only collects the spectra of cross peaks. Thus, images that report on the connectivity of molecules can be measured. In our own research, I do not expect that we will ever again publish a manuscript that does not utilize this polarization trick!
References
- A.M. Alperstein, J.S. Ostrander, T.O. Zhang, and M.T. Zanni, PNAS 116(14), 6602–6607 (2019).
- L. Bush, Spectroscopy 28(7), 24–30 (2013).
- K.M. Farrell, N. Yang, and M.T. Zanni, PNAS 119(6), e2117398119 (2022).


Martin T. Zanni is the Meloche-Bascom Professor of Chemistry at the University of Wisconsin-Madison. He received his PhD from the University of California-Berkeley, working with Dan Neumark, and was an NIH Postdoctoral Fellow at the University of Pennsylvania with Robin Hochstrasser. He is one of the early pioneers of 2D-IR spectroscopy and has made many technological innovations that has broadened the capabilities and scope for a wide range of multidimensional spectroscopies and microscopies. He utilizes these new techniques to study topics in biophysics, chemical physics, photovoltaics, and surfaces. He has received many national and international accolades for his research. Notably, he is the only person to have received the ACS Nobel Laureate Signature Award as both a student and a mentor and the first person to receive both the Craver and the Coblentz Awards. He founded PhaseTech Spectroscopy Inc., which is the first company to commercialize 2D-IR and 2D Electronic spectroscopies. Direct correspondence to: zanni@chem.wisc.edu