Technological Analysis of Glazed Tiles Unearthed from Bao’ensi in Nanjing
To understand the firing technology and the level of production of glazed tiles in the Ming Dynasty, an ultraviolet-visible-near-infrared (UV-Vis-NIR) spectrophotometer and an energy-dispersive X-ray fluorescence (XRF) spectrometer were used to systematically analyze the glaze color and chemical composition of glazed tiles unearthed from the southern area of the Bao’ensi site. The results revealed that little difference exists in the main wavelengths of the same glazed tile samples, but that the colored elements of glaze with different colors are different. Iron (Fe) is the main element that affects the color of yellow glaze; copper (Cu) is the main element that affects the color of green glaze; and the main colorants that affect the color of black glaze are Fe, Cu, and manganese (Mn). The yellow and black glaze unearthed from the southern area of the Bao’ensi site were relatively mature in terms of raw material composition and technological formula, whereas the raw material and technological formula of green glaze were not stable enough. To meet temple construction needs, workers were skilled in firing glazed tiles with different glaze color requirements, indicating that the glaze color of the glazed tiles was relatively mature at that time.
Architectural glazed tile, a type of low-temperature lead-glazed pottery, is a common building material used in traditional Chinese architecture with good decorative and waterproof functions. The process of fabricating glass components in Chinese architecture has a long history. The earliest historical records can be found in the Book of Wei, compiled by the Wei Dynasty during the Northern Qi Dynasty. Since that time, with the development of glazed-tile firing technology, many fine architectural glass components have been developed.
In recent years, ample research of the manufacturing technology of ancient glazed tile in China has been conducted (1–3). The study of ancient glazed tile in Nanjing and Beijing has been a particular area of focus, given that Nanjing and Beijing were the capital cities of the Ming and Qing Dynasties, respectively. The ancient glazed tile has been examined for the chemical composition of yellow glaze, the mechanism of peeling glaze, and the degradation of green glaze (4–7). The Ming Dynasty was a key stage in the transition from the mature period of the Song and Yuan Dynasties to the heyday of Ming and Qing Dynasties on the basis of inheriting the technology of the Song and Yuan Dynasties. Glazed-tile firing technology during this period developed a variety of glaze colors, such as yellow, green, red, purple, blue, black, and white, which met the needs of all types of buildings and laid a foundation for the appearance of glazed tiles in the Ming and Qing Dynasties’ official buildings. However, there is relatively little research on the technology of glaze making at this stage, and even less research on the world-famous buildings of the Ming Dynasty, such as the great Bao’ensi site and the Ming Palace. Yinzhong and others studied the chemical composition of glazes, the melting temperature range of yellow glazes, and the matching of the thermal expansion coefficients of tire glazes of six architectural glazed components unearthed from the northern part of the Bao’ensi site in Nanjing (8).
In the Ming Dynasty, the Nanjing Bao’ensi was built in the tenth year of Yongle (AD 1412). Its temple was built in accordance with the standards of the imperial palace, and it was resplendent and magnificent in scale (9). From its completion to its decay, the pagoda has always been the highest building in China. It ranked among the Seven Wonders of the World in the Middle Ages, and it was regarded by Westerners as a landmark building representing China (9). The Ming Dynasty Bao’ensi site is generally divided into two areas: the south and the north. To cooperate with the construction of the “Bao’ensi Temple Site Park,” the Nanjing Institute of Archaeology conducted a comprehensive and systematic archaeological excavation in the northern area from 2007 to 2010 and the southern area in 2017.
Glazed tiles unearthed from this site represent the highest level of technology of glazed tile-making in the Ming Dynasty. For the purposes of studying the firing technology and production level of glazed tiles in the Ming Dynasty, 31 colored glaze samples were selected at the southern district and excavated archaeologically in the gratitude temple site, using an ultraviolet-visible-near-infrared (UV-Vis-NIR) spectrophotometer and energy-dispersive X-ray fluorescence (XRF) spectrometer. The glaze color and chemical composition of glazed tile unearthed from the great gratitude temple were measured, and the results were analyzed by using a multivariate statistical analysis method.
Experimental Samples and Methods
Experimental Sample
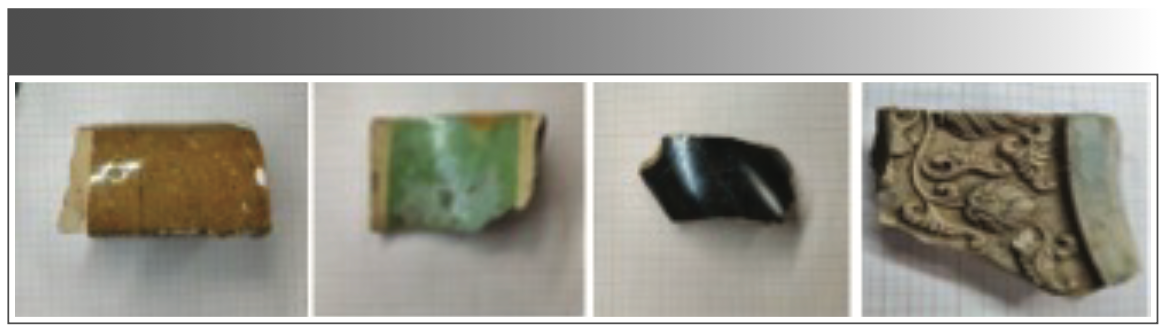
A total of 31 samples were selected from the southern area of the Bao’ensi site, including bobbin and slab tiles. Some samples were well preserved, with yellow, black, green, and peeling glazes. The body color was mainly gray and white with delicate quality. The samples are shown in Figure 1.


FIGURE 1: Images of several glazed tile examples from Bao’ensi in Nanjing.
Experimental Method
For chromaticity analysis, a UV-Vis-NIR spectrometer was used to measure the reflection spectrum of the sample, with a 10° field of view during the spectral range of 380–800 nm and a slit width of 5 nm.
A D65 light source was used for testing, and daylight illumination with a color temperature of 6500 K was simulated.
The energy-dispersive XRF (EDXRF) experiments were carried out at the Laboratory of Science and Technology Archaeology at Peking University. An XGT-7000 X-ray fluorescence microscope was used for the experiments. The diameter of the X-ray incident spot was 1.2 mm, the voltage of the X-ray tube was 30 kV, the current of the tube was 0.029 mA, and the data acquisition time was 120 s.
Experimental Results and Discussion
Chromaticity Analysis of Glazed Tiles of Bao’ensi Site
Glaze color is an important expression of glazed tile appearance, and the brightness, saturation, and other related information on glaze color also reflects the level of glazed-tile firing technology. Human eyes have limitations in color discrimination, whereas a UV-Vis-NIR spectrometer is used to measure the reflection spectrum of glaze, and can distinguish the differences and changes in glaze color. To express the glaze color of glazed tiles scientifically and objectively, a color test of the glazed tiles of Bao’ensi was carried out.
The main wavelength of the glaze color corresponds to the peak of the reflectivity curve. Color saturation and brightness are important optical properties of glazes. The main wavelength determines the hue of the glaze, whereas the saturation depends on the selectivity of the glaze to light reflection, and brightness depends on the relative lightness of the glaze (10). The reflectivity of glaze is one of the factors influencing glaze gloss, which affects the specular reflection ability of glaze to visible light. When the reflectivity is high, light is mainly reflected by the mirror, and the glossiness is good. When the reflectivity is low, light is given priority over diffuse reflection, and the glossiness is poor. L* represents brightness or lightness; the larger the value, the lighter the color. The a* represents the red and green phase axes, with positive and negative directions indicated in red and green, respectively; the b* represents the yellow and blue phase axes, with positive direction indicated in yellow and negative direction indicated in blue. The c* represents the chroma, purity, or saturation; the higher the value, the higher the spectral color content; finally, the h* represents the tone angle value (11). The CIE L*a*b* color space values of the green, yellow, and black glaze colors of the glazed tiles of Bao’ensi that were tested and analyzed are shown in Table I.


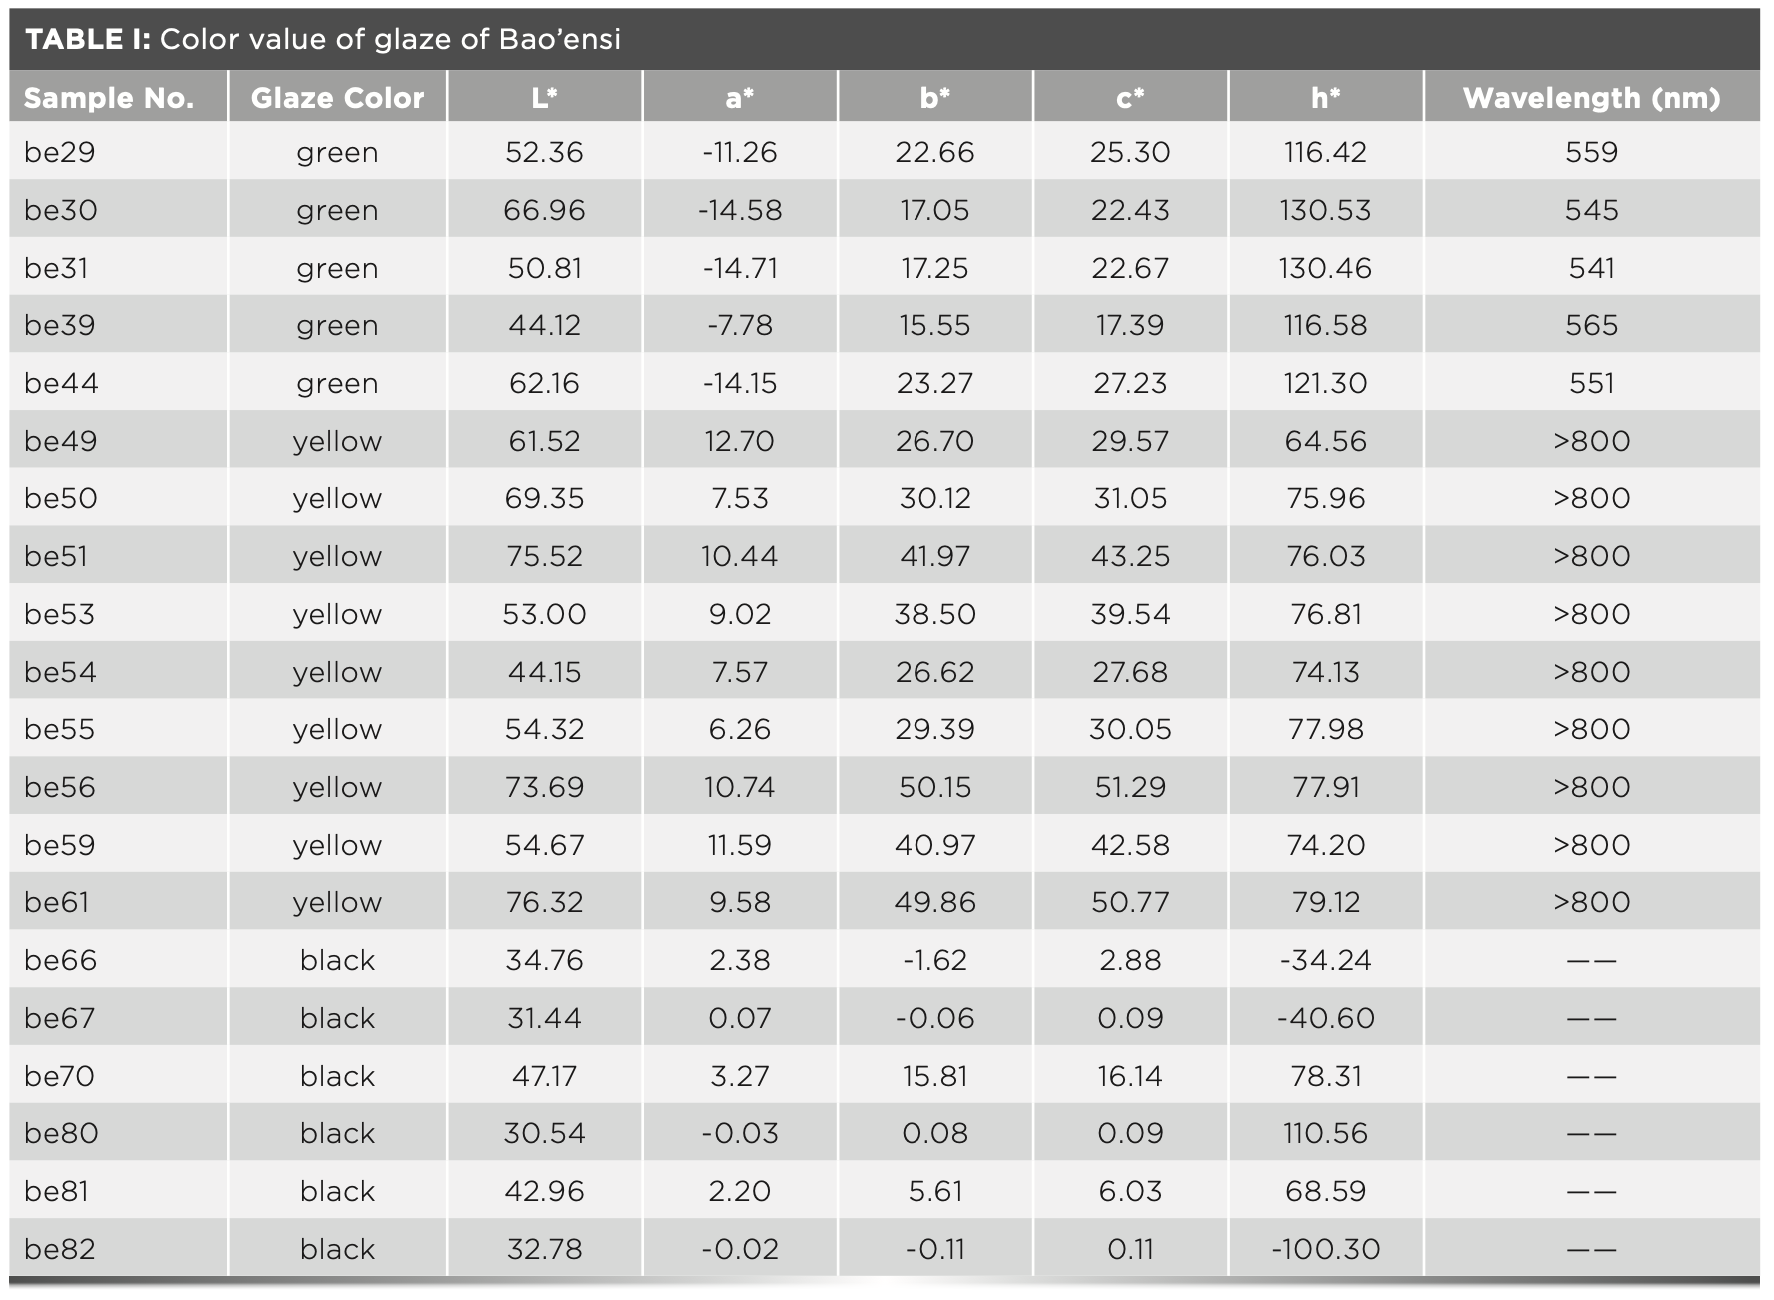
Comparing the spectral curves of the yellow and green glaze from Figure 2, the main wavelength of the yellow glaze is greater than 800 nm and is located in the NIR region, while the spectral curve rises gently in the shortwave region (12). The wavelength of the green glaze is approximately 540–570 nm, rising sharply in the shortwave within the wavelength range of green light, and the reflection peak is narrow. Black glaze has low reflectivity and no main wavelength.


FIGURE 2: The Vis-NIR reflection spectral curve of glazed tiles of Bao’ensi.
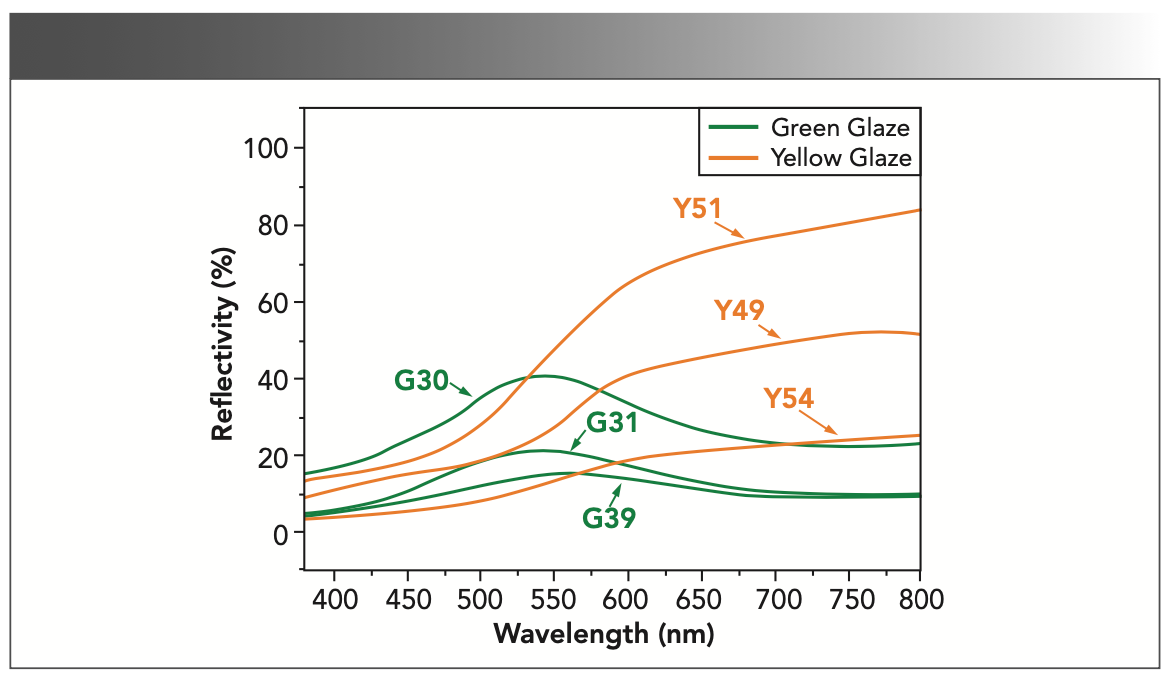
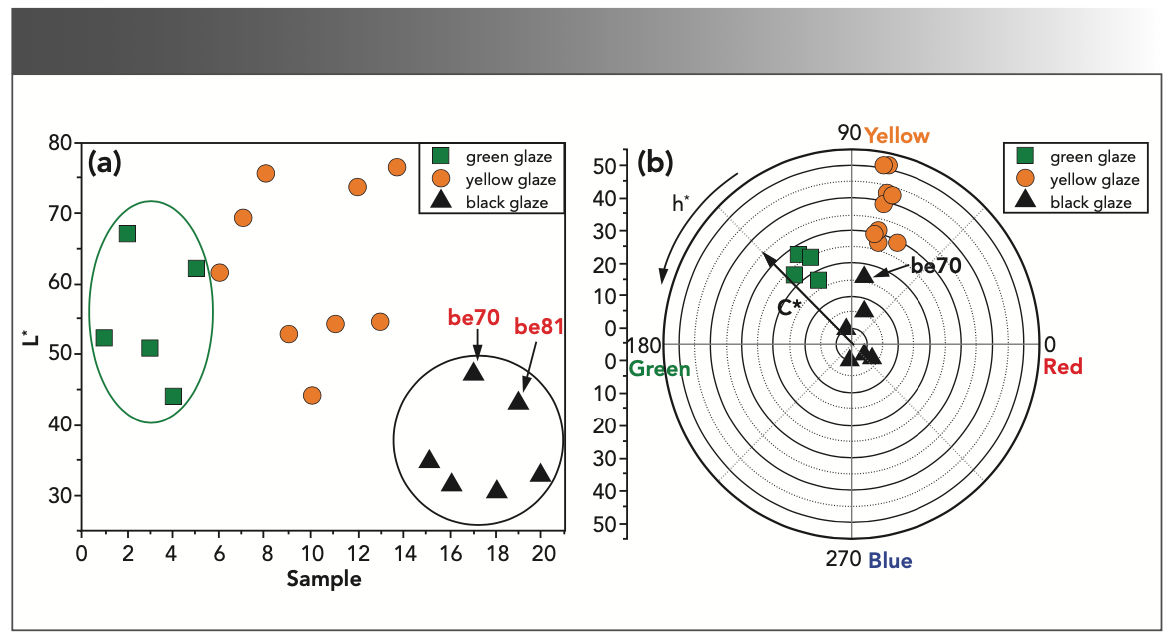
Table I and Figure 3 show the chromaticity values of the samples, and the corresponding scatter plots of L*, c*, and h*. In Figure 3a, the L* value of the green glaze is between 40 and 70. In Figure 3b, the glaze color of the sample is distributed in the yellow–green region, close to the yellow axis, and there is little difference between the hue angle h* and saturation c*. The L* value of yellow glaze is approximately between 40 and 80, and there are samples with similar brightness of glaze color. The glaze color is close to the yellow axis, hue angle h* is not the same, glaze saturation c* is quite different, and some samples are on the high side while others are on the low side. However, there are also samples with the same glaze saturation, among the three glaze colors, with the yellow glaze having the highest saturation. The black glaze L* value (Figure 3a, y-axis) was between 30 to 50. There are two black samples of higher lightness (L*) than other black samples (be70, be81). Note in Figure 3b, that the black sample with higher brightness (be70) also has higher saturation.

 Scatter plot of L* of sample glaze; (b) Scatter plot of c* and h* of sample glaze.")
FIGURE 3: (a) Scatter plot of L* of sample glaze; (b) Scatter plot of c* and h* of sample glaze.
The chromaticity analysis of glazed tiles at the Bao’ensi site shows that the wavelengths of glazed tile and the samples of the same glazed color were not different. The brightness and saturation of the glazed color samples were high or low, which may be because of the different application positions of the buildings. Therefore, glazed tiles with different glaze color requirements are needed. It can be inferred that in order to meet the needs of the construction of the temple, the workers were skilled in firing glazed tiles with different glaze color requirements, indicating that the glaze color of glazed tiles used was well-established (mature).
Chemical Composition Analysis of Glazed Tile Layer in Bao’ensi Site
EDXRF was used to determine the chemical composition of Al2O3, SiO2, K2O, CaO, TiO2, MnO, Fe2O3, CuO, and PbO in the sample glaze. The partial test results are shown in Table II.


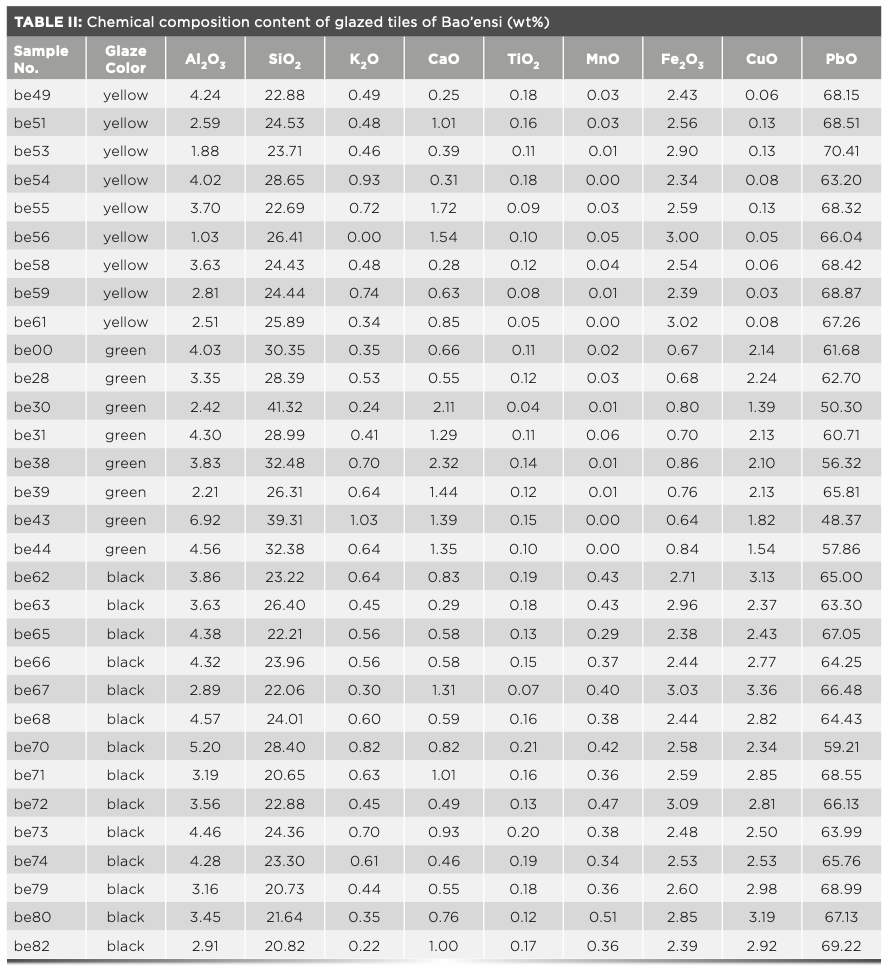
The main components of the glazed tile glaze in the Nanjing Bao’ensi were PbO, SiO2, K2O, and CaO, and the main coloring elements were Ti, Mn, Fe, and Cu. Al2O3 in glazes can combine with SiO2 and alkaline oxide to prevent glaze cracking.
Dispersion Analysis of EDXRF Data
To reveal the characteristics and differences in the chemical composition of the glazed tiles at the Bao’ensi site, a distribution analysis of the chemical composition of the experimental results was carried out. Using the content of the chemical components of one element as the abscissa and the content of the chemical components of another element as the ordinate, a two-dimensional (2D) dispersion analysis diagram can be constructed.
Figure 4a shows that the yellow glaze sample has a high content of Fe2O3, indicating that Fe is the main element affecting the color of the yellow glaze. The Fe2O3 content in most of the green glaze sample was low, but the CuO content was high, and the Fe2O3 content in a few samples (be37, be29) was high. Clearly, Cu is the main element affecting the color of the green glaze. The contents of Fe2O3 and CuO in the black glaze samples were relatively high, so Fe and Cu jointly affect the color of the black glaze. According to the content of Fe2O3 in Figure 4a, the glaze of the Bao’ensi glazed tile can be divided into two parts: one is green glaze, in which the content of Fe2O3 is less than 1%, and the other is yellow glaze and black glaze, in which the content of Fe2O3 is more than 2%. Therefore, it can also be shown that Fe is the coloring element of yellow, black, and green glaze. However, there are certain differences in the chemical composition of the three, which may indicate that the color of the glaze is related to the coloring elements and their content.

 is the dispersion analysis figure of CuO-Fe2O3, (b) is the dispersion analysis figure of MnO-TiO2, and (c) is the dispersion analysis figure of SiO2-PbO.")
FIGURE 4: Distribution analysis diagram of glazed tile glaze of Bao’ensi: (a) is the dispersion analysis figure of CuO-Fe2O3, (b) is the dispersion analysis figure of MnO-TiO2, and (c) is the dispersion analysis figure of SiO2-PbO.
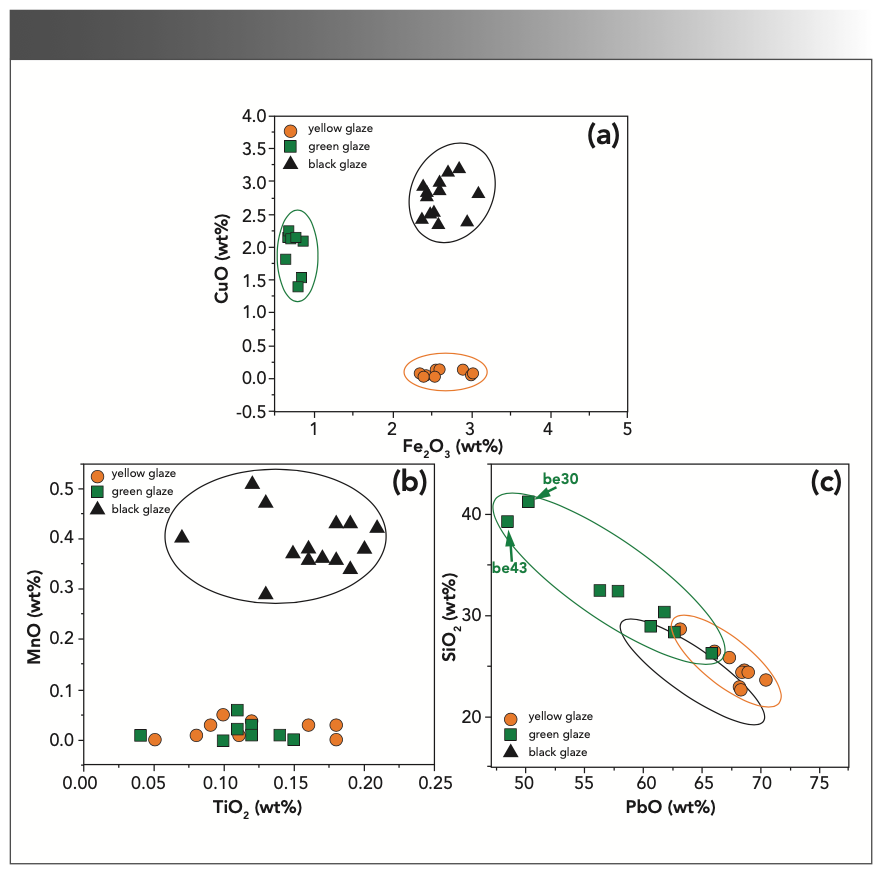
In Figure 4b, the MnO content of the black glaze sample is relatively high. Based on the analysis of the Fe2O3 and CuO contents of the black glaze sample in Figure 3a, the main colorants that affect the color of the black glaze are Fe, Cu, and Mn.
In Figure 4c, the PbO content in the green, yellow, and black glaze increases gradually with a decrease in the SiO2 content, and there is a negative correlation overall. SiO2 can improve the melting temperature and viscosity of the glaze; provide a glaze with high mechanical properties (such as hardness and wear resistance); improve the whiteness, transparency, and chemical stability; and reduce the thermal expansion coefficient of the glaze. As a flux, PbO can reduce the thermal expansion coefficient of the glaze, improve the thermal stability, and reduce the melt viscosity, such that the glaze has good fluidity. This can increase the melting temperature range of the glaze, improve the glaze elasticity and gloss, and increase the tensile strength. PbO has the strongest flux and can easily react with SiO2 to form lead silicate with a low melting point. Owing to the high refractive index of lead silicate, it can form a high-gloss glaze (13).
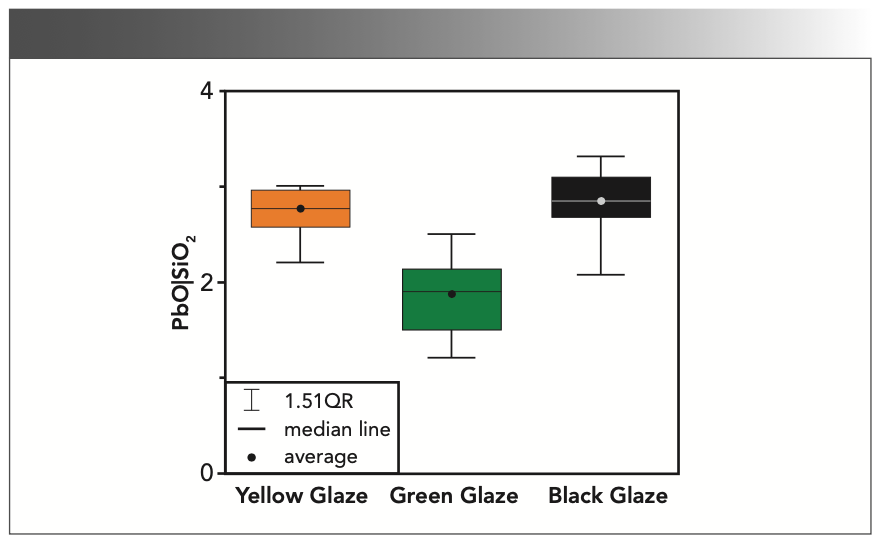
In Figure 4c, the ratio of PbO to SiO2 is 2.15:1 for the green glaze, 2.72:1 for the yellow glaze, and 2.81:1 for the black glaze. In Figure 4c, the ratio (5,9) of PbO to SiO2 in the yellow-glazed tile is slightly higher than that in the Ming glazed tile of the Beijing Imperial Palace; there are also differences in chemical composition, which may be related to the glaze materials used and the production system at that time (5,9).
The Song Dynasty work (14) by Li Jie “Ying Zao Fa Shi (State Building Standards)” has a detailed record. It was also recorded during the Wanli period of the Ming Dynasty: “306 Jin of Huangdan, 102 Jin of Maya stone, 8 Jin of ochre” (15). Huangdan is rich in lead, whereas Luohe stone and Maya stone are rich in silicon. The ratio of Huangdan (PbO) to Luohe stone:Maya stone (SiO2) in the two books is approximately 3:1, indicating that the glaze formula from the Song dynasty to the Ming Dynasty tended to be stable (16).
In Figure 5, the ratio of PbO and SiO2 of the yellow glaze with the highest grade of glazed tiles in the Bao’ensi site is relatively close. However, it is similar to that recorded in “Ying Zao Fa Shi” and “Gong Bu Chang Ku Xu Zhi.” The 3:1 ratio is somewhat different, which is the main reason for this phenomenon (5). On the one hand, as the initial formula recorded in the literature, Pb volatilizes to a certain extent in the actual firing process, resulting in a decrease in the content of PbO in the ingredients, so that the ratio cannot reach 3:1. On the other hand, as the glazed tiles of the Bao’ensi site had been buried underground for a long time, the Pb content would be continuously dissolved owing to the humidity and abundance of bacteria and microorganisms, resulting in a decrease in Pb content.


FIGURE 5: Lead:silicon ratio of the three glazes.
The comprehensive analysis shows that the firing technology of glazed tiles at the Bao’ensi site has matured, and artisans can flexibly make glazed tiles of different glaze colors by adjusting the proportion of raw materials and adding appropriate flux to meet the needs of the Bao’ensi site buildings.
Factor Analysis of EDXRF Data
Factor analysis is a statistical technique used in the analysis of EDXRF data for tile analysis. It allows for the identification of underlying factors (components) that contribute to the observed variations in the elemental composition of the glazed tiles. By analyzing the covariance matrix of the EDXRF data, factor analysis can extract the common sources of variation and determine the relationships between the measured elements in the different glaze types (17).
To directly observe whether there is any difference in the chemical composition of glazes of different colors, 31 samples from Bao’ensi site were analyzed using the factor analysis method.
Figure 6 shows the load diagram of the yellow glaze, green glaze, and black glaze of the Bao’ensi site. The seven colored elements were selected, such as Al2O3, SiO2, PbO, TiO2, MnO, Fe2O3, and CuO. The primary and secondary quantitative element composition factors extracts two factors, F1 and F2, with a cumulative contribution rate of 77%, as shown in equations [1] and [2].

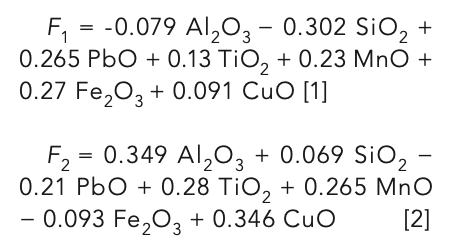


FIGURE 6: The factor analysis diagram of glaze.
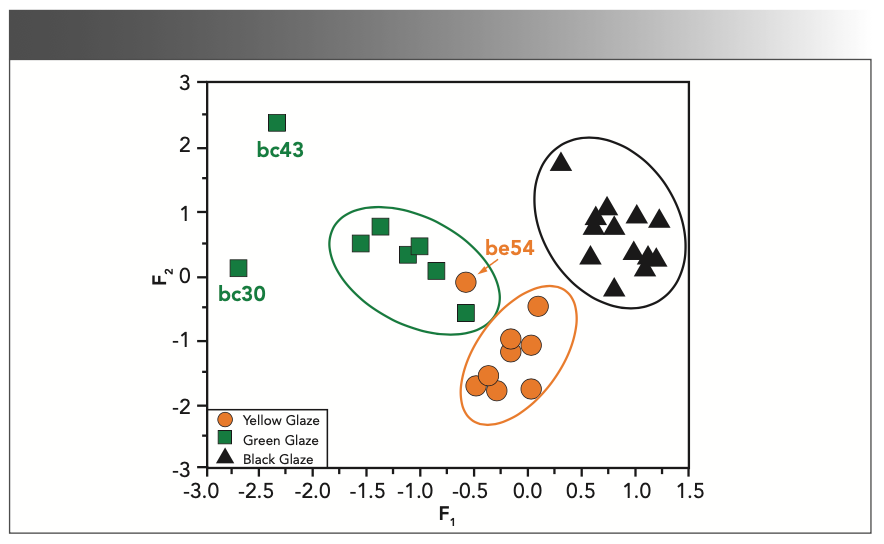
As can be seen from the factor analysis diagram, the distribution of most data points of the green, black, and yellow glazes was concentrated and separated from each other, indicating that the glaze formulas of the three glazes were significantly different according to the coloring elements. In terms of the dispersion of data points, the yellow and black glaze were relatively stable in terms of raw material composition and process formula, whereas the data points of the green glaze were relatively dispersed, indicating that the glaze formula may be different.
The be54 sample in the yellow glaze has a distant relationship with other yellow glaze samples, but it is close to the green glaze samples. According to EDXRF and Figure 4a, it can be found that not only are the contents of Fe, Cu, and other elements in be54 glaze not very different from those of other yellow glazes, but that the contents of PbO are lower than those of other yellow glazes. It was also observed that the contents of SiO2 were higher than those of other yellow glazes. The sum of the SiO2 and PbO contents in the glaze accounted for more than 90% of the glaze formula. It was speculated that the be54 yellow glaze sample may have been caused by a lack of strict formula control.
The be30 and be43 samples in the green glaze are far from the other green glaze samples. According to EDXRF and Figure 4c, it can be found that the PbO content of be30 and be43 samples is low, and the SiO2 content was high, but the total was over 90%. Therefore, it was inferred that glaze color modulation technology has been relatively mature to meet the different requirements of glazed tiles.
Conclusion
The chroma and chemical composition of the glazed tile glaze of the Bao’ensi site were analyzed, and the following conclusions were drawn:
The firing technology of glazed tiles in the great Bao’ensi is relatively mature, and craftsmen could already skillfully fire glazed tiles with different glaze color requirements according to their needs. There are no differences in the main components and flux content of various glaze formulations. Different glaze colors are caused by different types and contents of coloring elements. Cu and Fe are the main elements that affect the color of yellow glaze, Cu is the main element that affects the color of green glaze, and the main coloring elements that affect the color of black glaze are Fe, Cu, and Mn. Yellow and black glaze are relatively mature in terms of raw material composition and process formula, whereas green glaze is not stable enough in terms of raw materials and process. The glaze formulations of the green glaze of the great Bao’ensi have both similarities and certain differences, indicating that the glazed tiles of the great Bao’ensi may have come from the same kiln, using different glaze formulations, or they may have been the result of later repairs.
Acknowledgments
This work was supported by National Natural Science Foundation of China (11975210), and the National Social Science Fund of China (17CKG016).
References
(1) Jiang, W. Y.; Liu, Y. L.; Sun, W. On the application of glazed tiles in Forbidden City buildings. Shanxi Architecture 2014, 40 (5), 231–232.
(2) Li, Q. Q.; Liu, J. Y. Glaze Technology of Chinese Ancient Architecture; China Architecture & Building Press, 1987.
(3) Yang, G.; Gao, S.; Wang, R. Z.; et al. The glaze color of ancient Chinese architecture. Studies in the History of Natural Sciences 1985, 4 (1), 54–58.
(4) Kang, B. Q.; Li, H.; Miao, J. M. Research on the composition and related problems of the glazed tile glaze of the Imperial Palace in Qing Dynasty. Cultural Relics in Southern China 2013, 2, 67–71.
(5) Li, H.; Ding, Y. Z.; Chen, T. M.; Miao, J. M. An Analysis on the Yellow Lead-glaze of Architectural Tiles of the Ming and Qing Dynasty in Beijing. China Cultural Heritage Scientific Research 2013, 2, 79–84.
(6) Miao, J.M.; Wang, S.W., Duan, H.Y.; et al. Research on the Elements in the Vitreous Glazed Components Used in Ancient Chinese Buildings. Palace Museum Journal 2008, 5, 115–129.
(7) Duan, H. Y.; Miao, J. M.; Li, Y.; Kang, B. Q.; Li, H. Research on Diseases & Damages to Green-Glazed Tiles on Chinese Traditional Architecture. Palace Museum Journal 2013, 2, 114–124.
(8) Ding, Y. Z.; Li, H.; Duan, H. Y.; et al. Science and technology research on glazed tiles of Bao’ensi Pagoda in Nanjing. Cultural Relics in Southern China 2013, 2, 81–84.
(9) Leng, M. Analysis on the glaze pagoda of the Temple of Bao’ensi in Ming Dynasty. Identification and Appreciation to Cultural Relics 2016, 12, 56–57.
(10) Chi, Z. X. Ceramic Glaze Pigment and Decoration; China Building Materials Press, 2015.
(11) Wang, C. W.; Zhao, W. J.; Wu, B.; Zhang, B. Scientific study on the celadon glaze from the Donggou kiln, China. Nucl. Instrum. Methods Phys. Res., Sect. B 2021, 504, 1–5.
(12) Li, Y.; Zhang, B.; Cheng, H. S.; Zheng, J. M. Revealing the coloration mechanism in the earliest Chinese celadon glaze. J. Eur. Ceram. Soc. 2019, 39 (4), 1675–1682.
(13) Li, J. J. Ceramic Technology; China Light Industry Press, 2001.
(14) Li, J. Ying Zao Fa Shi Volume 27; The Commercial Press, 1933.
(15) He, S. J. Gong Bu Chang Ku Xu Zhi; Bibliographic Literature Publishing House, 2000.
(16) Hou, J. Y.; Li, H.; Kang, B. Q.; et al. The origins of imperial yellow glazed porcelain in the Ming Dynasty (1,368 to 1,644) China: Technical comparison to low-fired tile with yellow glaze. Archaeometry 2021, 64, 59–70.
(17) Xue, W. SPSS Statistical Analysis Method and Application; Publishing House of Electronics Industry, 2013.
Dan Zhao, Bo Wu, Bo Li, and Weijuan Zhao are with the School of Physics and Microelectronics at Zhengzhou University, in Zhengzhou, China. Baohua Zhou is with the Nanjing Research Institute of Archaeology, in Nanjing, China. Jianfeng Cui is with the School of Archaecology and Museology at Peking University, in Beijing, China. Qinlong Chen is with the School of History, Zhengzhou University, Zhengzhou, China. Direct correspondence to: zwj@zzu.edu.cn (Weijjuan Zhao) or 12087725@qq.com (Qinlong Chen). ●


 thwart the host immune response. Coronavirus structure. | Image Credit: © Design Cells - stock.adobe.com.")


Measurement of Ammonia Leakage by TDLAS in Mid-Infrared Combined with an EMD-SG Filter Method
April 9th 2024In this article, tunable diode laser absorption spectroscopy (TDLAS) is used to measure ammonia leakage, where a new denoising method combining empirical mode decomposition with the Savitzky-Golay smoothing algorithm (EMD-SG) is proposed to improve the signal-to-noise ratio (SNR) of absorbance signals.


