The Infrared Spectra of Polymers II: Polyethylene
In our second installment of the infrared (IR) spectra of polymers, we finish the discussion of the spectrum of polyethylene (PE) started last time. We explore how different PE syntheses produce materials with different physical and spectroscopic properties, which introduces us to the concept of crystalline splitting and the rest of the story on CH2 rocking peaks.
In the last installment (1), I showed that the spectra of functional groups in polymers are similar to those of functional groups in small molecules, which means that our analysis of polymer spectra provides us a great opportunity to review the spectra of the functional groups we have covered over the last several years.
It is important to recall from an early installment in this series that hydrocarbons are molecules that contain hydrogen and carbon only (2), thus hydrocarbon polymers are large molecules that contain hydrogen and carbon only. The simplest hydrocarbons are alkanes, which contain CH3 (methyl) and CH2 (methylene units) (2). However, this does not mean that alkanes and alkane polymers comprise a small family of molecules. In fact, the extended hydrocarbon family is a large one.
The spectra of alkanes are dominated by the C-H stretching and bending peaks from the methyl and methylene groups. Table I lists the group wavenumber peak position ranges for CH3 and CH2 stretching vibrations.

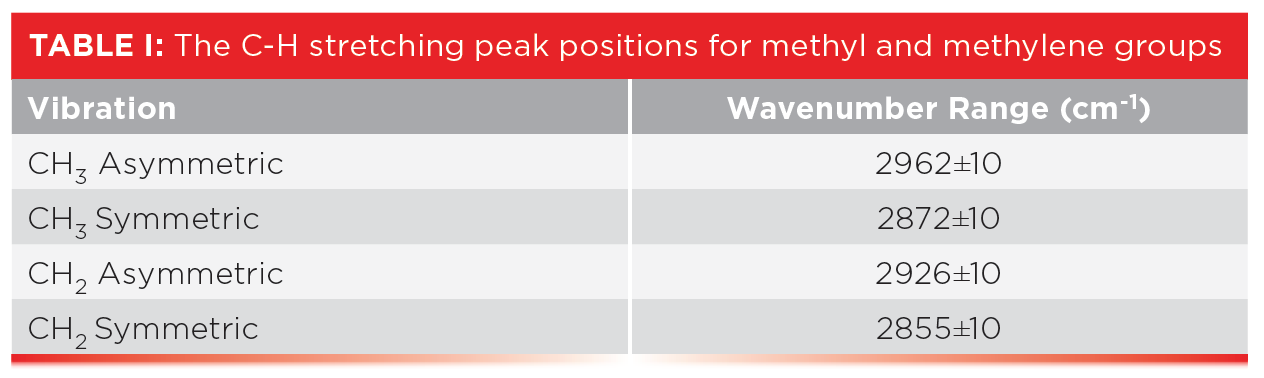


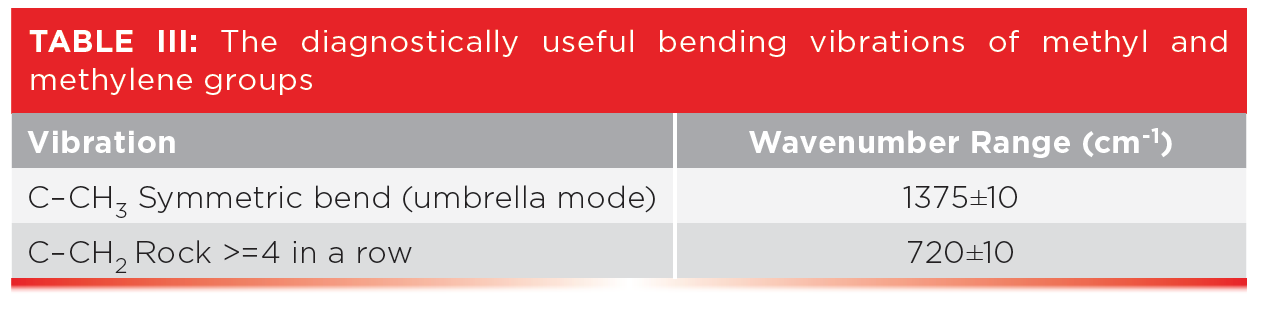
Table III shows the peak positions for two useful alkane bending vibrations, the CH3 umbrella mode and the CH2 rock.


High-Density Polyethylene (HDPE), Low-Density Polyethylene (LDPE), and Crystalline Splitting
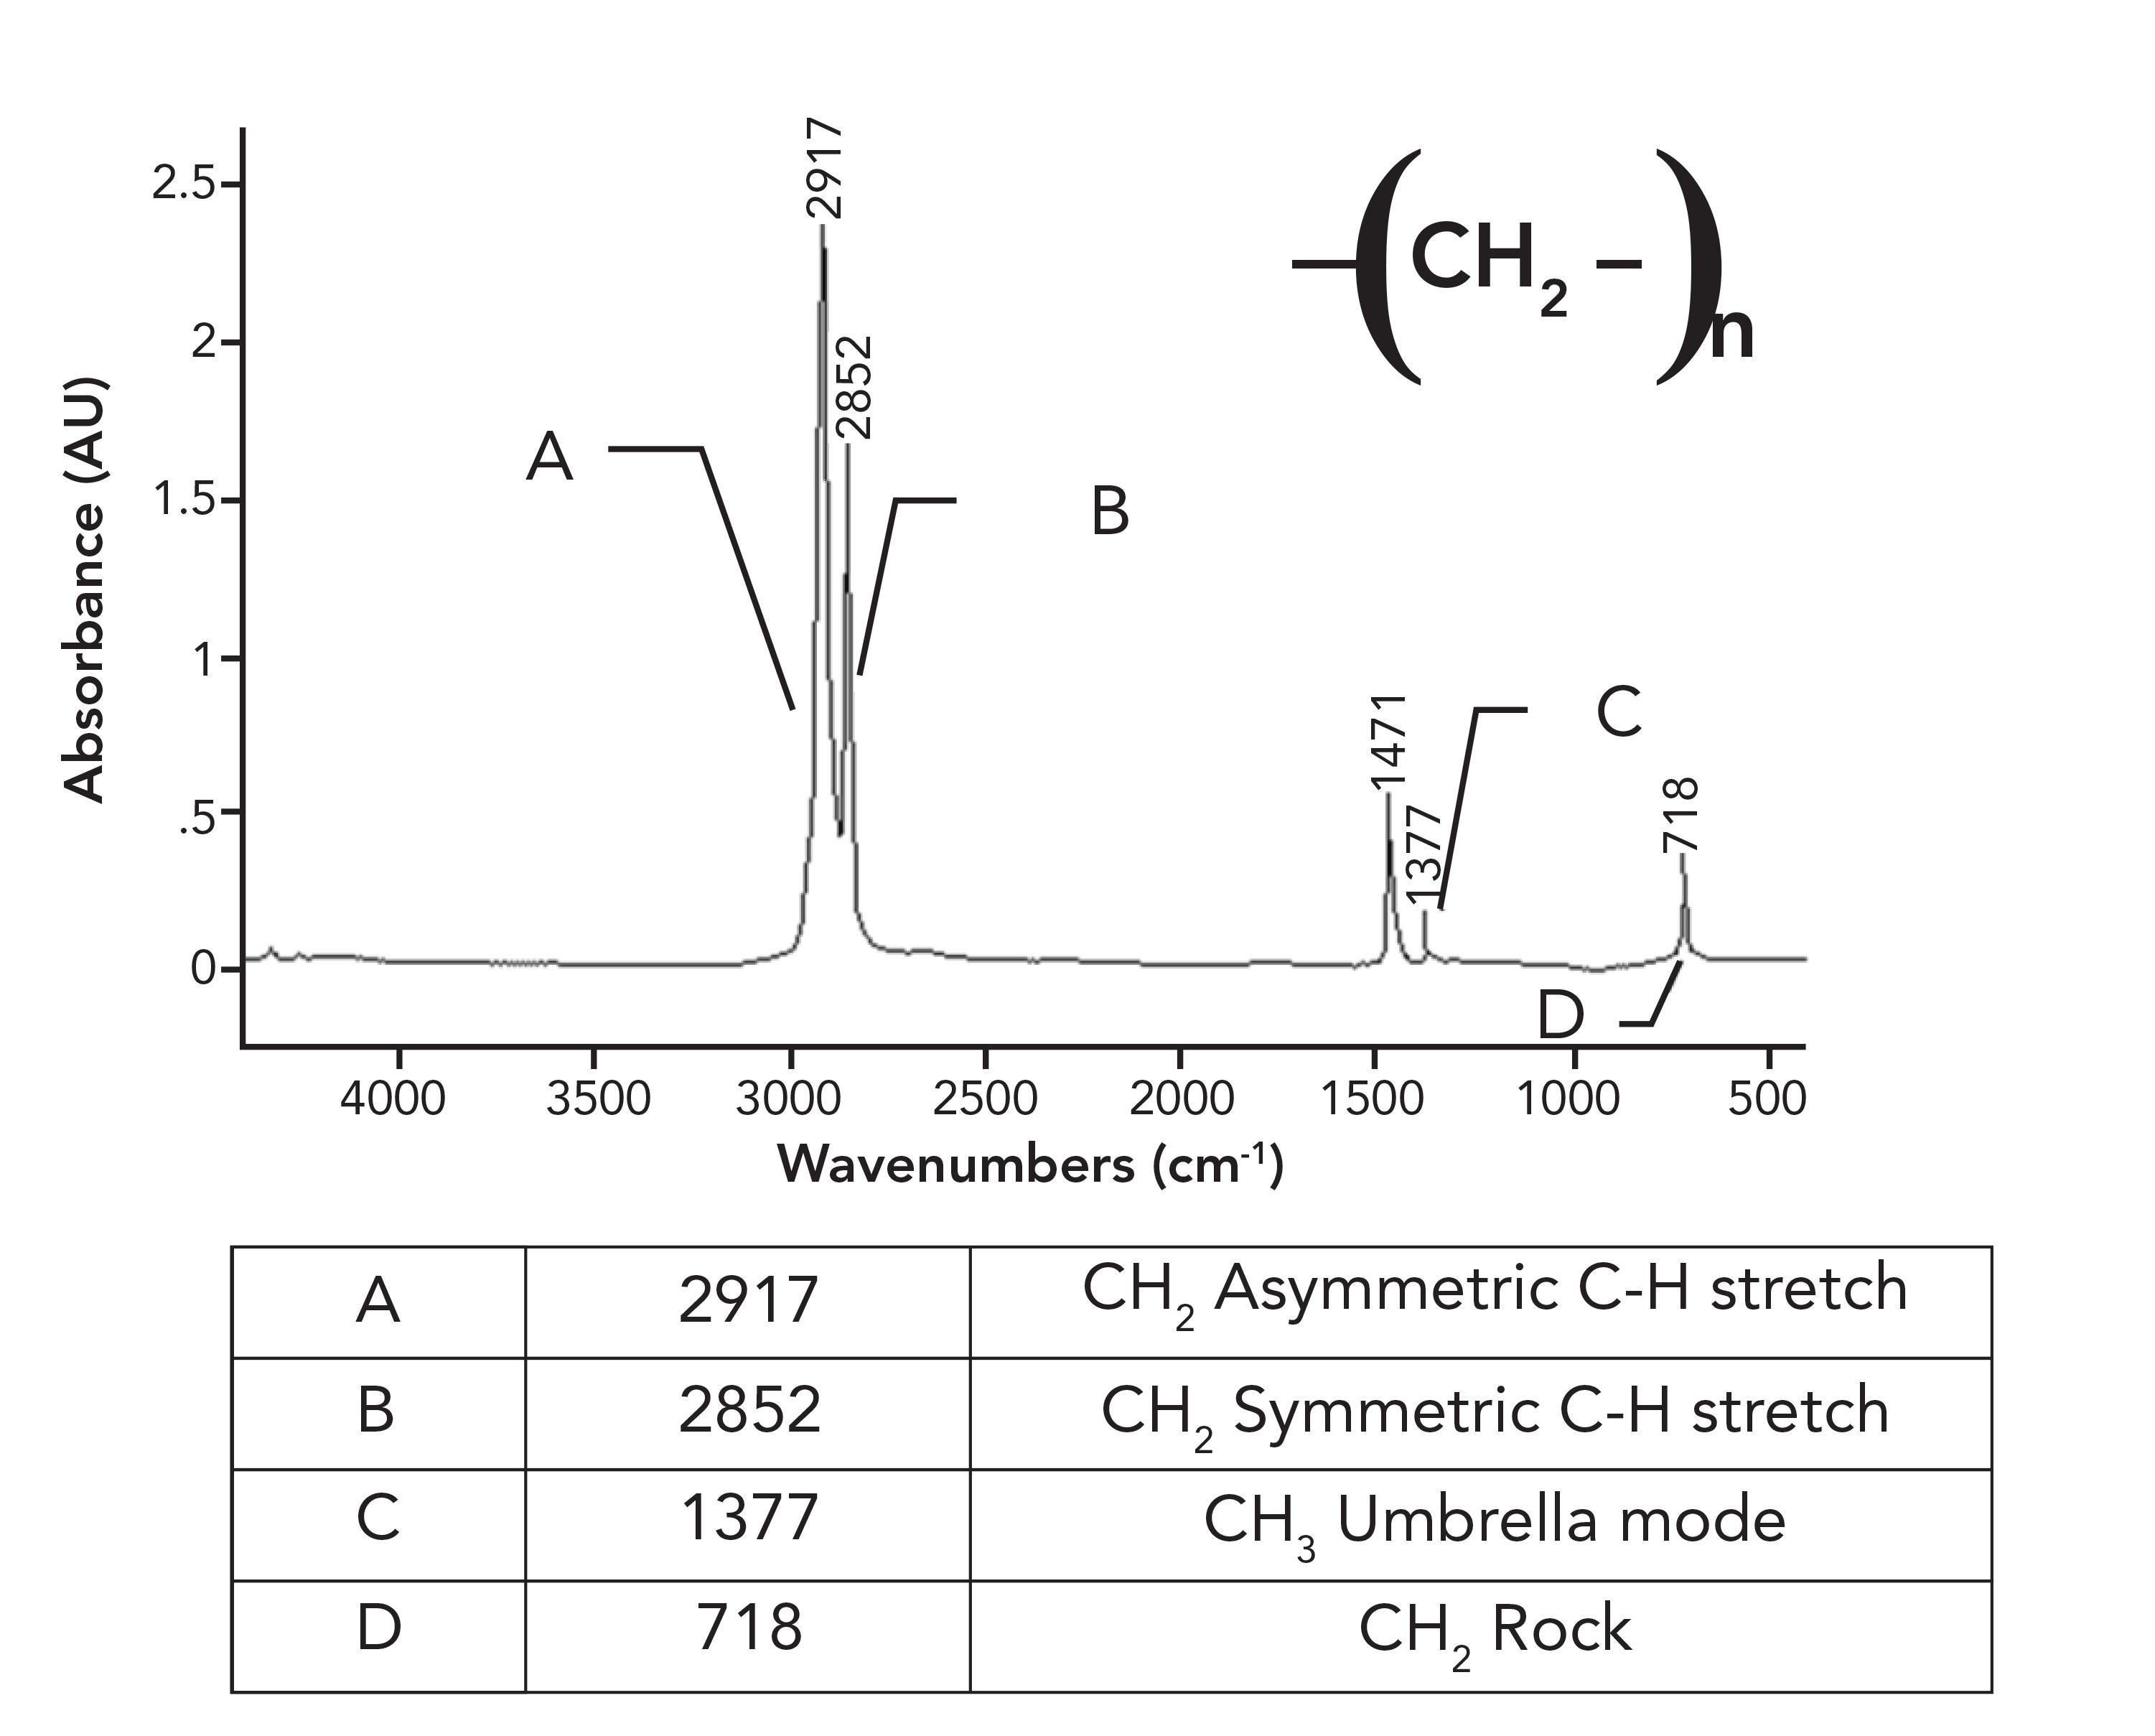
In a previous column (1), we examined the spectra of LDPE and HDPE,both alkane-based polymers, and saw how the existence of alkyl side chains in LDPE gave it different properties and spectra than HDPE. However, I left you hanging regarding the details of the HDPE spectra. Figure 1 shows the details of the HDPE spectra.

Figure 1: The infrared spectrum of high-density polyethylene (HDPE).
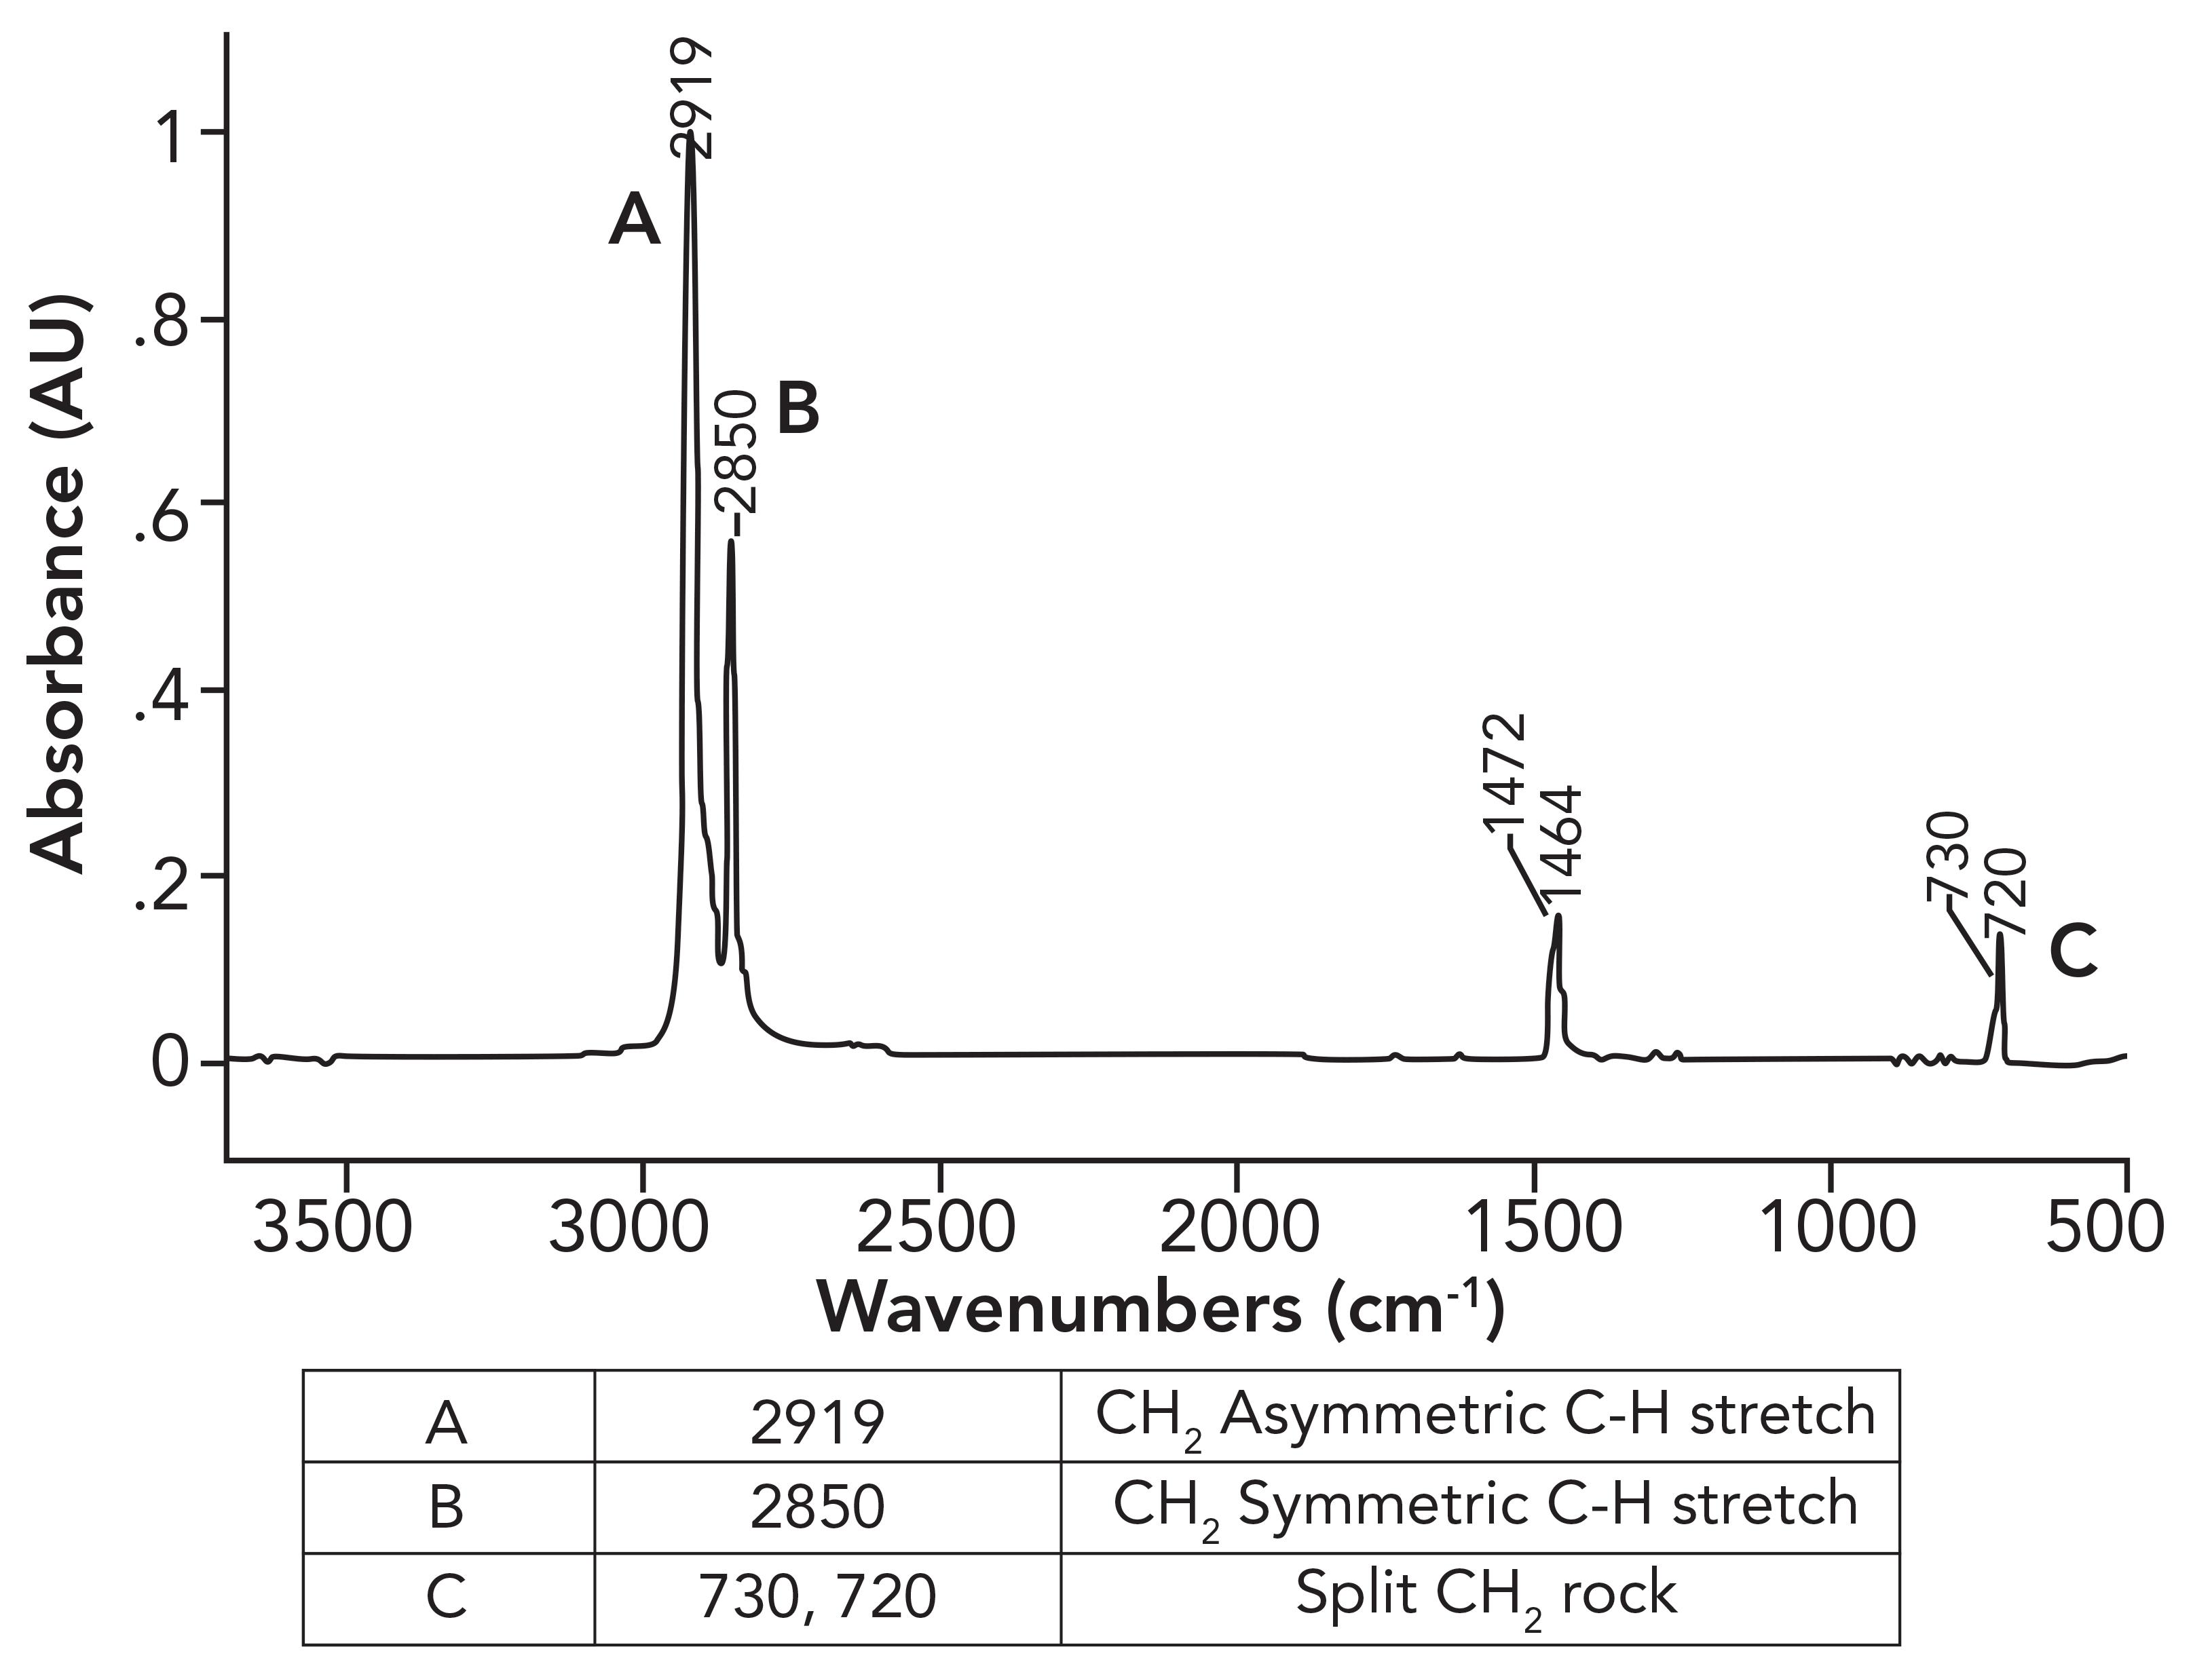
What was not discussed in the previous column (1) was why the CH2 rocking peak in HDPE is split, with peaks at 730 and 720 rather having one expected peak at 720±10. To understand this splitting, we need to first examine the spectrum of a mixture of long chain but not polymeric alkanes. The spectrum of petroleum jelly will serve as a good example, and its spectrum is seen in Figure 2.

Figure 2: The infrared spectrum of petroleum jelly.
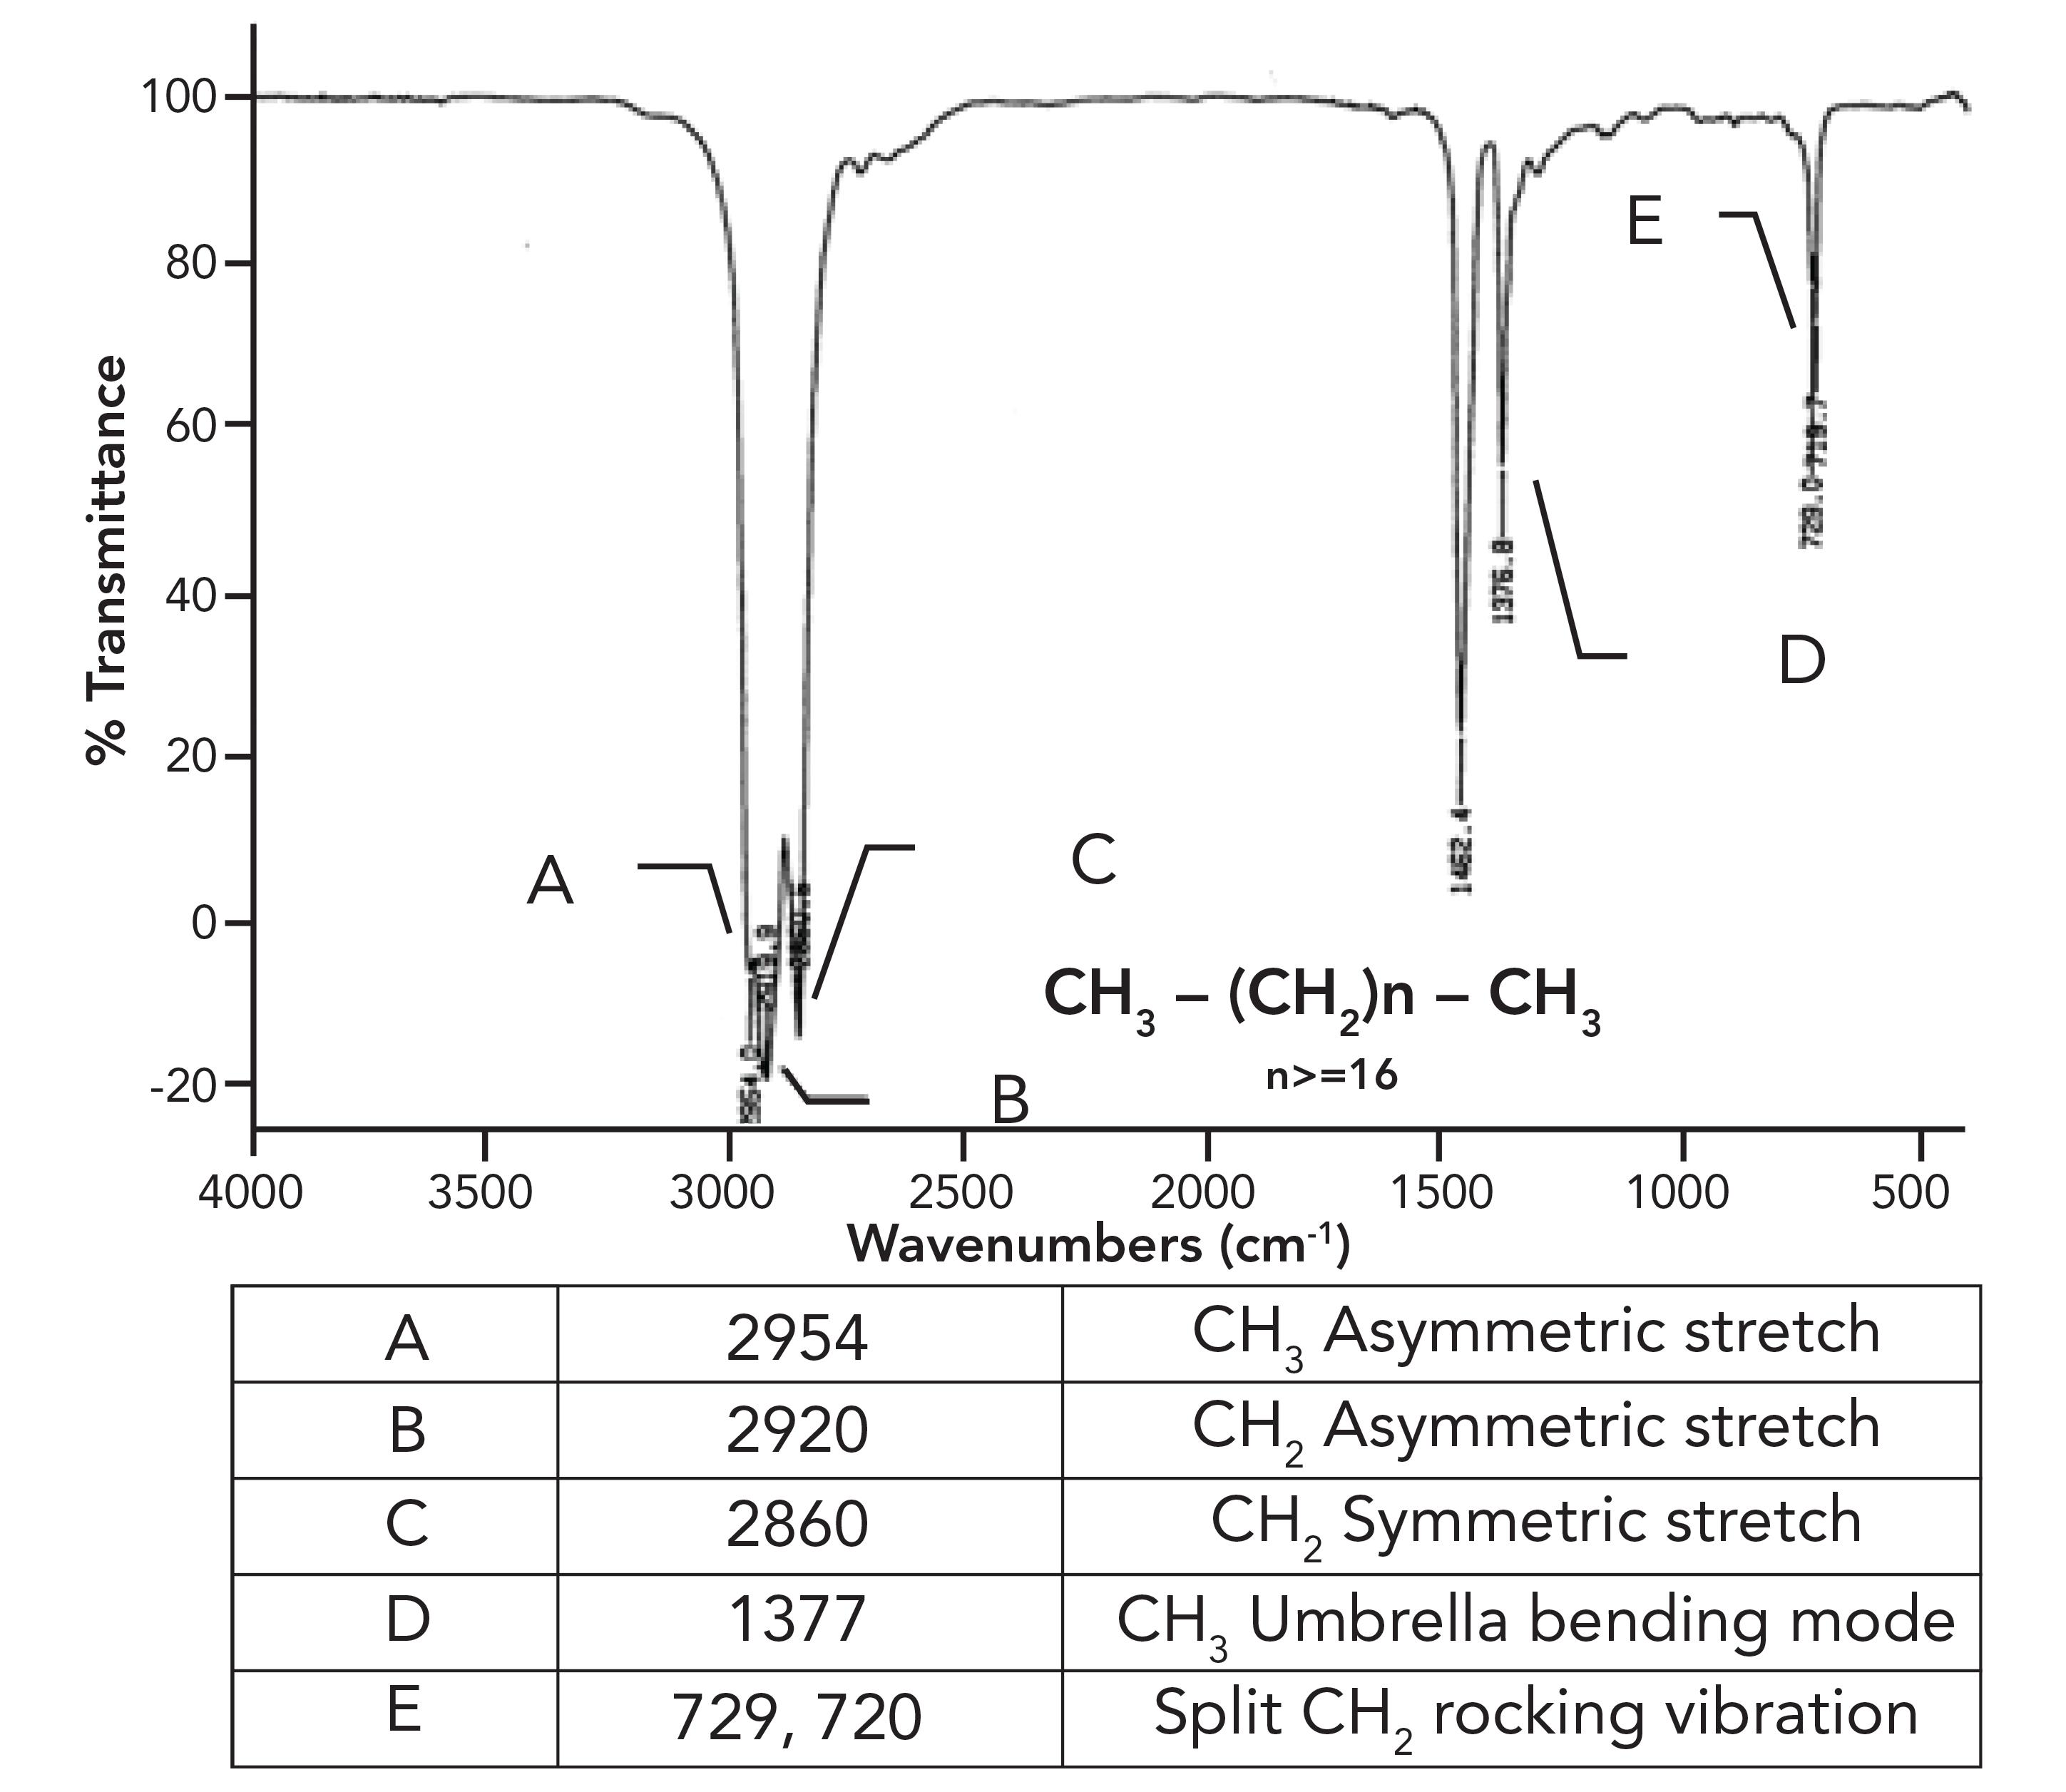
This sample consists of a mixture of straight chain alkanes with at least 18 carbons total and, at minimum, 16 methylenes in a row. As expected, we have three peaks between 3000 and 2850, confirming we have CH3 and CH2 groups present. The methyl group umbrella mode is at 1377 as expected, but note that similar to HDPE, the CH2 rocking peak in Figure 2 is split. What is up with that?
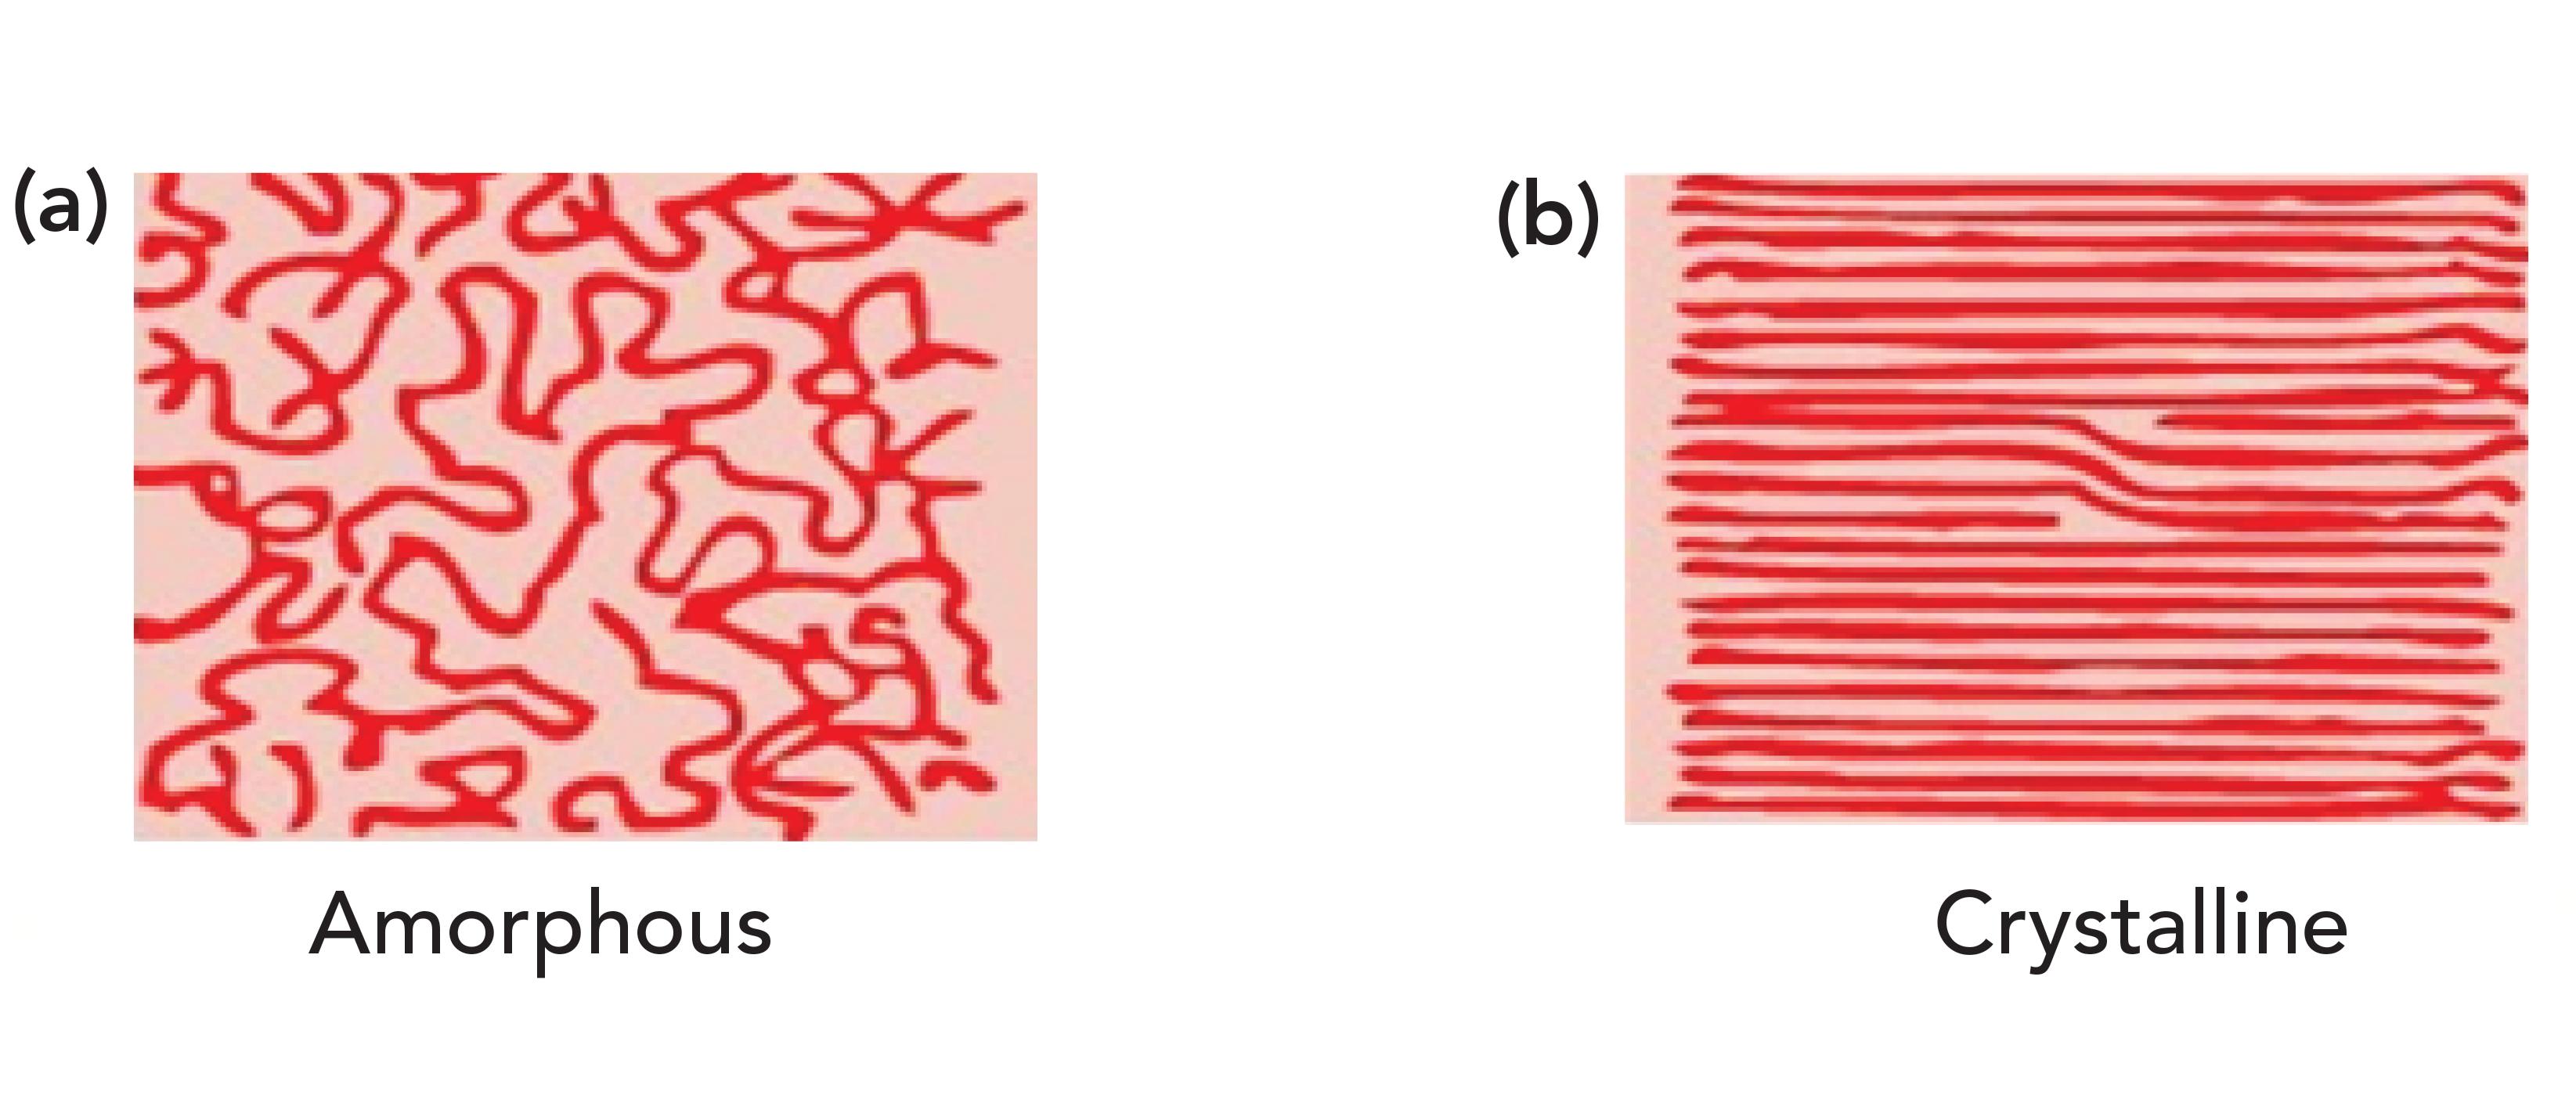
What HDPE and petroleum jelly have in common is that they contain long chains of methylene groups, and that they are solids at room temperature. The CH2 chains in these molecules can orient parallel to each other forming areas of long range order (that is, they crystallize as labeled b in Figure 3). It may seem hard to imagine that something as squishy as petroleum jelly can crystallize, but remember the definition of crystallinity is long range order, it has nothing to do with how hard a sample is (4). For example, a snowflake is crystalline, but breaks under the gentlest of pressure. Figure 3 also shows, labeled a, what randomly oriented CH2 chains look like. Randomly oriented CH2 chains are found in liquid alkanes or amorphous regions of polymers.

Figure 3: An idealized picture of long methylene chains. (a) Random orientation produces amorphous materials, (b) parallel orientation produces long range ordered crystalline materials.
Why then do HDPE and petroleum jelly have a split CH2 rocking peak? Imagine methylene groups on two parallel CH2 chains both absorbing photons of the appropriate energy at the same time. They will undergo the CH2 rocking vibration simultaneously as seen in Figure 4.

Figure 4: Methylene groups on adjacent molecules rocking in-phase and out-of-phase with each other.
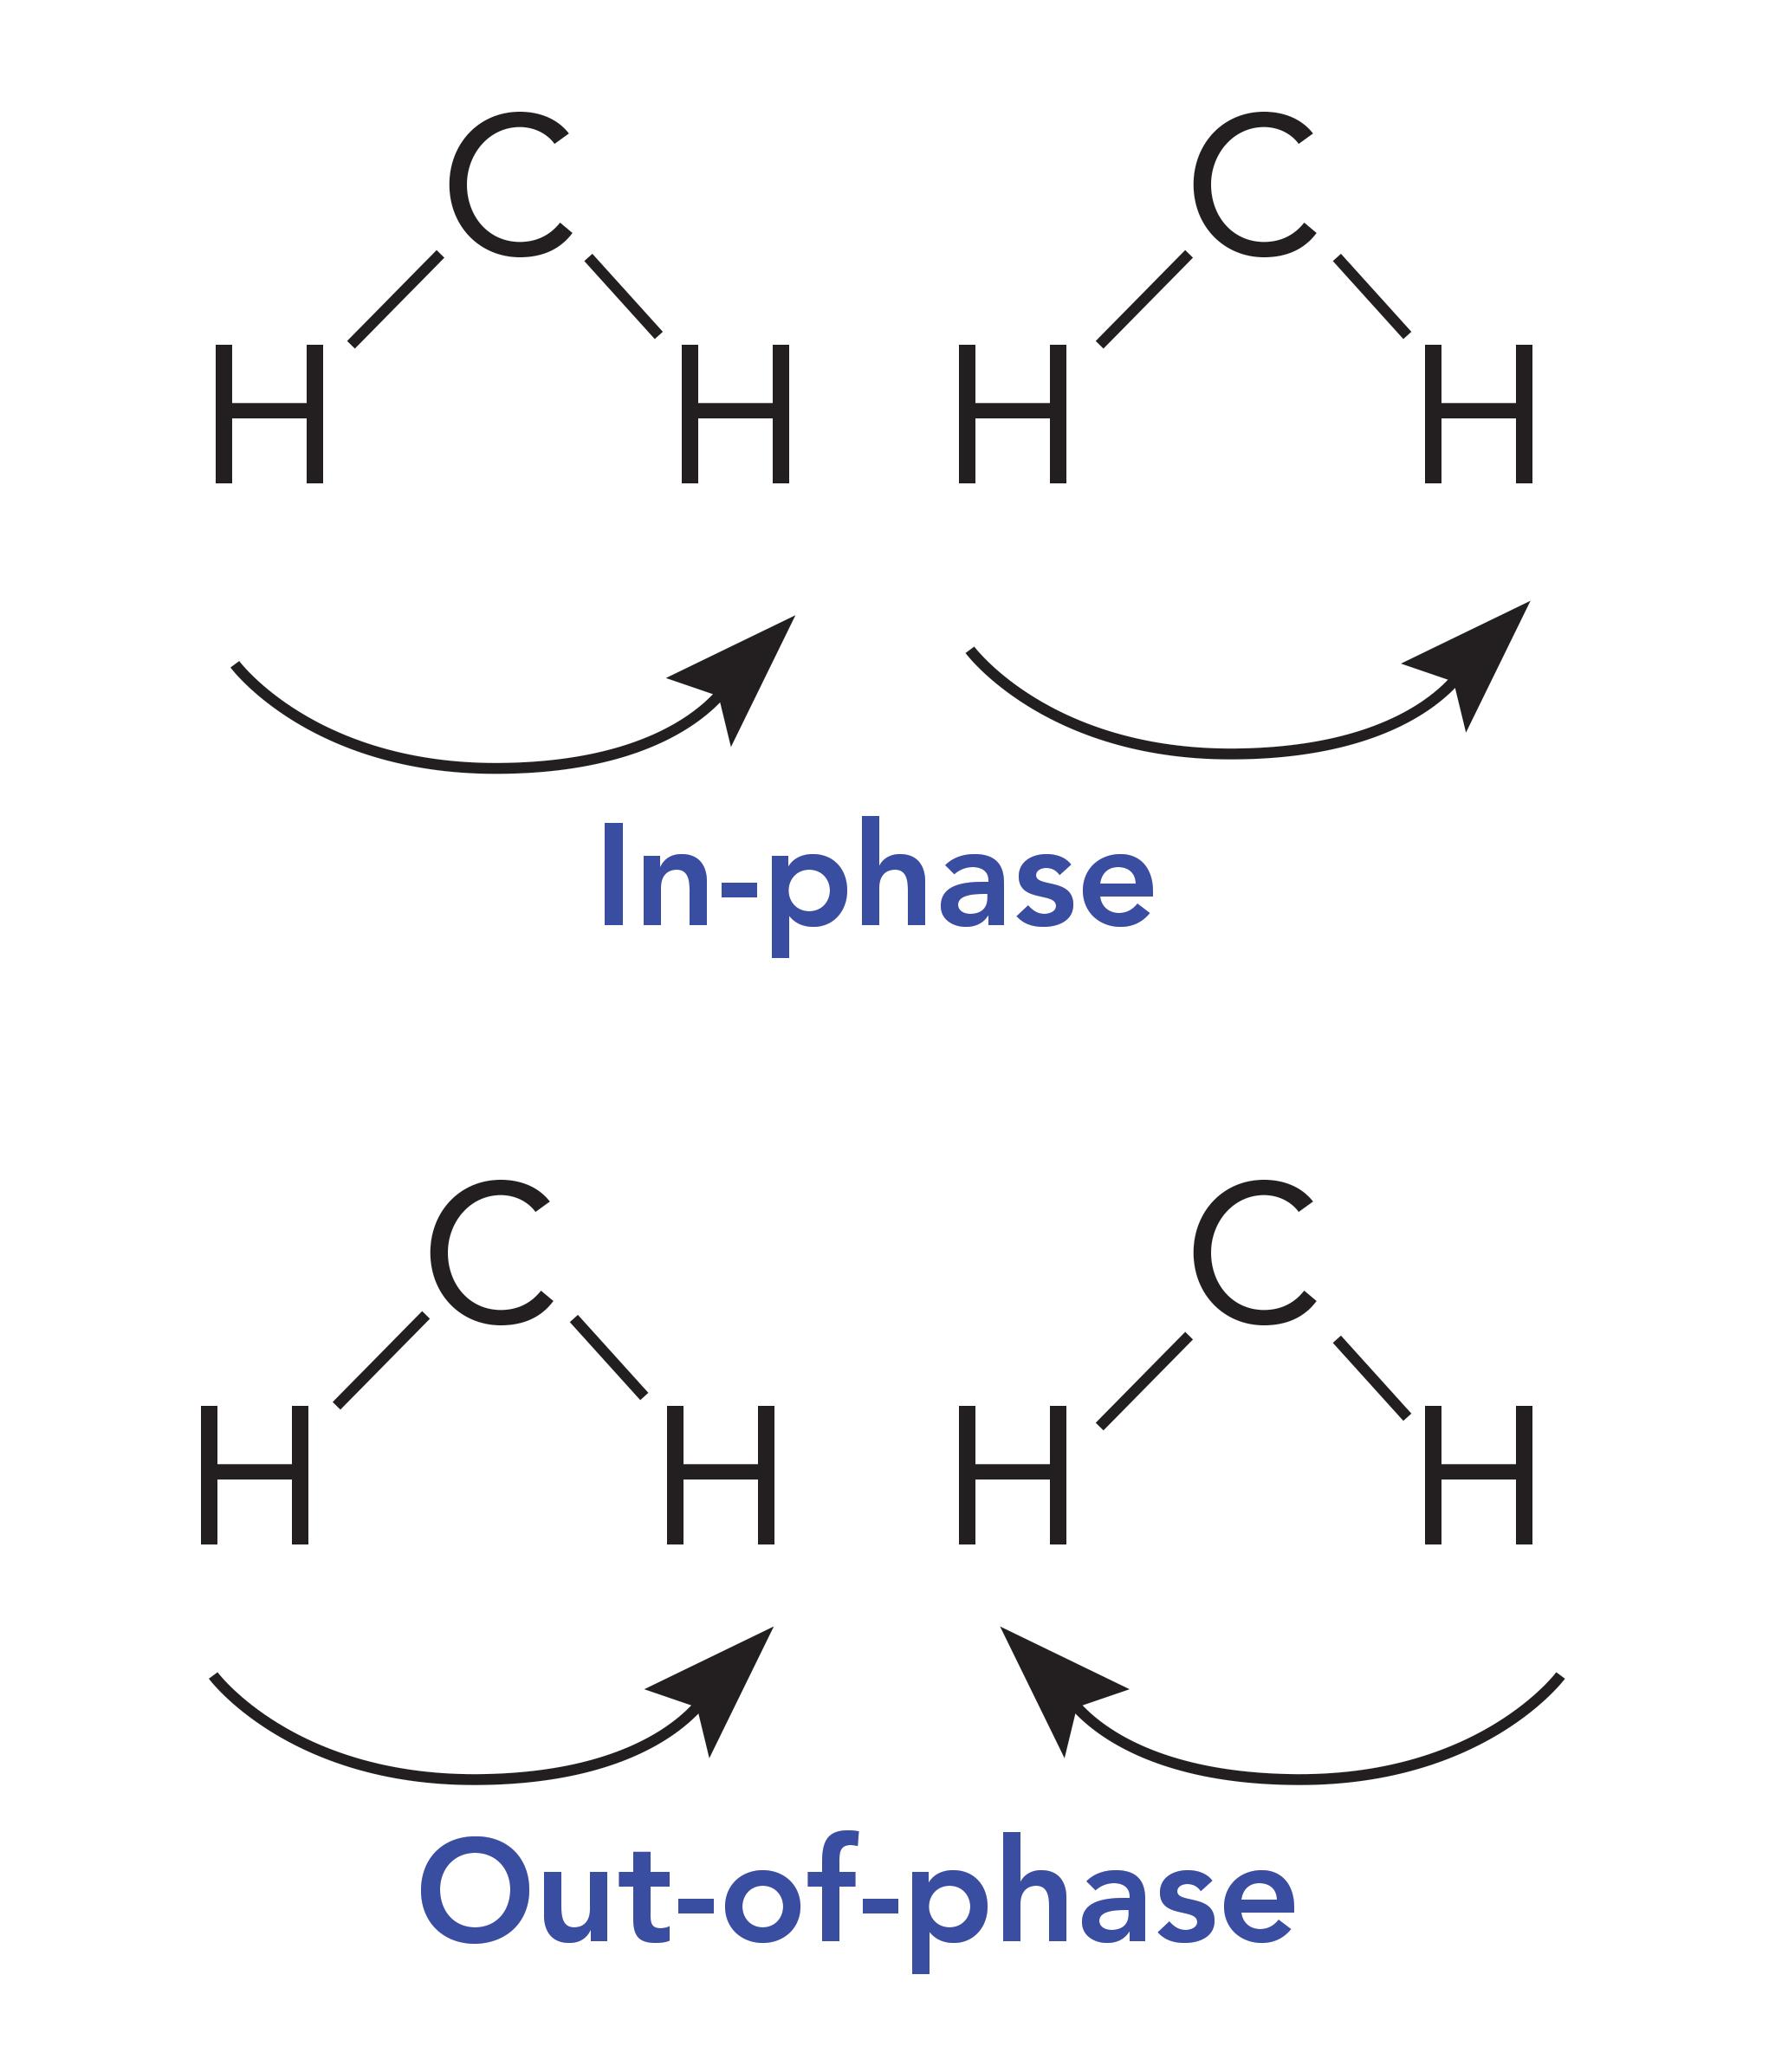
These CH2 groups can vibrate in two different ways: They can move in-phase as illustrated at the top of Figure 4, or out-of-phase as seen in the bottom of Figure 4. The difference between these two situations is that when the two CH2 groups rock in-phase, they do not touch, but when they rock out-of-phase, they collide with each other. As a result of this collision, there is an interaction between these methylenes altering the force constant of the vibration and hence its peak position. It was discussed in a previous article that one of the variables that determines peak position is the force constant for a vibration (5). Because the in-phase and out-of-phase rocking vibrations have different force constants, they will have different peak positions and result in two CH2 rocking peaks instead of one. The rocking vibrations having different force constants is why the spectrum of petroleum jelly in Figure 2 has two CH2 rocking peaks at 729 and 720, and why the spectrum of HDPE in Figure 1 has two CH2rocking peaks at 730 and 720. We will call this pair of peaks a “split CH2 rocking mode peak.” This splitting is indicative of solid, long chain alkanes, of which both petroleum jelly and HDPE are examples. Liquid alkanes, such as melted petroleum jelly, do not exhibit this splitting because their chains are oriented randomly with respect each other. LDPE does not exhibit this splitting because the side chains force the methylene chains apart, preventing them from crystallizing. For review, the spectrum of LDPE is shown in Figure 5.

Figure 5: The infrared spectrum of low density polyethylene (LDPE).
Note in the spectrum of LDPE that there is only one CH2 rocking peak at 718, as opposed to the pair seen for HDPE in Figure 1. Crystalline samples giving split peaks is a common enough phenomenon in infrared (IR) spectroscopy that it has its own name, crystalline splitting (6). This explains why HDPE has a pair of peaks at 1472 and 1464 and 730 and 720 compared to the unsplit peaks in LDPE. The lack of side chains in HDPE allows the methylene chains to get close enough to orient and crystallize, whereas in LDPE, the side chains prevent this. To summarize this discussion, the differences between the spectra of LDPE and HDPE is that LDPE has a small CH3 umbrella mode from side chains that HDPE does not have (1), and HDPE has split peaks that LDPE does not have because it has crystalline regions. Because of the differences between LDPE and HDPE, this means that IR spectroscopy can easily distinguish LDPE from HDPE.
But Wait, There’s More!
Polymer chemists are clever people, and in their quest to customize polymer properties, they have developed many more types of polyethylene than just LDPE and HDPE. For example, one can take advantage of the fact that some syntheses of polyethylene produce custom side chain lengths, hence customizing polymer properties. Have a look at the spectrum of what is known as “linear low-density polyethylene,” or LLDPE, in Figure 6.

Figure 6: The infrared spectrum of linear low-density (LLDPE) polyethylene.
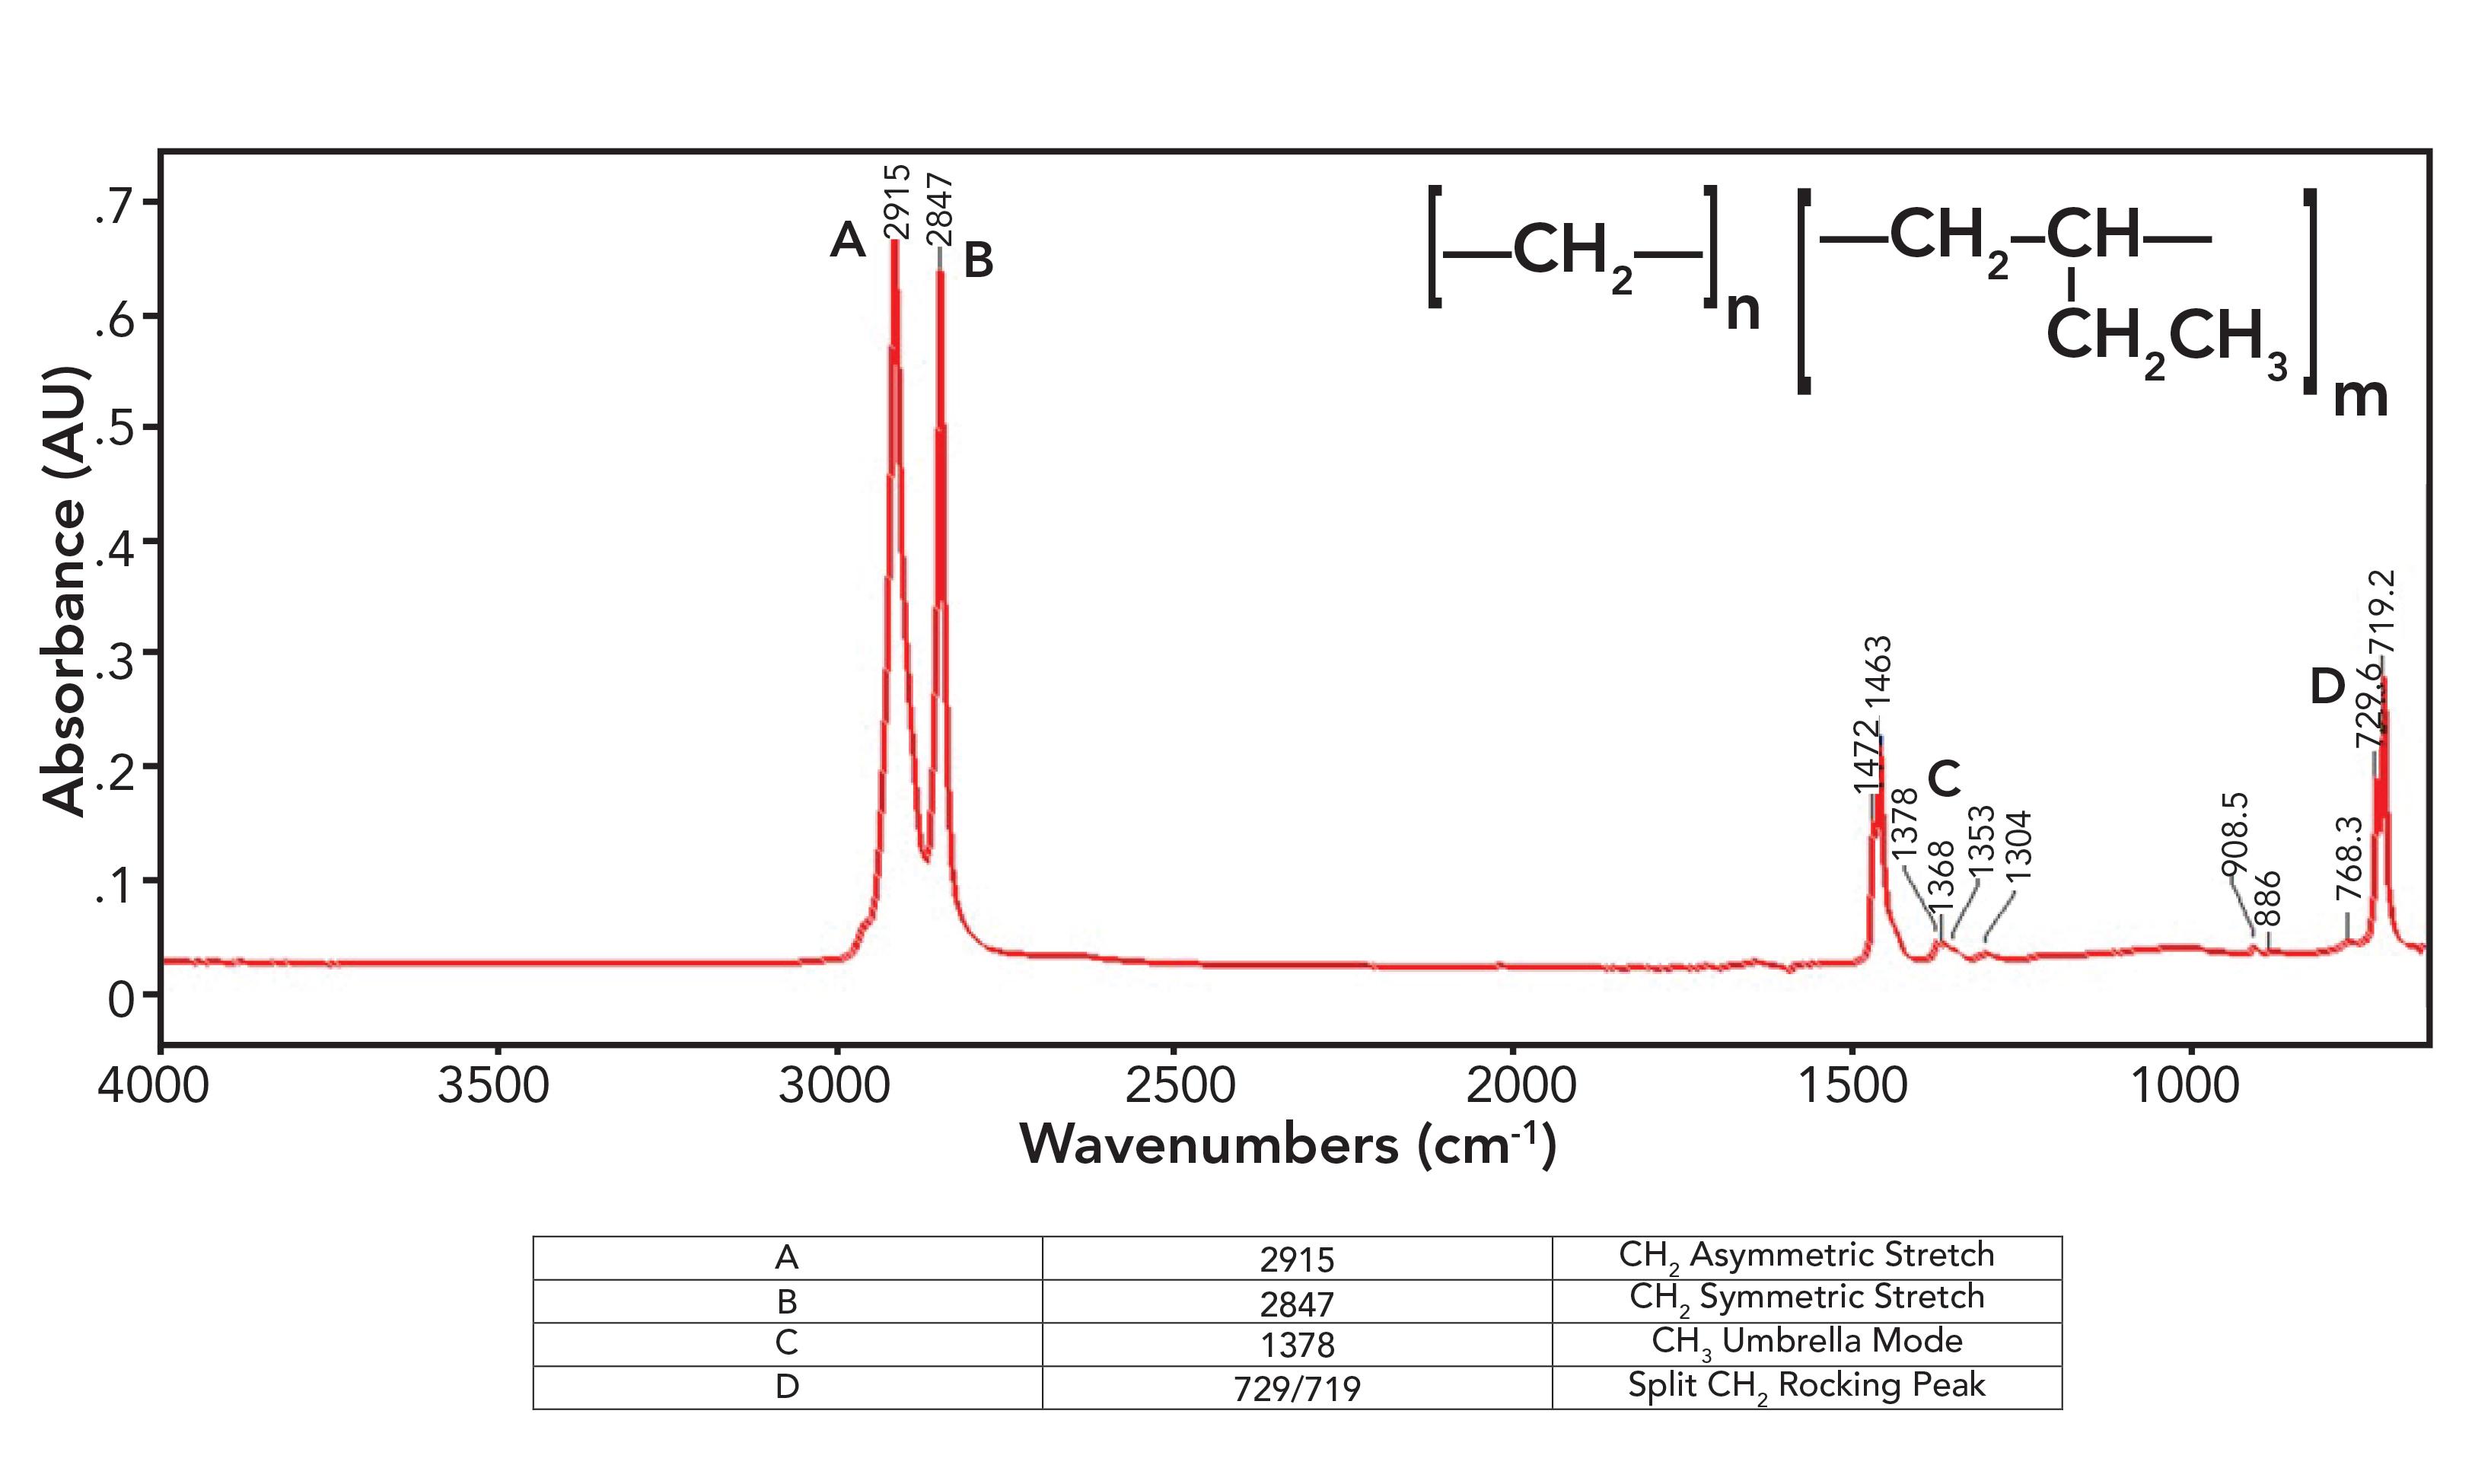
Figure 6 violates everything I just said in the last section about polyethylene spectra as LLDPE has a small methyl umbrella mode peak at 1378 from side chains, which is seen in the spectrum of LDPE, and split peaks at 1472 and 1463 and 729 and 719 which are seen in the spectrum of HDPE. How can a polyethylene (PE) sample be both high-density and low-density at the same time? That is because LLDPE is made with side chains, but they are all short ethyl groups compared to the typical hexyl group side chains in LDPE. These ethyl groups contain CH3, hence the presence of the CH3 umbrella mode peak, but the chains are short enough, allowing them to orient in a parallel fashion to form crystalline regions, hence the split peaks. The spectra of LDPE, HDPE, and LLDPE show that rather than being all one thing or all another, PE comes in a spectrum of forms, and IR spectroscopy can help distinguish between them.
The Secret Life of CH2 Rocking Vibrations
As we have seen the length of side chains in PE can be customized. How, then, would we determine how long the side chains in a sample are? IR spectroscopy comes to the rescue yet again.
In a previous column (3), I mentioned that the CH2 rocking mode falls at 720±10, and that this peak only appears if there are four or more methylenes in a row as indicated in Table III. Well, what about alkyl chains with 1, 2, or 3 methylenes in a row? How do we figure out if they are present?
The rest of the story is that ethyl, propyl, and butyl chains have unique CH2 rocking peaks as seen in Table IV.
Note that an ethyl group with just one CH2 has a high wavenumber CH2 rock around 780, that a propyl group with a -CH2CH2-CH3 moiety exhibits this peak around 740, and in the spectra of butyl or -CH2CH2CH2-CH3 groups, this peak appears around 730. Our classic four-or-more-methylenes-in-a-row CH2 peaks typically appear from 725 to 720. As a result, Table IV can be used to determine the length of short alkyl chains. These CH2 rocking peaks are illustrated in Figure 7, which shows the spectra of a tertiary butyl group with chains of 1, 2, and 3 methylenes attached.


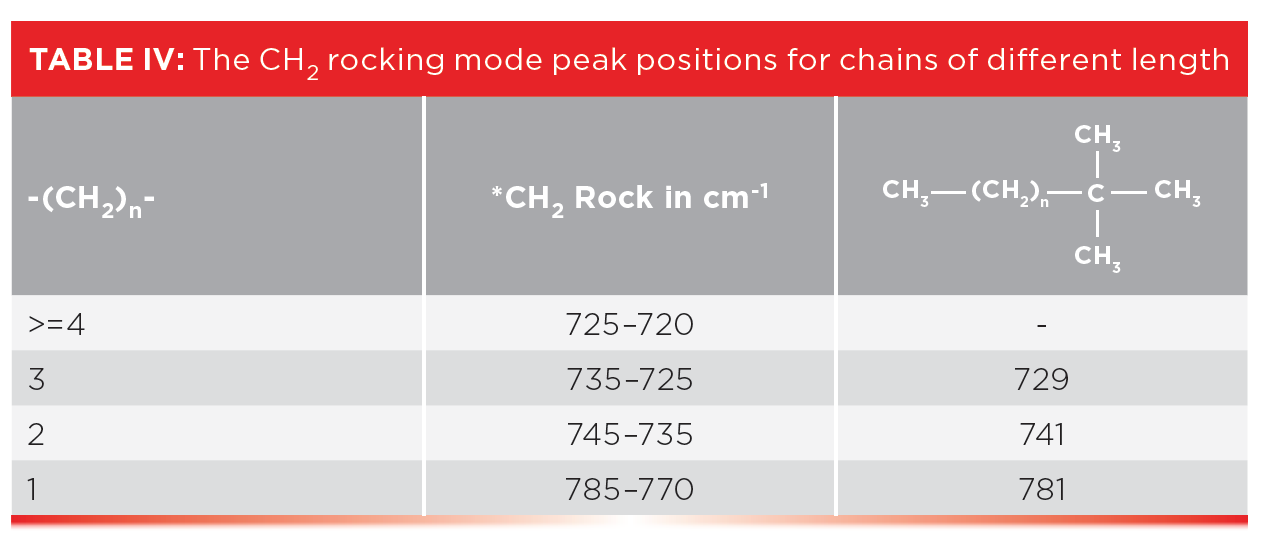

Figure 7: CH2 rocking peaks for (a) ethyl, (b) propyl, and (c) butyl chains attached to a tertiary butyl group.
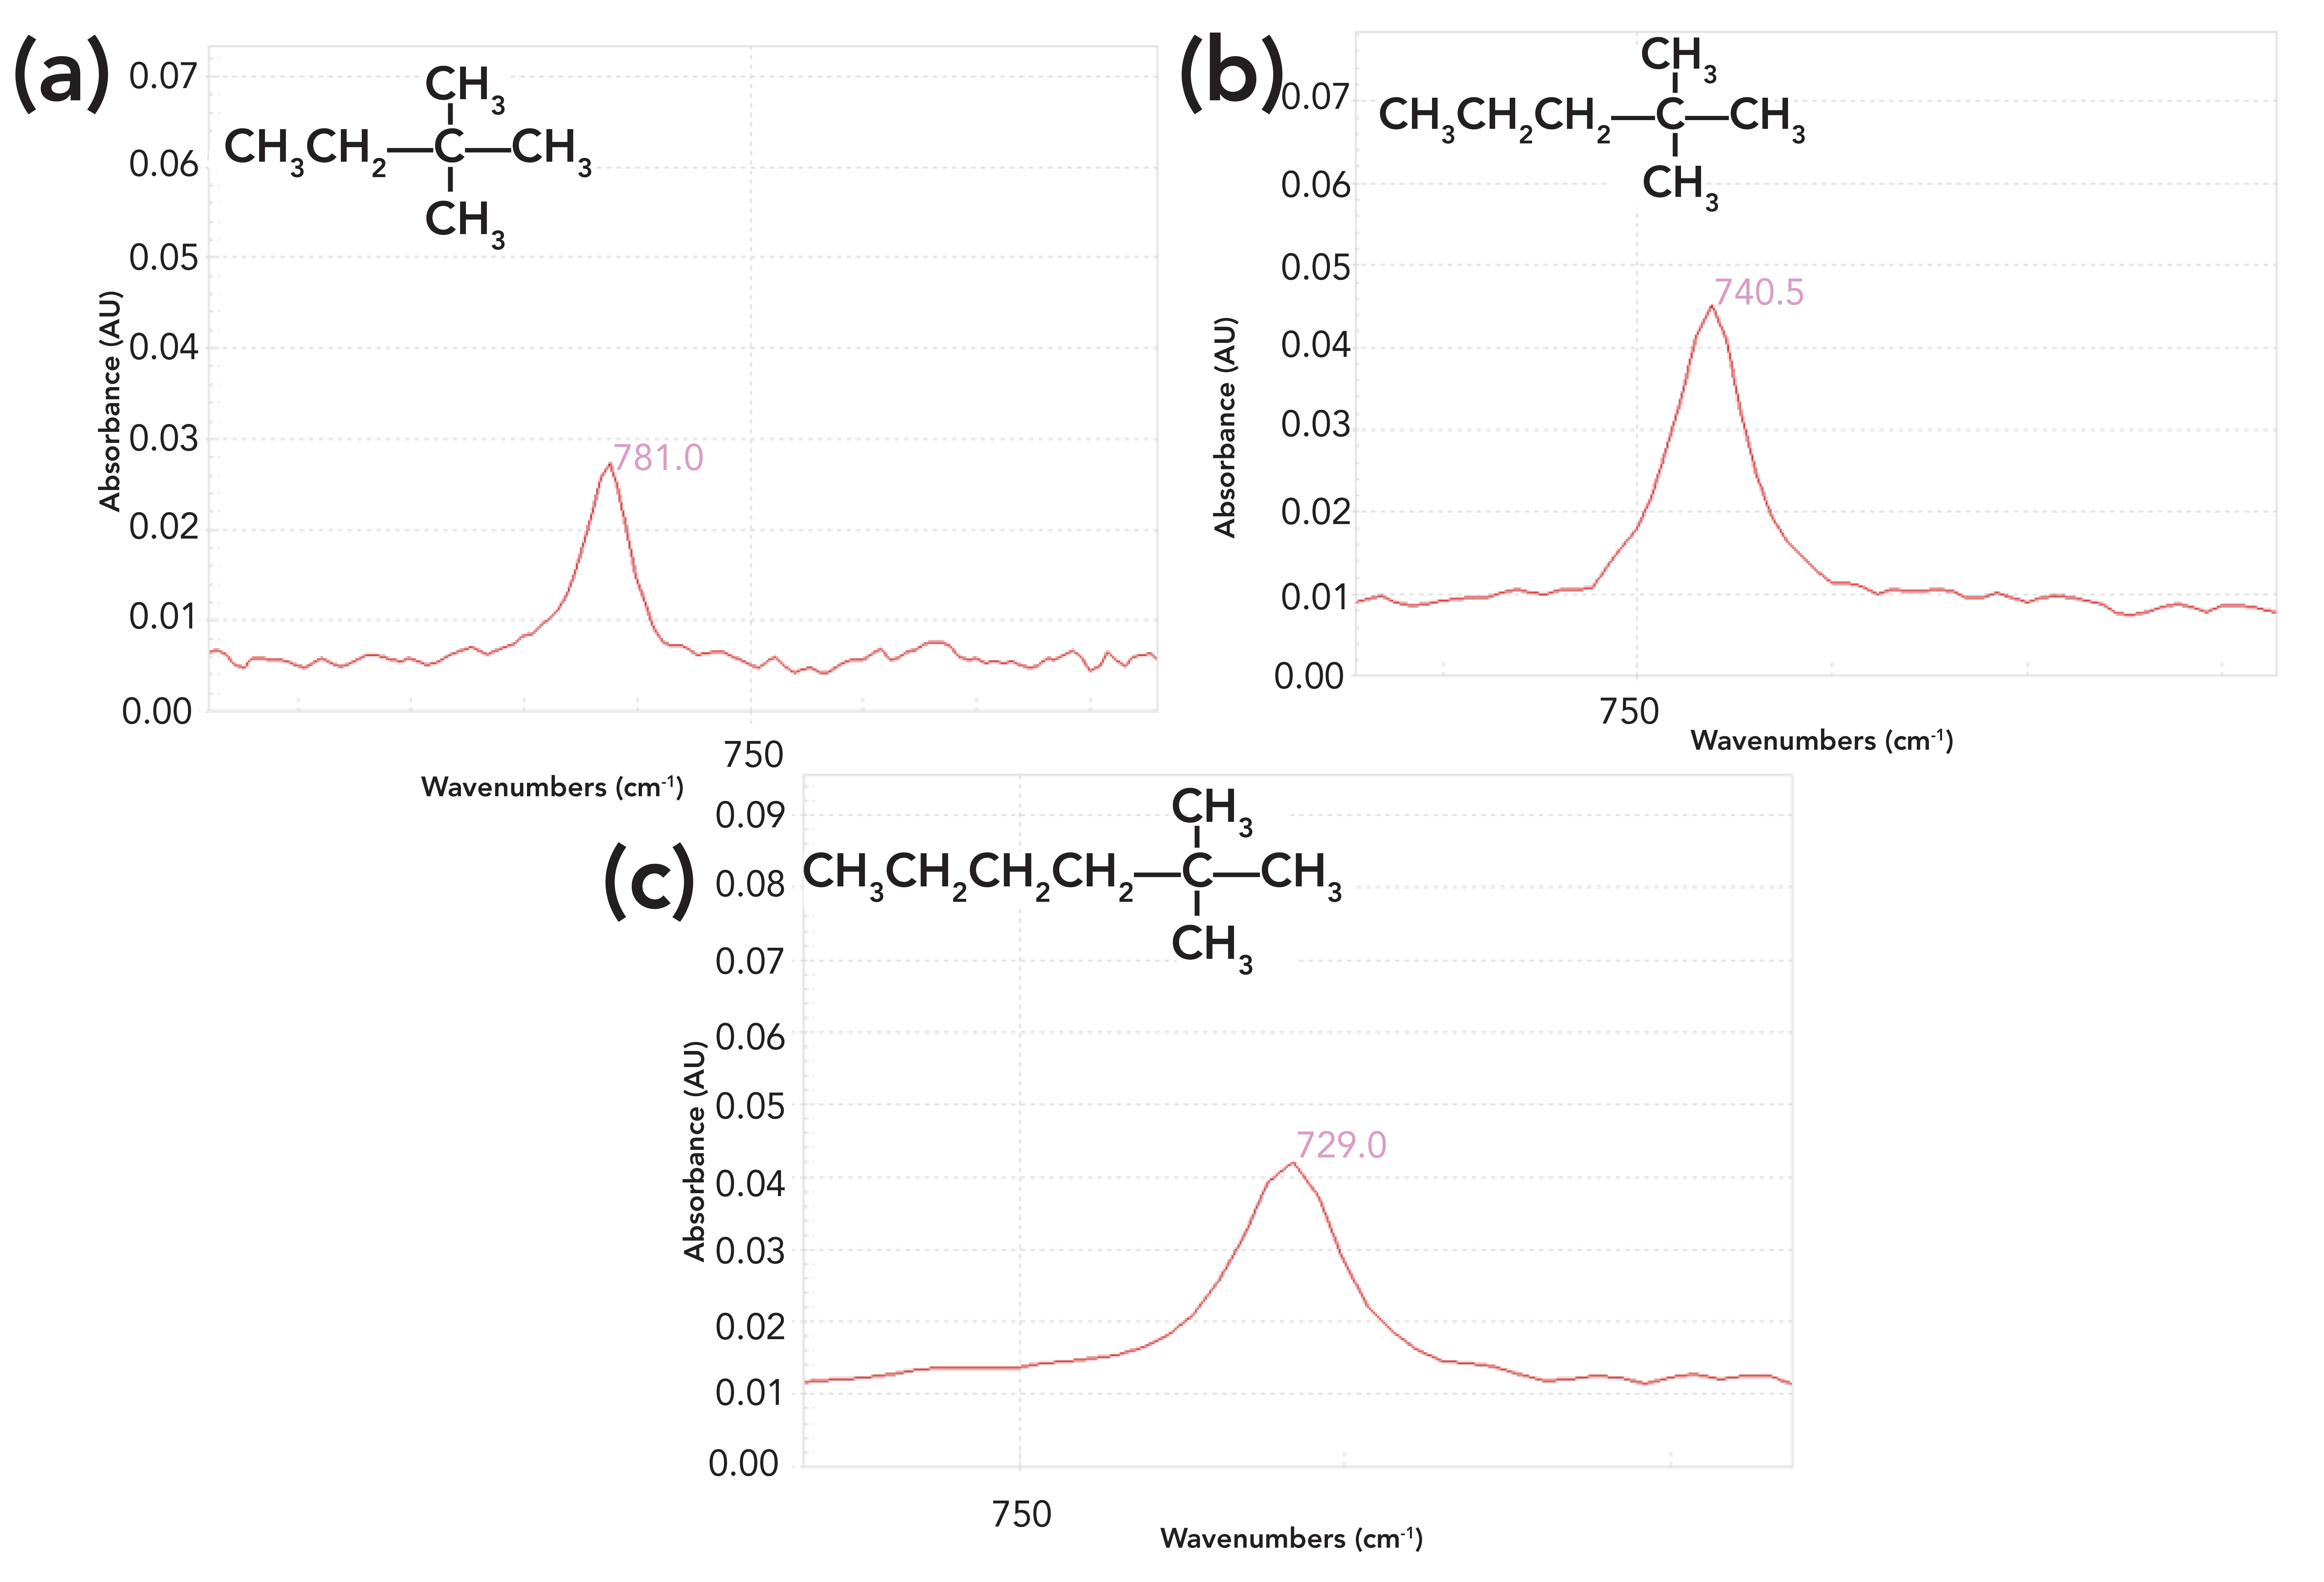
The CH2 rock in the spectrum of the ethyl group labeled A in Figure 7 falls at 781, for the propyl group labeled B at 741, and for the butyl group labeled C it falls at 729. This information is summarized in the right most column of Table IV, and all these peaks are consistent with the ranges stated in the table.
So, if Table IV is so useful, why didn’t I discuss it back in 2015 (3)? That is because the CH2 rock is an inherently weak peak (6). For longer chains with many CH2 groups, it has measurable intensity, but in a molecule with only one short chain, the peaks listed in Table IV can be hard to see. However, in custom-made polyethylene materials where the length of side chain is controlled, we have many side chains of the same length hence these CH2 rocking peaks may be visible. Table IV then can be used to determine the length of side chains in polyethylene polymers.
Conclusion
We reviewed the spectra of CH3 and CH2 stretching peaks and applied them to the spectra of HDPE and LDPE, where we learned how crystallinity causes some HDPE peaks to be split compared to LDPE. We also found that there are many forms of PE with custom length side chains, and that CH2 rocks can sometimes be used to distinguish these from each other.
References
- B.C. Smith, Spectroscopy 36(7), 17–22 (2021).
- B.C. Smith, Spectroscopy 30(4), 18–23 (2015).
- B.C. Smith, Spectroscopy 30(7), 26–31, 48 (2015).
- Crystal - Wikipedia.
- B.C. Smith, Spectroscopy, 30(1), (2015).
- B.C. Smith, Infrared Spectral Interpretation: A Systematic Approach (CRC Press, Boca Raton, Florida, 1999).


Brian C. Smith, PhD, is the founder and CEO of Big Sur Scientific, a maker of portable mid-infrared cannabis analyzers. He has over 30 years experience as an industrial infrared spectroscopist, has published numerous peer-reviewed papers, and has written three books on spectroscopy. As a trainer, he has helped thousands of people around the world improve their infrared analyses. In addition to writing for Spectroscopy, Dr. Smith writes a regular column for its sister publication Cannabis Science and Technology and sits on its editorial board. He earned his PhD in physical chemistry from Dartmouth College. He can be reached at: