Using Reference Materials, Part I: Standards for Aligning the X-Axis
Spectroscopy
The use of reference materials to align or test the wavelength–wavenumber axis for optical spectroscopy is essential for quantitative and qualitative methods. This article provides details for using reference materials with ultraviolet, visible, near-infrared, infrared, and Raman spectroscopy methods.
Alignment of the x-axis (also known as the wavelength or wavenumber axis) is assumed for all spectra used for the purposes of quantitative and qualitative work. Note that the assumption for regression modeling, as well as spectral comparison algorithms, is that the data channels, or x-axis scales of the spectroscopic data, are precisely aligned, and that only amplitude in the y-axis changes with respect to analyte concentration in a pre-defined mathematical relationship. This article provides a discussion and set of spectra to illustrate the use of reference materials to align the x-axis for the major types of optical spectroscopy, to include the ultraviolet, visible, near-infrared, infrared, and Raman spectroscopic methods.
The alignment of the x-axis (also known as the wavelength or wavenumber axis) for spectroscopic data is essential to the basic use of these spectroscopic techniques. The primary assumption of all quantitative regression and qualitative comparison methods is that the data channels, as wavelength or frequency, are precisely aligned for comparison. Without such a condition, no spectroscopic methods are valid. Thus, the alignment of the x-axis requires a known standard material that may be measured to either align the axis, or to verify whether the axis is aligned. Multiple standards are available for each spectroscopic region. The typical standards used for spectrometer alignment or testing will be illustrated within this article (1–3).
Ultraviolet (UV) Wavelength Measurement Standards
There are several available standards used for initial alignment, or for verifying alignment, when using ultraviolet spectrophotometers. The ultraviolet spectral region is generally considered to include from 190 nm to 380 nm (non-vacuum UV region). Note that the standards shown are also useful and traceable for visible (vis) spectroscopic measurements. The certified peak positions are labeled within the figures and the data are given in accompanying tables.

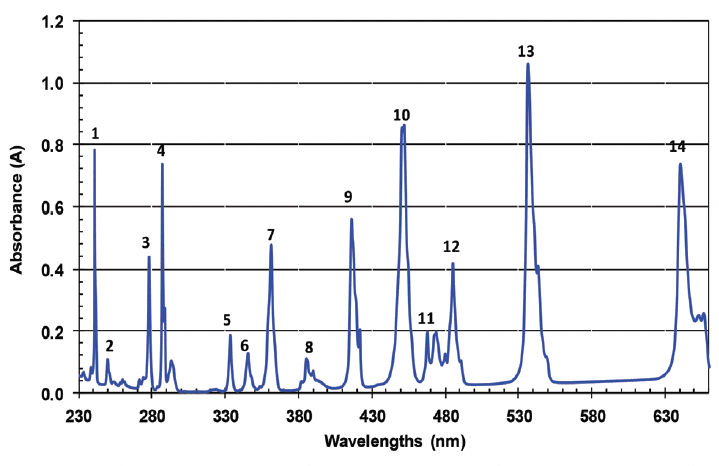
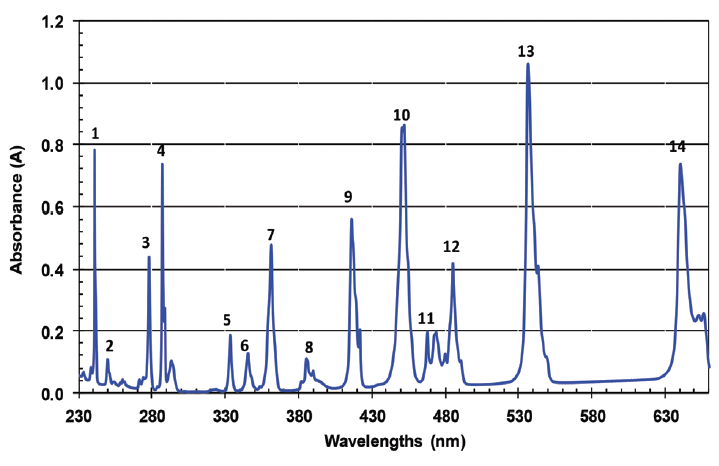
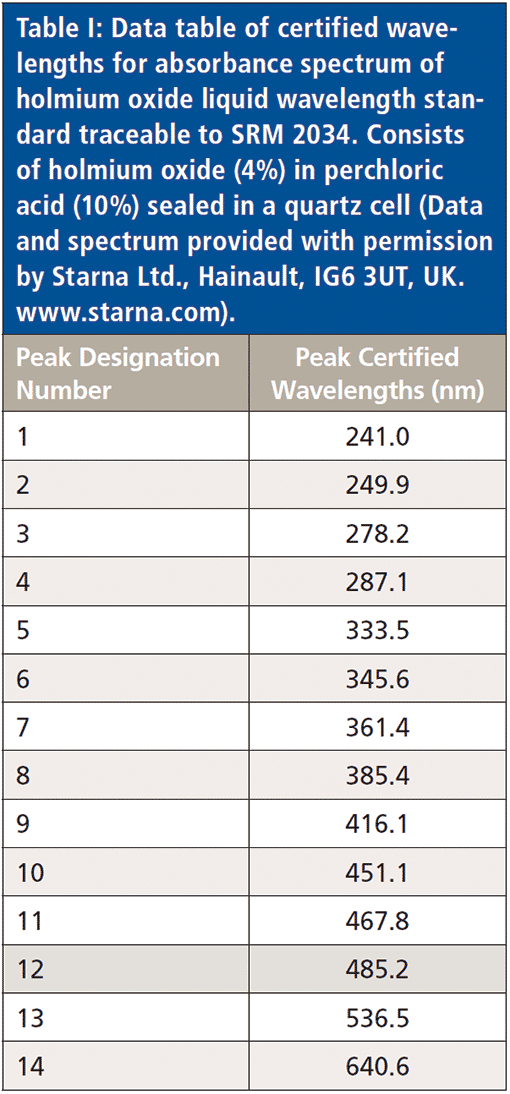
Figure 1: High resolution absorbance spectrum of holmium oxide liquid wavelength standard traceable to SRM 2034 (Data and spectrum provided with permission by Starna Ltd., Hainault, IG6 3UT, UK. www.starna.com).
Holmium Oxide Liquid Wavelength Standard Traceable to SRM 2034
Holmium oxide liquid wavelength standard is traceable to the National Institute of Standards and Technology (NIST) Standard Reference Material (SRM) 2034, and consists of holmium oxide (4%) in perchloric acid (10%) sealed in a quartz cell. Specifically, the solution contains 4% (mass fraction) of holmium oxide (Ho2O3) in 10% (volume fraction) perchloric acid (HClO4). This solution is a stable material that has multiple peaks useful for aligning and maintaining a UV or vis spectrophotometer for the wavelength axis. The peaks are stable if the quartz cell remains clean and unopened (4).


Figure 2: High resolution transmittance spectrum of holmium oxide liquid wavelength standard traceable to SRM 2034 (Data and spectrum provided with permission by Starna Ltd., Hainault, IG6 3UT, UK. www.starna.com).
The spectra for this liquid standard material are illustrated in Figures 1 and 2, with the data table of certified wavelengths for the absorbance spectrum given in Table I.


Holmium Oxide Glass Wavelength Standard Traceable to SRM 2034
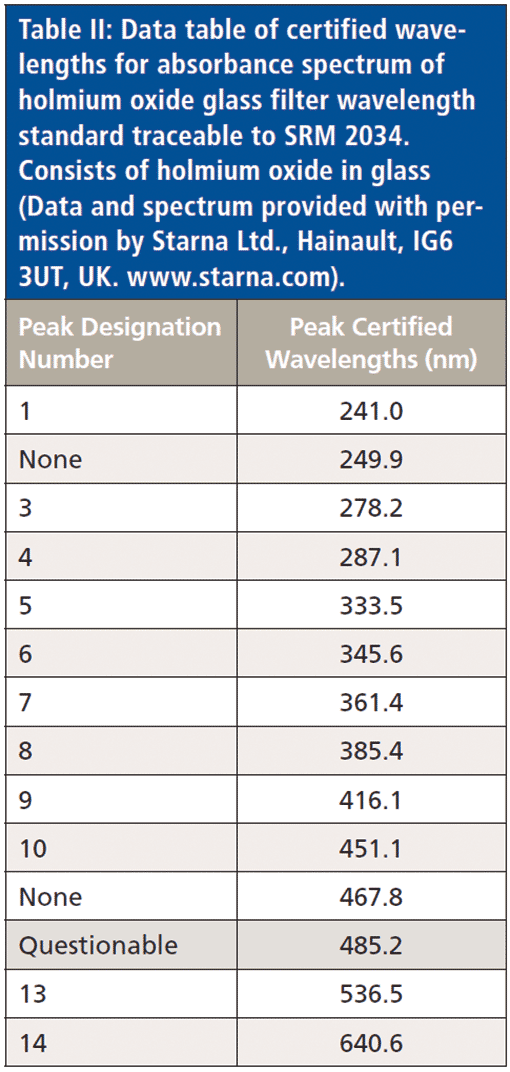
The holmium oxide glass wavelength standard is traceable to NIST SRM 2034, and has been available for many years. It consists of holmium oxide (Ho2O3) in a special glass. The glass was initially developed by Corning Glass (Corning, New York), and sold as glass No. 3130. The thickness of the glass selected is designed to be less than 3 mm, which provides an approximately 1% transmittance or greater at the specific absorption peaks used (5,6).

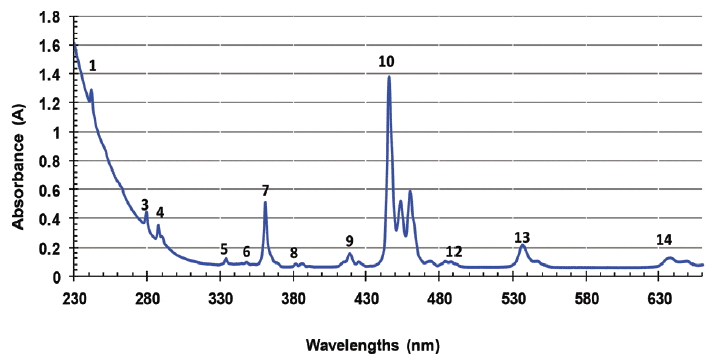

Figure 3: Absorbance spectrum of holmium oxide glass wavelength standard traceable to SRM 2034 (Data and spectrum provided with permission by Starna Ltd., Hainault, IG6 3UT, UK. www.starna.com).
NIST has made the material available as an SRM since 1961. NIST reports that, over 40 years of testing, there has been no recorded instance of a spectral shift of the certified bands for any of the [test] samples measured. The material has been characterized as being robust and insensitive to a standard range of humidity and temperature conditions inherent to laboratory use. Because of the demonstrated stability the standards are no longer recertified by NIST, as there is no need (7).
The absorbance and transmittance spectra for the holmium oxide glass are shown in Figures 3 and 4, respectively with the table of certified wavelength values given for the observed peaks given in Table II.


Visible (Vis) Wavelength Measurement Standards
Note that the visible spectral region is generally considered to be from 380 nm to 750 nm.
NIST SRM 2036 Reflectance Wavelength SRM
NIST SRM 2036 glass is a mixture of the following mole fractions of materials: 3.00% holmium oxide (Ho2O3), 1.30% samarium oxide (Sm2O3), 0.68% ytterbium oxide (Yb2O3), and 0.47% neodymium oxide (Nd2O3). This is mixed with a matrix material containing lanthanum oxide (La2O3), boron oxide (B2O3), silicon dioxide (SiO2), and zirconium dioxide (ZrO2). The SRM 2036 glass optical filter is 25 mm in diameter and 1.5 mm thick. The backing consists of sintered polytetrafluoroethylene (PTFE, FW99), which is 25 mm in diameter and approximately 6 mm thick (8).

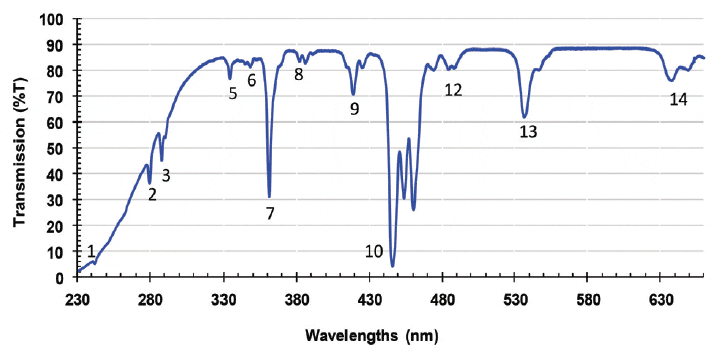

Figure 4: Transmittance spectrum of holmium oxide glass wavelength standard traceable to SRM 2034 (Data and spectrum provided with permission by Starna Ltd., Hainault, IG6 3UT, UK. www.starna.com).
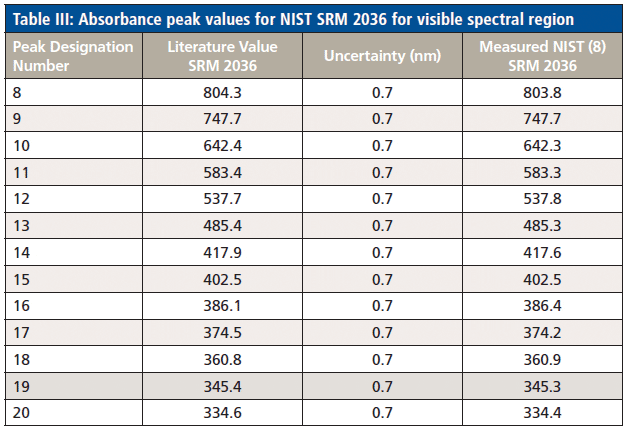
SRM 2036 is intended for the verification and calibration of the wavelength or wavenumber scale of near-infrared (NIR) spectrometers operating in diffuse reflectance or transflectance mode. It is also useful for the visible region and has 11 peak positions characterized within the visible spectral region (Figures 5 and 6, Table III). SRM 2036 is similar in composition to SRM 2035 Near-Infrared Transmission Wavelength–Wavenumber Standard and SRM 2065 Ultraviolet-Visible-Near-Infrared Transmission Wavelength–Wavenumber Standard. The difference is that 2036 contains a piece of sintered polytetrafluoroethylene (PTFE, FW99) in physical contact as a reflectance backing. The combination of the reference glass in contact with the diffuse reflection backing provides reflection–absorption bands ranging from 15% reflection ® to 40% R. Technical specifications state that SRM 2036 is certified for the 10% band fraction air wavelength centroid location, (10%)B, of seven bands spanning the spectral region from 975 nm to 1946 nm. It is also certified for the vacuum wavenumber (10%)B of the same seven bands in the spectral region from 10,300 cm-1 to 5,130 cm-1 at 8 cm-1 resolution. Informational reference values are provided for the locations of thirteen additional bands from 334 nm to 804 nm (9).


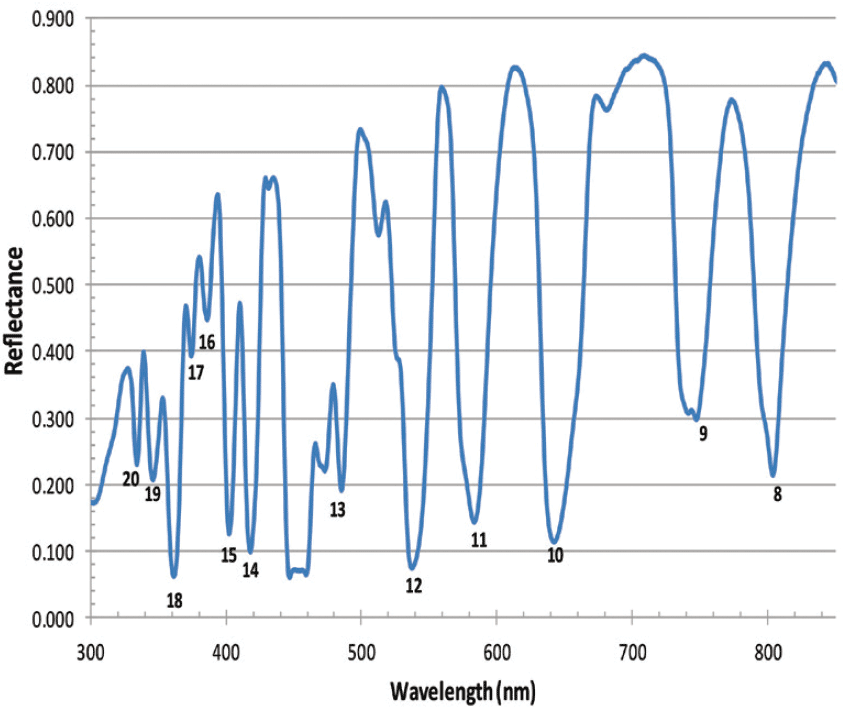
Figure 5: NIST SRM 2036 reflectance wavelength standard reference material (SRM) measured using 8°/hemispherical spectral reflectance factor geometry and a calibrated double-monochromator instrument from 250 nm to 850 nm. Peak designations marked (Data and spectrum used with permission from Avian Technologies, New London, NH).
Near-infrared (NIR) Wavelength Measurement Standards
Note that the near-infrared (NIR) spectral region is generally considered for commercial instruments to be from 780 nm to 2500 nm.

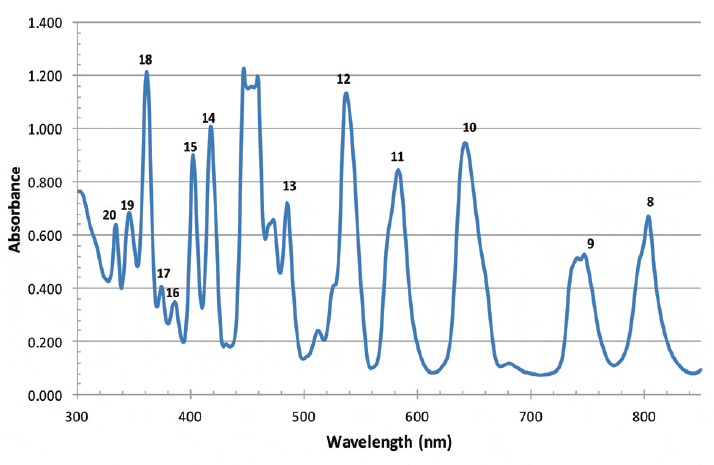

Figure 6: NIST SRM 2036 reflectance wavelength Standard reference material (SRM) measured using 8°/hemispherical spectral reflectance factor geometry (reported as absorbance or log10(1/R)) and a calibrated double-monochromator instrument from 300 nm to 800 nm (Data and spectrum used with permission from Avian Technologies, New London, NH).
An excellent summary paper is given related to reference standards in the NIR region (10). It includes details of the following standards: high-pressure mercury arc, water vapor, gas standards SRM 2517, SRM 2519. Also covered are solid materials SRM 1920, SRM 2035, SRM 2036; McCrone M-27 and M-42; and polystyrene. Liquids described include 1,2,4 trichlorobenzene and methylene chloride. For this column, we will describe polystyrene and NIST SRM 1920a rare earth oxide standards.

Polystyrene Reference Standard
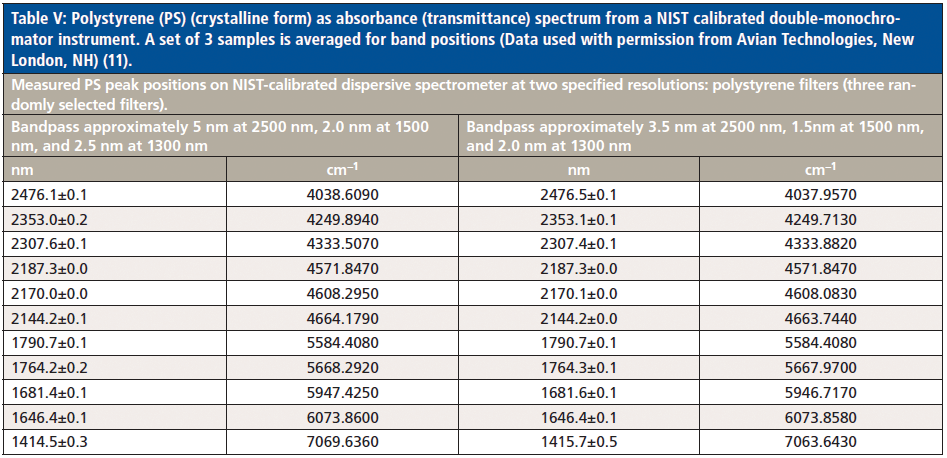
Polystyrene in a highly crystalline structure is a useful wavelength or wavenumber standard for NIR spectrophotometers. It provides a number of useful bands to verify or align the wavelength axis for all types of NIR instrumentation. The specific wavelengths and wavenumbers used for verification and calibration of the spectrophotometer x-axis measurements using polystyrene are illustrated in Figures 7 and 8, and described with resolution details in Tables IV–V (11).

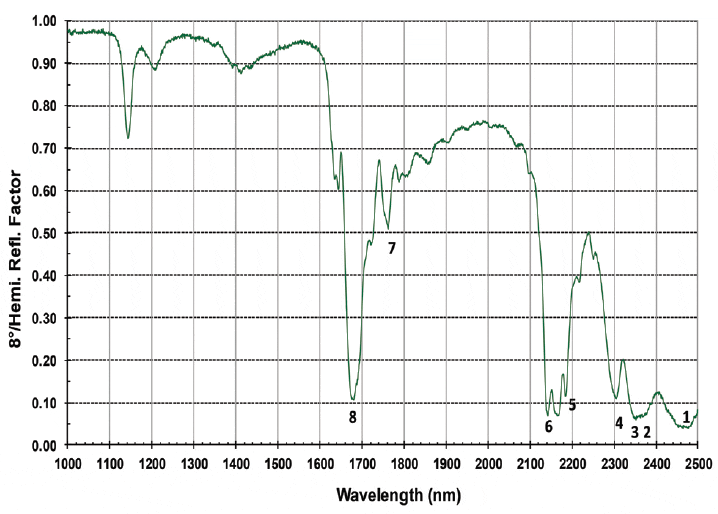
Figure 7: Polystyrene (crystalline form) as a reflectance spectrum, 1.0 mm thickness (Spectrum used with permission from Avian Technologies, New London, NH).
For Figures 7–8 and Tables IV–V, 1.0-mm thick polystyrene samples of 28 mm diameter were measured using a PerkinElmer Lambda-9/19 UV-vis-NIR spectrometer with traceability of measurements to: ASTM Test Method E 1331-96, ASTM Test Method E903-96, NRC Certificate PO1948 (didymium oxide glass), NRC Certificate Cal PAR-2008-2614 (holmium oxide filter), NIST SRM 1920a, and NIST SRM 2036. Traceability to NIST is achieved through NORAMET, the North American Metrological Agreement (11).

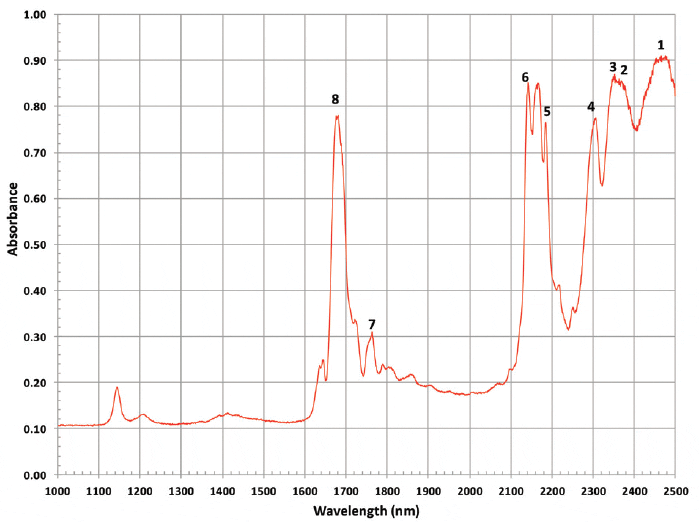
Figure 8: Polystyrene (crystalline form) as absorbance (from reflectance) measurement, 1.0 mm thickness (Spectrum used with permission from Avian Technologies, New London, NH).
Measurement conditions are mean temperature of 21.9 °C with relative humidity at 45%. The instrumental parameters are: bandpass, n/a NIR sensitivity corresponding to a bandpass approximately 1.5 nm from 1000–2500 nm); reporting interval, 1 nm; recording interval, 1 nm; scan speed, 60 nm/min; integration time, 1 s; number of measurements averaged, 6; measurement range, 1000–2500 nm. The instrument was set up in 8° hemispherical geometry with the sample positioned normally to the beam. NIR sensitivity of 3 and scan speed of 1 nm/s were used with peak picking at a 0.1-nm interval over the wavelength range of 1000–2500 nm.


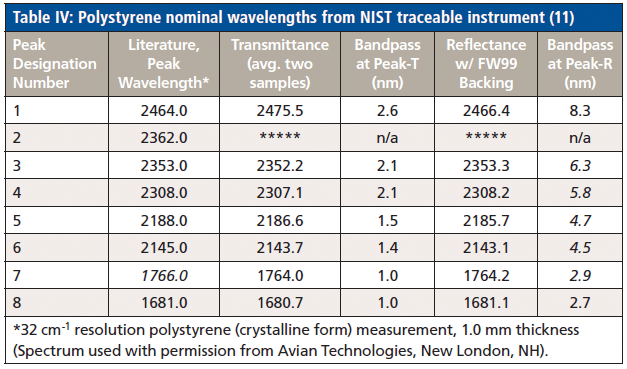
Table IV: Polystyrene nominal wavelengths from NIST traceable instrument (11)
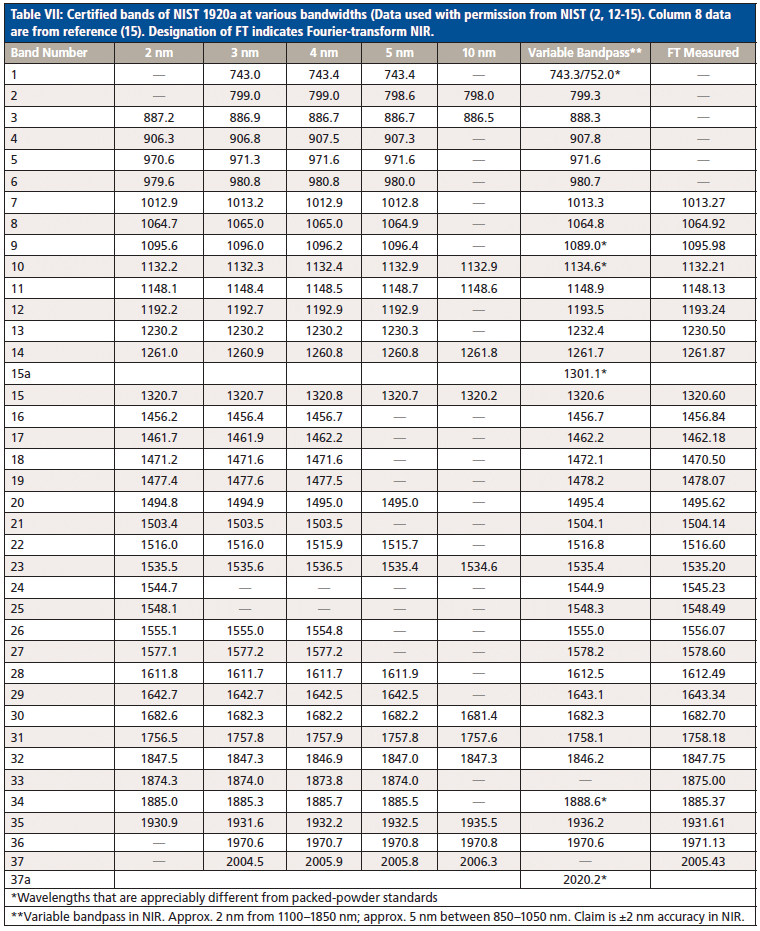
SRM 1920a Former Reference Standard
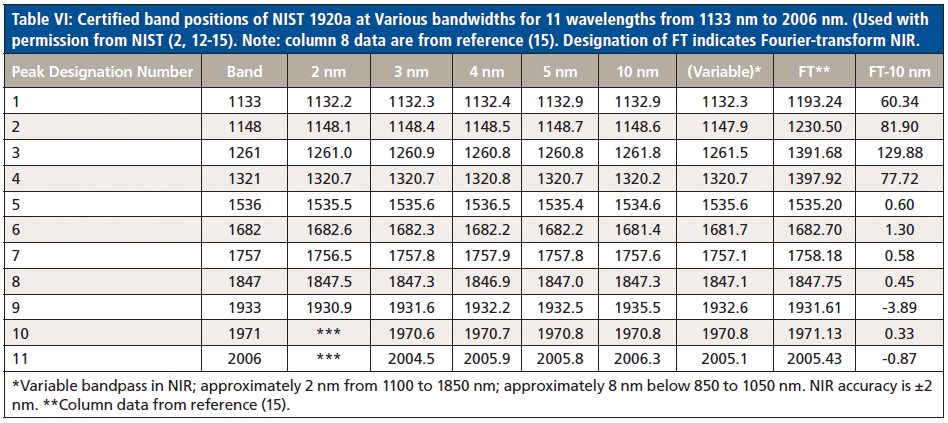
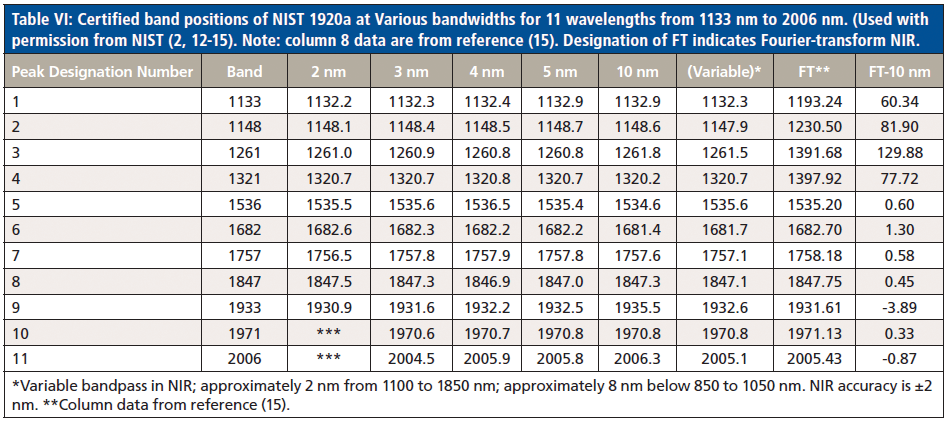
SRM 1920a is a discontinued SRM that is still used for verification and calibration of the NIR wavelength scale from 740 to 2000 nm. It is applicable for reflectance spectrophotometers or reflectometers using hemispherical geometry. It consisted of a mixture of three rare earth oxides (REOs) as dysprosium oxide (Dy2O3), erbium oxide (Er2O3), and holmium oxide (Ho2O3) that is pressed into a cylindrical cavity with an NIR transmitting sapphire widow. The outer dimensions of the standard are 51 mm in diameter and 12 mm in height. The inner dimensions of the powder-holding cavity are 30 mm in diameter by 6 mm in depth. The SRM samples were calibrated using the NIST high precision spectrophotometer. The spectra of a replicate mixture are shown in Figures 9 and 10; with the verified wavelengths for various bandwidths given in Tables VI and VII (11,12).


Infrared (IR) Wavenumber Measurement Standards
The infrared spectral region is generally considered to cover from 2500 to 25,000 nm (4000 cm-1 to 400 cm-1).

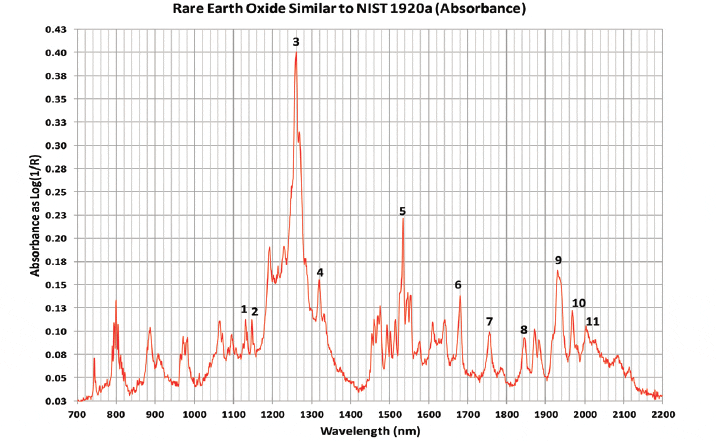
Figure 9: Rare earth oxide similar to NIST SRM 1920a as absorbance (from reflectance) spectrum from a NIST calibrated double-monochromator instrument (Data used with permission from Avian Technologies, New London, NH).
NIST Wavenumber Standard Reference Material for Infrared
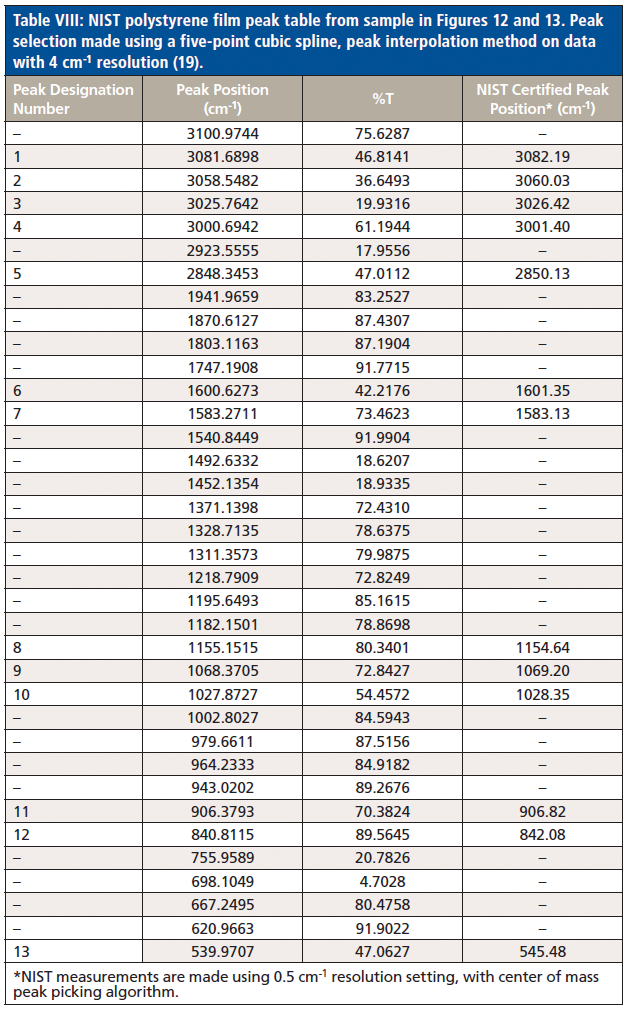
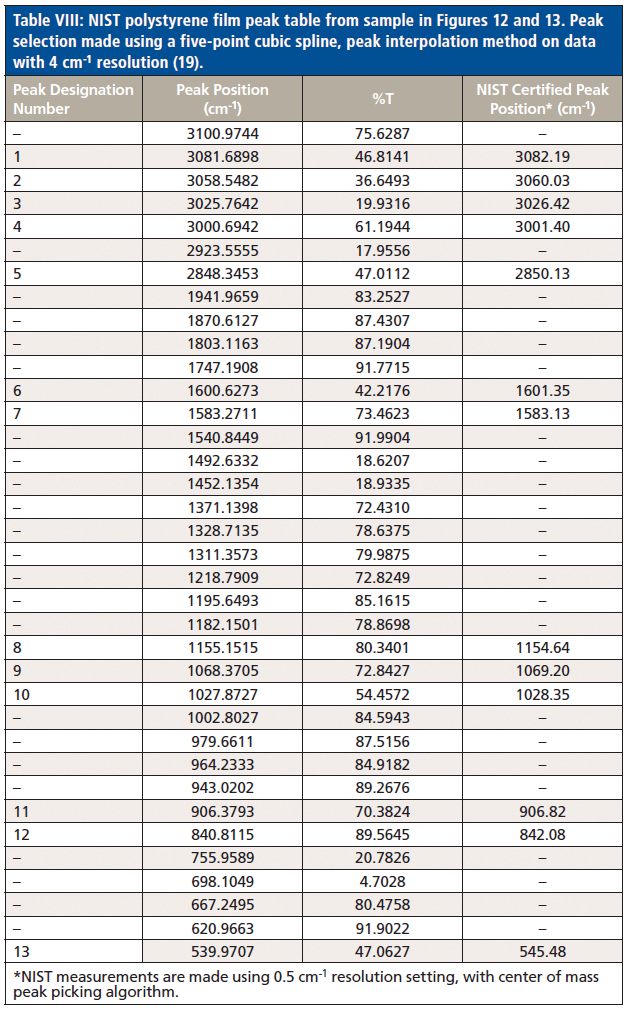
The available NIST standard for infrared (IR) measurements is NIST SRM 1921b, IR Transmission Wavelength (Polystyrene Film), and comes as a card-mounted polymer film. This standard is useful for measurements from 3.2 to 18.5 µm, 3200 nm to 18,500 nm, or 3125.0 to 540.5 cm-1 (wavenumbers). The physical dimensions of SRM 1921b consists of a matte finish polystyrene film approximately 38 µm thick with a 25 mm diameter exposed area, centered 38 mm from the bottom of a cardboard holder, which is 5 cm by 11 cm by 0.2 cm in size (14,16–18). The spectra of the polystyrene film are displayed in Figures 11–13, with the verified peak positions in wavenumbers given in Table VIII.

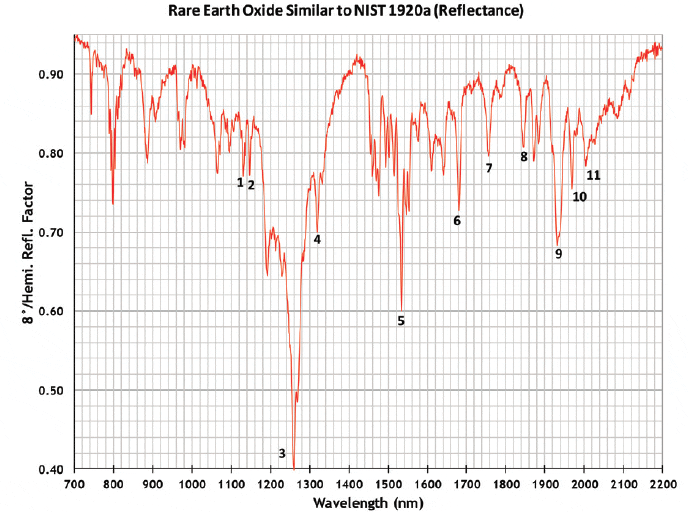
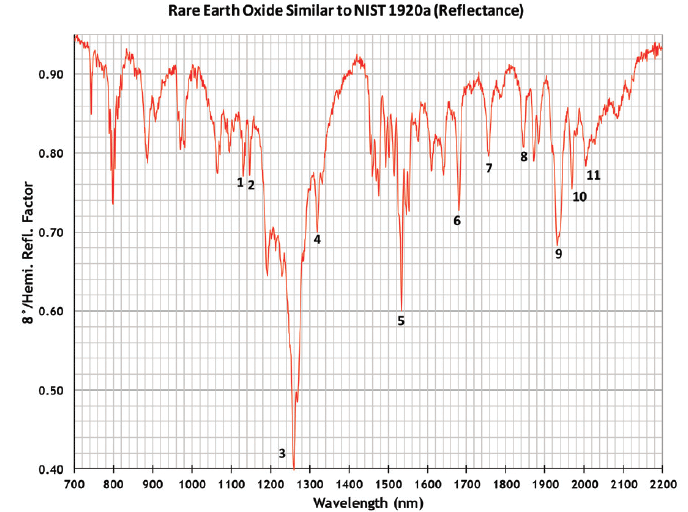
Figure 10: Rare earth oxide similar to NIST SRM 1920a as a reflectance spectrum from a NIST calibrated double-monochromator instrument (Data used with permission from Avian Technologies, New London, NH).
Raman Wavenumber Standards
The Raman region overlaps the infrared region as 2500 to 25,000 nm (4000 cm-1 to 400 cm-1); with the Raman spectral region referred to as the Stokes shift being from 2857 to 200,000 nm or 3500 cm-1 to 50 cm-1.

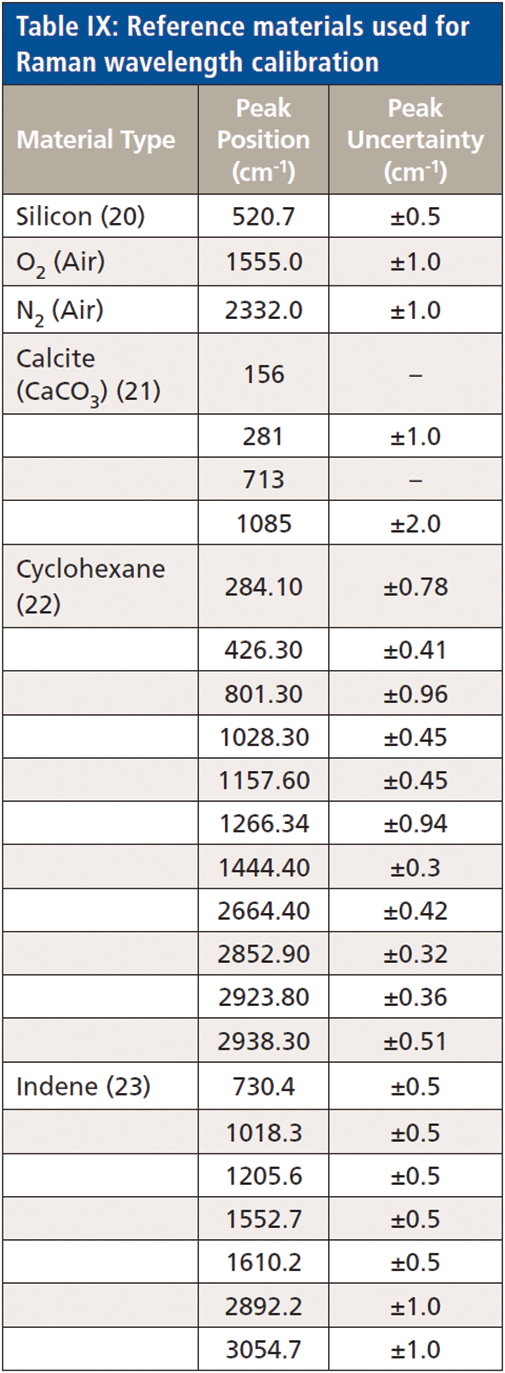
Wavenumber Standard Reference Material for Raman
Several standard materials are recommended for alignment of the Raman wavenumber axis. These include those listed in Table IX (20–24). A virtual spectrum of a silicon wafer is shown in Figure 14 with a sharp peak at 520.7 cm-1. Table IX refers to multiple materials used to verify or calibrate a Raman spectrometer wavenumber scale. Figure 14 shows a virtual silicon wafer spectrum.

Summary
A variety of materials exist for the important characteristic of aligning or testing the wavelength or wavenumber axis for spectrophotometers from the ultraviolet through infrared regions, and Raman. X-axis alignment and maintenance is a critical step required for the reasonable application of quantitative and qualitative analysis using spectroscopic methods. The assumption for all analytical methods using spectrometers is that the x-axis, representing unique data channels, be constant, with only the amplitude changing with respect to analyte concentration. All chemometrics relies on the assumption of a precisely aligned x-axis for analytical techniques in order to compare data for the purposes of calibration and analysis.


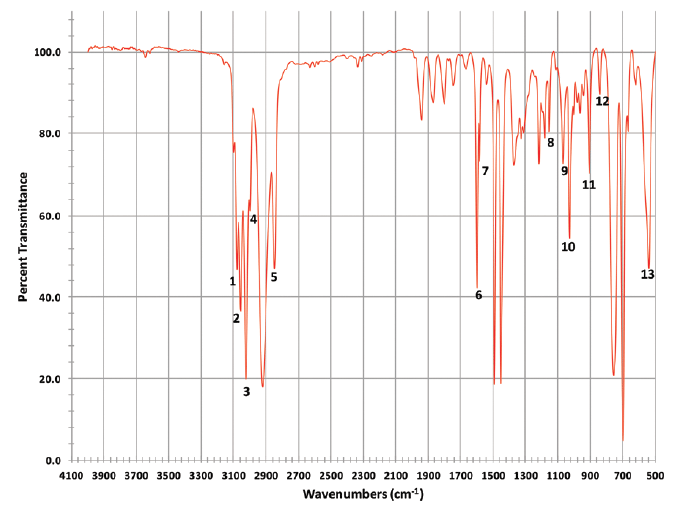
Figure 11: Polystyrene film measured in transmittance with film holder and 4 cm-1 resolution, 64 co-added scans per spectrum, Nicolet Model 510 FT-IR Spectrometer (from the authors).


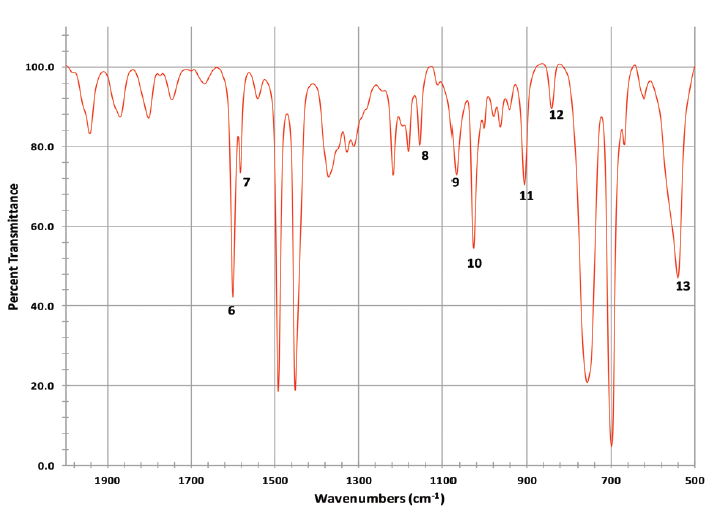
Figure 12: Close-up of extended fingerprint region from Figure 11: Polystyrene film measured in transmittance with film holder and 4 cm-1 resolution, 64 co-added scans per spectrum, Nicolet Model 510 FT-IR Spectrometer (from the authors).


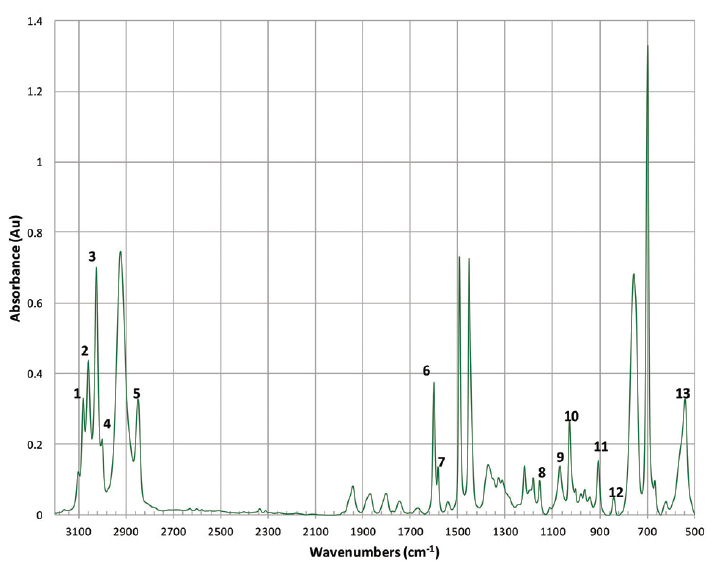
Figure 13: Polystyrene film converted to absorbance from transmittance spectrum with film holder and 4 cm-1 resolution, 64 co-added scans per spectrum, Nicolet Model 510 FT-IR Spectrometer (from the authors).

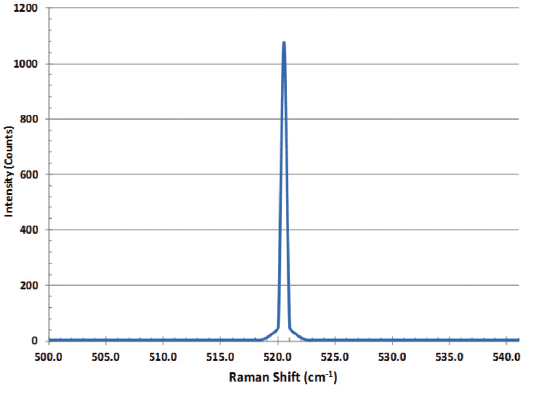
Figure 14: Virtual silicon wafer spectrum with sharp peak at 520.7 cm-1 (wavenumbers). Other wavenumber standards include naphthalene, 1,4 bis (2-methylstyryl) benzene (BMB), sulfur, 50/50 (v/v) toluene/acetonitrile, 4-acetamidophenol, benzonitrile, and polystyrene (24); polystyrene is suggested as well. Note infrared spectra of polystyrene are given in Figures 11 through 13, with a table of wavenumber peaks (Table VIII).


References
(1) Reference spectra and data provided with permission by Starna Ltd., Hainault, IG6 3UT, UK. www.starna.com.
(2) J. Workman, Ed., The Concise Handbook of Analytical Spectroscopy: Physical Foundations, Techniques, Instrumentation and Data Analysis. In 5 Volumes, UV, Vis, NIR, IR, and Raman (World Scientific Publishing-Imperial College Press, New Jersey and Singapore, 2016), vol. 1, pp. 163–214; vol. 2, pp. 217–278; vol. 3, pp. 363–424; vol. 4, pp. 323–360; vol. 5, pp. 229–250. ISBN-13: 978-9814508056. (Permission from NIST for data and spectra related to SRM materials).
(3) Each table refers to specific NIST SRM datasheets and published references and as referred in Reference (2).
(4) Standard Reference Material (SRM)® 2034 Certificate, "Holmium Oxide Solution Wavelength Standard (240 nm to 650 nm)," National Institute of Standards and Technology, Gaithersburg, MD 20899, 7 pages, Certificate Issue Date: (29 August 2016).
(5) H. J. Keegan, J.C. Schleter, V.R. Weidner, J. Opt. Soc. Am, 51, 1470 (1961).
(6) J. McNeirney, W. Slavin, Applied Optics, 1(3), 365–367 (1962).
(7) D. W. Allen, J. Res. Natl. Inst. Stand. Technol. 112, 303–306 (2007).
(8) Standard Reference Material (SRM)® 2036 Certificate, "Near-Infrared Wavelength-Wavenumber Reflection Standard," National Institute of Standards and Technology, Gaithersburg, MD 20899, 7 pages (24 January 2013).
(9) S.J. Choquette, D.L. Duewer, L.M. Hanssen, E.A. Early, Appl. Spectrosc. 59(4), 496–504 (2005).
(10) C. Burgess, J. Hammond, Spectroscopy 22(4), 40 (2007).
(11) Spectrum and data used with permission from Avian Technologies, New London, NH.
(12) Standard Reference Material (SRM)® 1920a Certificate, "Near-infrared Reflectance Wavelength Standard from 740 nm to 2000 nm," National Institute of Standards and Technology, Gaithersburg, MD 20899, 6 pages (20 Feb. 2004).
(13) V.R. Weidner, P.Y. Barnes, and K.L. Eckerle, J. Research NBS, 91(5), 243-253 (1986).
(14) NIST SRM website: URL at http://www.nist.gov/srm/index3column.cfm
(15) T. Isaksson, H. Yang, G.J. Kemeny, R.S. Jackson, Q. Wang, M.K. Alam, P.R. Griffiths, Appl. Spectrosc. 57(2), 176-185 (2003).
(16) D. Gupta, L. Wang, L. M. Hanssen, J.J. Hsia, and R.U. Datla, "Polysytrene Films for Calibrating the Wavelength Scale of Infrared Spectrophotometers SRM 1921," NIST Special Publication 260-122, National Institute of Standards and Technology, Gaithersburg, MD, 25 pages, Certificate Issue Date: (April 1995).
(17) Standard Reference Material (SRM)® 1921 Certificate, "Infrared Transmission Wavelength Standard," National Institute of Standards and Technology, Gaithersburg, MD 20899, 6 pages, Certificate Issue Date: (7 April 1995).
(18) Standard Reference Material (SRM)® 1921b Certificate, "Infrared Transmission Wavelength Standard," National Institute of Standards and Technology, Gaithersburg, MD 20899, 7 pages, Certificate Issue Date: (19 February 2014).
(19) W.H. Press, S.A. Teukolsky, W.T. Vetterling, B.P. Flannery, Numerical Recipes, The Art of Scientific Computing (Cambridge University Press, Cambridge, UK, 3rd ed., 2007), pp. 120–124.
(20) J. Dubessy, M.-C.Caumon, S. Sharma, F.Rull, "Instrumentation in Raman spectroscopy, part 2: how to calibrate your spectrometer, 14 June, 2012, Raman spectroscopy applied to Earth sciences and cultural heritage," M.C. Caumon, International GeoRaman Conference, http://georaman2014.wustl.edu/ (2014).
(21) ASTM E2529 - 06(2014), "Standard Guide for Testing the Resolution of a Raman Spectrometer," Book of Standards Volume: 03.06, ASTM International, 100 Barr Harbor Drive, PO Box C700, West Conshohocken, PA, 19428-2959 USA (2014).
(22) ASTM E1840-96(2014) , "Standard Guide for Raman Shift Standards for Spectrometer Calibration," Book of Standards Volume: 03.06, ASTM International, 100 Barr Harbor Drive, PO Box C700, West Conshohocken, PA, 19428-2959 USA (2014).
(23) J. R. Ferraro and K. Nakamoto, Introductory Raman Spectroscopy (Academic Press, Boston, 1st ed., 1994).
(24) The Richard McCreery Research Group provides the greatest detail of information for Raman spectroscopy at the following link: http://www.chem.ualberta.ca/~mccreery/ramanmaterials.html.


Jerome (Jerry) Workman Jr.

Jerome (Jerry) Workman Jr. serves on the Editorial Advisory Board of Spectroscopy and is the Senior Technical Editor for LCGC and Spectroscopy. He is also a Certified Core Adjunct Professor at National University in San Diego, CA and a Principal at Biotechnology Business Associates. He was formerly the Executive Vice President of Research and Engineering for Unity Scientific and Process Sensors Corporation.


Howard Mark

Howard Markserves on the Editorial Advisory Board of Spectroscopy and runs a consulting service, Mark Electronics, in Suffern, New York. Direct correspondence to: SpectroscopyEdit@UBM.com