Chemometric Modeling of Methanol in Tertiary Mixtures Using a High Resolution Portable Raman Spectrometer
Raman is a well-developed and implemented qualitative spectroscopic tool for molecular identification, but in recent years with the development of high resolution portable Raman spectrometers and cutting edge chemometric modeling, software has now enabled the use of Raman for highly precise quantitative measurements of mixtures and reactions.
Travis Thompson, Dawn Yang, and Robert Chimenti, B&W Tek, Inc.
Raman is a well-developed and implemented qualitative spectroscopic tool for molecular identification, but in recent years with the development of high resolution portable Raman spectrometers and cutting edge chemometric modeling, software has now enabled the use of Raman for highly precise quantitative measurements of mixtures and reactions. In this study, we have used B&W Tek's advanced chemometric modeling software BWIQ™ to determine unknown methanol concentrations in a tertiary mixture of methanol, acetonitrile, and water.
BWIQ is a multivariate analysis software package which can analyze spectral data and discover internal relationships between spectra and response data or spectra and sample classes. BWIQ combines traditional chemometric methods such as partial least squares regression (PLSR) and principal component analysis (PCA), with new methods such as adaptive iteratively reweighted penalized least squares (airPLS) algorithms for automatic baseline correction and support vector machine (SVM) algorithms for non-linear datasets.
Experiment and Results
For this study, the i-Raman® from B&W Tek, was chosen due to the fact that it is the highest resolution (~3 cm-1) portable Raman spectrometer on the market. This, in conjunction with its TE cooled CCD and convenient fiber optic probe, was coupled to the BCR100A double-pass cuvette holder.
Known methanol, acetonitrile, and water standards were prepared for development of a calibration curve using 10 mm disposable cuvettes. All measurements were taken under the following conditions: 532 nm excitation wavelength set to ~30 mW power output, and an integration time of 7.5 s. No averaging was used in this experiment and all spectra represent a single acquisition.
A total of 94 spectra were collected with varying concentrations of the three components. Once the data was collected, it was entered into BWIQ. Out of 94 total spectra entered in, 70 were randomly chosen for use in creating the calibration curve and the remaining 24 were used for validation. The data was then preprocessed by first conducting an airPLS baseline correction, then smoothing using the Sovitzky-Golay method, and taking a Sovitzky-Golay 1st differential. Finally, the calibration curve was created using PLS1 regression.
After applying preprocessing and regression to the data, the measured vs. predicted concentrations were plotted to determine the accuracy of the model. The R2 value was calculated to be greater than 0.999 for both the measured and predicted concentrations. Similarly, the RMSE was calculated to be less than 0.008 for both.
Lastly, samples were prepared with unknown methanol concentrations in a tertiary mixture of methanol, acetonitrile, and water. These samples were then measured by the i-Raman and fed into BWIQ, which successfully determined the concentration using the previously developed model.
Conclusions
From this experiment, we have shown that the i-Raman high resolution portable Raman spectrometer can be used with BWIQ to successfully develop a quantitative model to determine the concentration of methanol in tertiary mixtures of methanol, acetonitrile, and water, as shown in Figure 1. For more information please visit www.bwtek.com or call +1 (302) 368-7824.

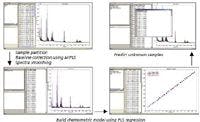
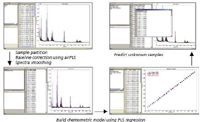
Figure 1: Chemometric analysis workflow.
B&W Tek, Inc.
19 Shea Way, Newark, DE 19713
tel. (302) 368-7824; Fax: (302) 368-7830
Website: www.bwtek.com


Single Cell and Microplastic Analysis by ICP-MS with Automated Micro-Flow Sample Introduction
April 25th 2024Single cell ICP-MS (scICP-MS) is increasingly seen as a powerful and fast tool for the measurement of elements in individual cells, mainly due to the high sensitivity and selectivity of ICP-MS. Analysis is performed in the same way as single nanoparticle (spICP-MS) analysis, which has become a well-established technique for the analysis of nanoparticles and particles.
Hot News on Agilent LDIR, New Developments, and Future Perspective
April 25th 2024Watch this video featuring Darren Robey and Dr. Wesam Alwan from Agilent Technologies to gain insights into the future trends shaping microplastics research and the challenges of their characterization. Discover the essential components necessary for accurate microplastics analysis and learn how the Agilent 8700 LDIR system addresses these challenges. Offering rapid and precise analysis capabilities, along with easy sample preparation methods that minimize contamination, the Agilent 8700 LDIR system is at the forefront of advancing microplastics research.
The World of Microplastics Up to Date – an Overview
April 23rd 2024Watch this 20-minute educational video by Andreas Kerstan, Agilent Product Specialist in molecular spectroscopy, to gain a comprehensive update on the microplastics landscape and the environmental concerns related to them. Discover the current challenges in microplastics characterization and how Agilent innovative solutions and techniques, including FTIR, LDIR, GC/MS, and ICP-MS, are addressing these issues head-on.


