Article
Combining Raman Imaging, Mass Spectrometry Imaging, and AFM
Imaging techniques using vibrational spectroscopy, mass spectrometry (MS), and atomic force microscopy have all been advancing and gaining momentum in recent years. There is great potential power in these imaging techniques, particularly in the biomedical field. Thomas Bocklitz of at the Friedrich-Schiller-University Jena is working to better harness the power of these techniques by combining them.
Imaging techniques using vibrational spectroscopy, mass spectrometry (MS), and atomic force microscopy have all been advancing and gaining momentum in recent years. There is great potential power in these imaging techniques for a range of applications, but one of the most exciting is in the biomedical field. Thomas Bocklitz of at the Friedrich-Schiller-University Jena (Jena, Germany) is working to better harness the power of these techniques by combining them. He recently spoke to us about this work, for which he won the 2015 Bruce Kowalski Award in Chemometrics from the Society for Applied Spectroscopy. This interview is part of our 2015 FACSS–SciX interview series.
In a recent study (1), you combined Raman microscopic imaging and matrix-assisted laser desorption–ionization time-of-flight mass spectrometry (MALDI-TOF-MS) imaging for the analysis of biological tissue (mouse brain). Why did you decide to combine these two techniques specifically?
We combined these two techniques (Raman microscopic imaging and MALDI-TOF-MS imaging) to achieve two aims. First, we think that two techniques result in a more comprehensive view of biological tissue, because we can use two information types together. The other goal was to understand Raman spectra from biological tissue in a better way, using the more specific MALDI-TOF mass spectra.
After you performed MALDI-TOF and Raman imaging separately, you began the correlation of the data with a first step called “registration”-essentially aligning the images. What challenges are involved in this step?
The registration step is the mathematical alignment of two images based on a marker that reflects the alignment quality. The challenges are that a transformation has to be found that transforms the values of one image to the reference system of the other. In this study, the additional problem occurs that both images are hyperspectral images, which means that hundreds of images have to be aligned, not just one image.
The next, and key, step in the process is correlation and interpretation of the combined data. What complications arise in this process?
The main complications in this step are not technical problems, but practical problems that occur in all multidisciplinary research: Researchers with expertise in three areas, namely, Raman spectroscopy, MALDI-MS, and biology, have to come together and combine their knowledge.
Previous methods combining mass spectrometry and vibrational spectroscopy techniques only provided qualitative information. In your work, you present a methodology for quantitative comparison, which you call “quantitative correlation.” What is “quantitative correlation” and how did you achieve it?
We used this term to point to the fact that with our approach we could use spectral information within a certain point of the image together and we could do that in quantitative manner. For example, we could use the information within the m/z 703 to train a regression model based on the Raman spectra. I would like to point out that this does not mean that a qualitative correlation is less important than our approach. The different terms should only differentiate the two approaches.
What do you feel are the biggest benefits of this approach?
The biggest benefit is that with this approach Raman spectroscopic information and MALDI spectrometric information can be used together and produce a comprehensive view of biological tissue. This might lead to new insights and combined markers for diseases.
In another study (2), you combined AFM and image analysis to distinguish five virus species, such as for infectious disease diagnosis. In this method, you used the “image moment method” to analyze the images recorded by AFM, in which the morphology of the image is translated into quantitative features-such as height, volume, and area-that are subsequently statistically analyzed. What are the advantages of AFM for analyzing viruses compared with other microscopy techniques such as electron microscopy and scanning tunneling microscopy?
I agree that the standard techniques to investigate viruses are electron microscopy and scanning tunneling microscopy. Nevertheless, these techniques require a demanding sample preparation protocol: either a vacuum has to be produced or a metal film or labeling has to be applied. Both preparation protocols change the sample drastically, which is not the case for AFM, which can measure non-dry samples.
In addition to this advantage, another point is worth mentioning. Our aim is to combine the information from AFM with tip-enhanced Raman spectroscopy (TERS) and with our image analysis routines; such a combination seems possible.

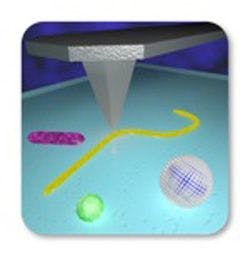
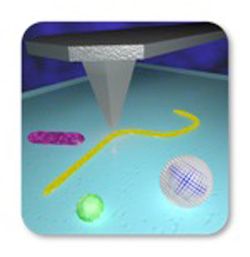
Figure 1: A visualization of virus detection based on AFM. The tip is rastering the sample and producing a topographic “height” image. The structures are schematic drawings of the virions (virus particles).
What were the challenges in the statistical analysis?
The challenge within this framework is that the mathematics behind it are by no means trivial. Once this challenge is handled, the rest is combining all measurement and analysis steps.
Do you believe that it would be possible to develop an automated virus determination method based on this approach?
Yes, I think it will be possible. The question is only on which height of the viral classification it will work. I would guess that the virus family can be predicted from AFM measurements with a good accuracy, but further research has to prove that.
What are the next steps in your research?
The next steps will be to continue both examples noted above. Manuscripts on this work have already been submitted and I hope they will be accepted. Beside this, I am working on two more exciting topics: We are trying to extract relevant biomedical information from nonlinear multicontrast microscopic images, and we are working on standardization of Raman spectroscopic measurements. Both research topics are important investigations to bring the technology (Raman spectroscopy and nonlinear multicontrast microscopy) into clinics as a standard procedure.
References
(1) T.W. Bocklitz, A.C. Crecelius, C. Matthäus, N. Tarcea, F. Eggeling, M. Schmitt, U.S. Schubert, and J. Popp, Anal. Chem.85(22), 10829–10834 (2013). doi: 10.1021/ac402175c.
(2) T. Bocklitz, E. Kämmer, S. Stöckel, D. Cialla-May, K. Weber, R. Zell, V. Deckert, and J. Popp, J.Struct. Biol. 188(1), 30–38 (2014). ISSN 1047-8477. doi: 10.1016/j.jsb.2014.08.008. URL http://www.sciencedirect.com/science/article/pii/S1047847714001841.
Newsletter
Get essential updates on the latest spectroscopy technologies, regulatory standards, and best practices—subscribe today to Spectroscopy.


