Electromagnetic Radiation, Spectral Units, and Alkanes
Interpreting infrared spectra is fun, but to do it properly one must be grounded in theory, which might be not so enjoyable for some. To cover theory and interpretation judiciously, this installment (and the next several installments) will begin with a section on theory and end with coverage of interpreting spectra. Here, we introduce the theory behind light and spectral units and the interpretation of methyl and methylene groups contained in straight alkane chains.
Volume 30 Number 4 Pages 18-23
Interpreting infrared spectra is fun, but to do it properly one must be grounded in theory, which might be not so enjoyable for some. To cover theory and interpretation judiciously, this installment (and the next several installments) will begin with a section on theory and end with coverage of interpreting spectra. Here, we introduce the theory behind light and spectral units and the interpretation of methyl and methylene groups contained in straight alkane chains.
For many, the fun part of infrared (IR) spectral interpretation is determining unknown chemical structures from spectra. To do this requires a proper theoretical grounding that some may find not so enjoyable. I could easily fill the first installments of this column with theory, but that would postpone the fun. I will take a middle tack and begin each installment with a section on theory and conclude each column with a discussion of the interpretation of one or more functional groups. This installment discusses the theory of electromagnetic radiation, and the interpretation of the infrared spectra of straight-chain alkanes.
Electromagnetic Radiation and Spectral Units
Infrared radiation is a type of electromagnetic (EM) radiation. EM radiation consists of two waves called the electric vector and the magnetic vector, which undulate through space in mutually perpendicular planes. The term "light" is sometimes used to refer only to EM radiation that can be detected with the naked eye. For simplicity though, I will refer to any type of EM radiation as light.
When the electric vector of light interacts with molecules absorbance can take place (1). A plot of the magnitude of an electric vector versus time, and the definition of a cycle are shown in Figure 1.

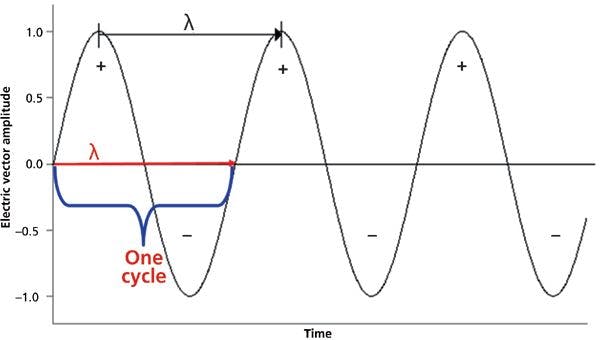
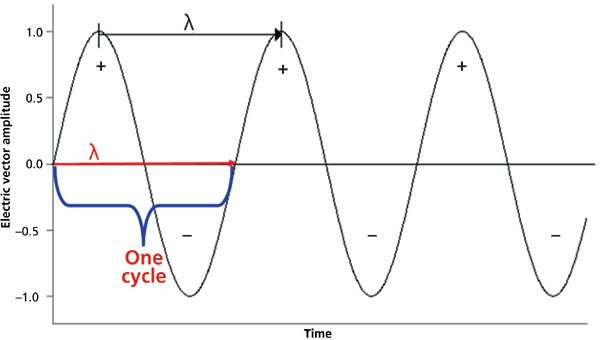
Figure 1: A plot of the amplitude of the electric vector of an electromagnetic wave versus time. The distance traveled forward during one cycle is the wavelength, λ.
A cycle begins when a wave is at zero amplitude. To complete a cycle the wave must rise then fall, cross zero amplitude a second time, fall then rise, and upon reaching zero a third time the cycle ends. The distance forward traveled by the wave during a cycle, denoted by the red bracket in Figure 1, is the definition of the wavelength λ. The units of the wavelength are length/cycle (1). However, it is almost always denoted in units of length.
In the older IR literature, spectra were plotted with wavelength on the x-axis, frequently from 2.5 to 25 μm. More recently, the convention has been to plot the x-axis of IR spectra in wavenumber units. The wavenumber measures the number of cycles a wave undergoes per unit length, and is denoted in cycles/distance. However, wavenumber units are typically written in units of inverse length such as cm-1. The term cm-1 may be pronounced "reciprocal centimeters," "inverse centimeters," "wavenumbers," or the wholly incorrect "frequency." In this column, all spectra are plotted in wavenumber units. Since wavelengths are in units of length/cycle, and wavenumbers are in units of cycles/length, the two are related to each other as follows:

where W = wavenumber and λ = wavelength.
Converting between wavelength and wavenumber for a displayed spectrum is accomplished using a few mouse clicks with most standard Fourier transform infrared (FT-IR) software packages.
IR spectra are typically plotted with two different y-axis units, absorbance and transmittance. The IR spectrum of polystyrene plotted in absorbance is seen in Figure 2.

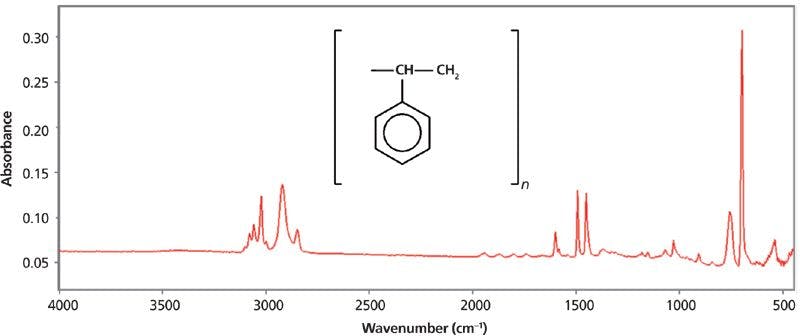
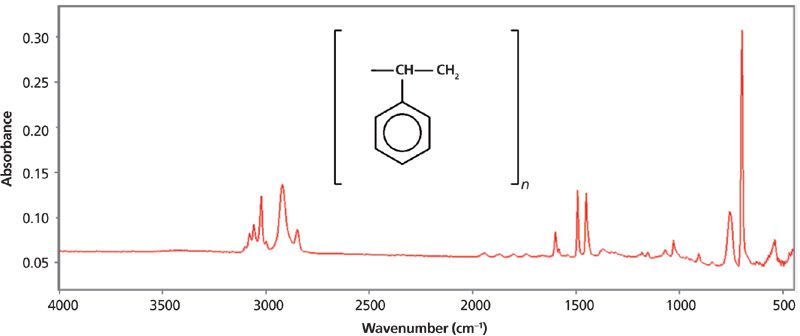
Figure 2: The IR spectrum of polystyrene plotted in absorbance units.
Absorbance measures the amount of light absorbed by a sample. It is calculated using the following equation:

where A = absorbance, I0 = intensity in the background spectrum, and I = intensity in the sample single beam spectrum. Note in Figure 2 that absorbance peaks point up.
In FT-IR, the background spectrum is run with no sample present and measures the contribution of the instrument and environment (the background contribution) to the spectrum. The sample single beam spectrum is measured with the sample in the IR beam, and consists of the background and instrument contributions. By dividing the intensities of the two spectra at each wavenumber the background contribution cancels (ideally) and the sample spectrum is obtained. The peak heights and areas in an absorbance spectrum are proportional to the concentration of molecules in a sample Thus, it is possible to use IR spectra for quantitative analysis (1).
The IR spectrum of polystyrene plotted in percent transmittance (%T) units is seen in Figure 3.


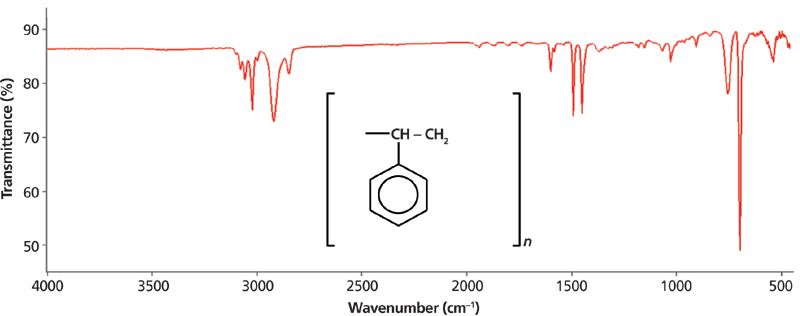
Figure 3: The IR spectrum of polystyrene plotted in transmittance (%T) units.
Transmittance measures the percentage of light transmitted by a sample, and is calculated as follows:

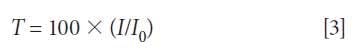
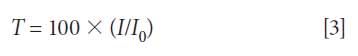
where T = transmittance, I0 = intensity in the background spectrum, and I = intensity in the sample single beam spectrum.
Like absorbance, transmittance is calculated from an intensity ratio so that the background contribution ratios out. Transmittance spectra are plotted with 0% T at the bottom, 100% T at the top, and the peaks point down. To be clear, the peak positions in Figures 2 and 3 are identical; it is only the y-axis units that have changed.
The size of the peaks in a %T spectrum are not linearly proportional to concentration, so these spectra are not typically used for quantitative analysis (1). In the IR literature, spectra are plotted in both absorbance and %T units. These two units are mathematically related to each other, and converting between them for a displayed spectrum usually requires only one or two mouse clicks. In this column spectra will be published in absorbance and transmittance so you can learn to read spectra plotted in both units. The author has a personal preference for absorbance units because they are the proper units to use for quantitative analysis, spectral subtraction, and library searching (2).
Infrared Spectral Interpretation of Straight-Chain Alkanes
Since IR spectroscopy is typically used to measure the spectra of organic compounds, some knowledge of organic chemistry is required to properly interpret IR spectra. Since not all readers are experts in organic chemistry, for each functional group I discuss there will be a section on the structure and nomenclature of that functional group.
A straight-chain alkane is an organic chemical structure that consists of a string of CH2 groups terminated at both ends by a CH3 group. A CH3 group is called a methyl group, and a CH2 group is called a methylene group. The structure of a generic straight-chain alkane is seen in Figure 4.


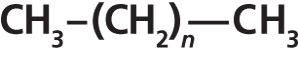
Figure 4: A generic chemical structure for straight-chain alkanes (n = 0, 1, 2, . . .).
As discussed in the last installment of this column (3), when chemical functional groups absorb IR radiation they vibrate. When methyl groups absorb light of the appropriate energy they can undergo asymmetric and symmetric C-H stretching vibrations as seen in Figure 5 (most vibrations involve all the atoms in a functional group, but for clarity going forward I will generally illustrate only the motions of the atoms in those chemical bonds discussed in the text.)


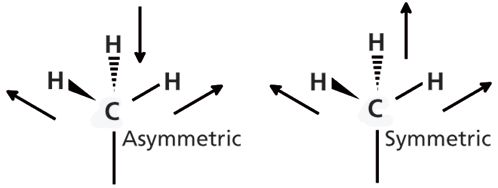
Figure 5: The movement of the hydrogen atoms during the asymmetric and symmetric C-H stretches of the methyl group.
The IR spectrum of the straight-chain alkane hexane and the vibrational assignment of its relevant peaks are seen in Figure 6.

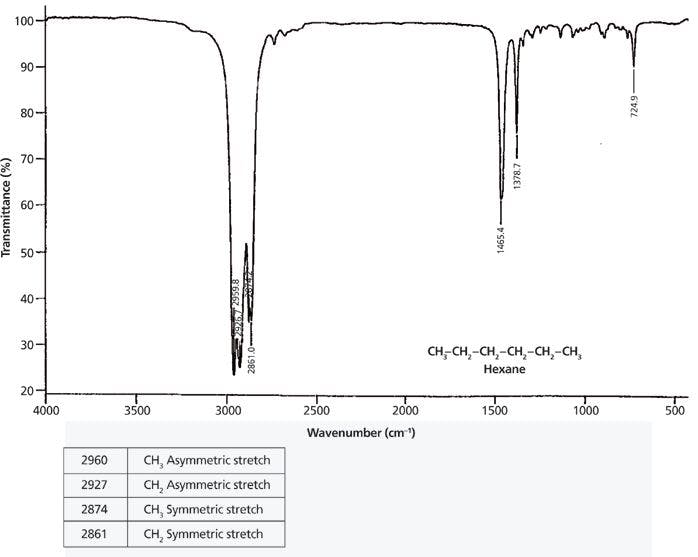

Figure 6: The IR spectrum of the straight-chain alkane hexane.
In general, the asymmetric stretching peak of methyl groups bound to a carbon atom, such as are found in straight-chain alkanes, falls at 2926 ± 10 cm-1 (4). In the spectrum of hexane, this peak is found at 2960 cm-1. The methyl symmetric stretch normally occurs at 2872 ± 10 cm-1, and is seen in Figure 6 at 2861 cm-1.
(Please note that most of the peak wavenumber ranges I will give in this column will be based on those found in my book on IR spectral interpretation [4]. Therefore, I will not cite that reference every time I quote a range found there. As I discuss in the book, all IR peak ranges have exceptions to them and none are absolute. The ranges I give will work for the majority of common chemical compounds that IR spectroscopists are likely to encounter. For more on unusual compounds or exceptions to these ranges consult these other excellent books on IR spectral interpretation [5–9].)
Methylene groups also undergo asymmetric and symmetric stretches as seen in Figure 7.


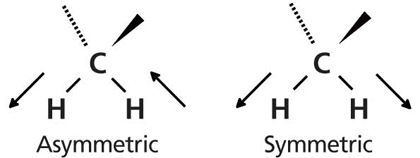
Figure 7: The motion of the hydrogen atoms during the asymmetric and symmetric stretches of a methylene group.
For CH2 groups bonded to two carbons, as is the case in straight-chain alkanes, the peak positions for the asymmetric and symmetric stretches fall at 2926 ± 10 cm-1 and 2855 ± 10 cm-1, respectively. In the spectrum of hexane in Figure 6, the methylene stretching peaks appear at 2927 cm-1 and 2861 cm-1.
Table I summarizes the C-H stretching peaks for methyl and methylene groups.


Note in Figure 6 that there is a pattern of four peaks between 3000 cm-1 and 2850 cm-1 from the C-H stretches of the methyl and methylene groups. The first two peaks are asymmetric stretches; the second pair of peaks are symmetric stretches. The first and third peaks are from the methyl group, the second and fourth peaks are from the methylene group. Whenever you see a group of four peaks like this between 3000 cm-1 and 2850 cm-1, your first thought should be that the sample contains methyl and methylene groups.
Also note in Figure 6 that the methyl and methylene symmetric stretching peaks are close together (2874 cm-1 and 2861 cm-1). In some spectra these peaks overlap, giving three peaks between 3000 cm-1 and 2850 cm-1 instead of four. In these cases, the sample still contains both methyl and methylene groups because each group by itself only has two peaks in this region. It follows then that if you observe only two C-H stretching peaks between 3000 cm-1 and 2850 cm-1 the sample contains either methyl or methylene. The peak positions observed can be used to distinguish between these two possibilities. On rare occasions, only one distinct C-H stretching peak will appear between 3000 cm-1 and 2850 cm-1, and its position will determine whether the sample contains just methyl or methylene groups.
The conclusions to draw from C-H stretching peak patterns are summarized in Table II.


There is much more to say about methyl and methylene groups, but this will have to wait until the next installment.
We are not yet in a position to fully interpret the spectrum of a straight-chain alkane; hence I will present a peak assignment problem: Examine the spectrum in Figure 8, determine from the pattern of peaks whether the sample contains methyl groups, methylene groups, or both, and then assign as many of the peaks as you can.


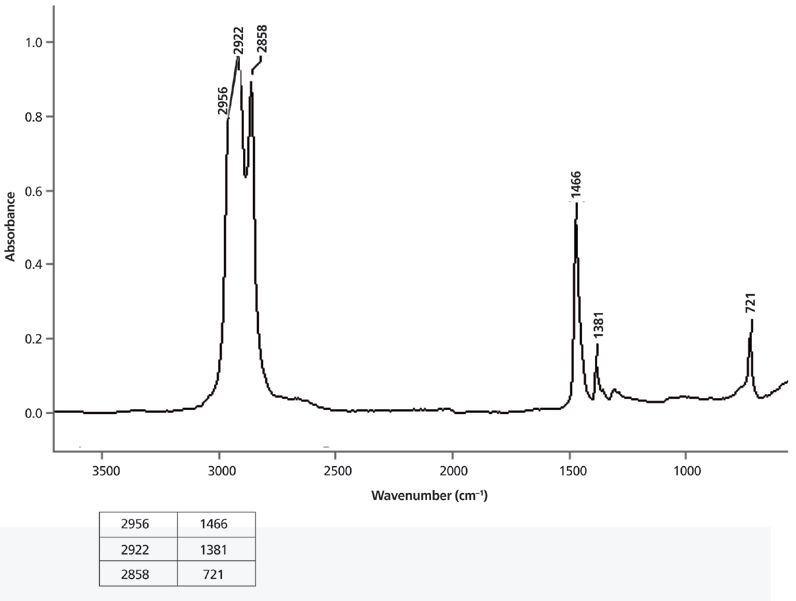
Figure 8: The IR spectrum of a solid measured as a capillary thin film melt.
In this and all subsequent problem spectra, the state of the sample (solid, liquid, or gas) and the sampling technique will be given because this information is needed to properly interpret spectra, and you would know this information if you ran the sample spectrum yourself. The correct peak assignments for these spectra will be given in the next installment. Until then . . . happy interpreting!
References
(1) B.C. Smith, Quantitative Spectroscopy: Theory and Practice (Academic Press, Boston, Massachusetts, 2002).
(2) B.C. Smith, Fundamentals of Fourier Transform Infrared Spectroscopy, 2nd Edition (CRC Press, Boca Raton, Florida, 2011).
(3) B.C. Smith, Spectroscopy30(1), 16–23 (2015).
(4) B.C. Smith, Infrared Spectral Interpretation: A Systematic Approach (CRC Press, Boca Raton, Florida, 1999).
(5) L.J. Bellamy, The Infrared Spectra of Complex Molecules, Third Edition (Wiley, New York, New York, 1975).
(6) R. Silverstein, G. Bassler, and T. Morrill, Spectrometric Identification of Organic Compounds (Wiley, New York, New York, 1981).
(7) N. Colthup, L. Daly, and S. Wiberley, Introduction to Infrared and Raman Spectroscopy (Academic Press, Boston, Massachusetts, 1990).
(8) D. Lin-Vien, N. Colthup, W. Fateley, and J. Graselli, The Handbook of Infrared and Raman Characteristic Frequencies of Organic Molecules (Academic Press, Boston, Massachusetts, 1991).
(9) G. Socrates, Infrared and Raman Characteristic Group Frequencies: Tables and Charts, 3rd Edition (Wiley, New York, New York, 2001).
Brian C. Smith, PhD, is a Senior Infrared Product Specialist for PerkinElmer, based in San Jose, California. Before joining Perkin-Elmer, he ran his own FT-IR training and consulting business for more than 20 years, and taught thousands of people around the world how to improve their FT-IR analyses and interpret infrared spectra. Dr. Smith has written three books on infrared spectroscopy: Fundamentals of FTIR and Infrared Spectral Interpretation, both published by CRC Press, and Quantitative Spectroscopy: Theory and Practice published by Academic Press. He has published a number of papers in peer-reviewed journals and is a co-inventor on a patent for an FT-IR method to monitor dust exposure in coal mines. Earlier in his career, Dr. Smith worked as a spectroscopy applications specialist at Princeton Instruments and Digilab, and as a research chemist at AT&T Bell Labs, IBM, and Xerox. Dr. Smith earned his PhD in physical chemistry from Dartmouth College.


Brian C. Smith, PhD


Measurement of Ammonia Leakage by TDLAS in Mid-Infrared Combined with an EMD-SG Filter Method
April 9th 2024In this article, tunable diode laser absorption spectroscopy (TDLAS) is used to measure ammonia leakage, where a new denoising method combining empirical mode decomposition with the Savitzky-Golay smoothing algorithm (EMD-SG) is proposed to improve the signal-to-noise ratio (SNR) of absorbance signals.


