Non-Destructive Red Wine Measurement with Dispersive 1064 nm Raman Spectroscopy
Application Notebook
Owing to technological improvements spurred on by the telecommunications boom of the last decade, Raman spectroscopy has become much more accessible to users in all application areas, including agricultural, forensic, pharmaceutical, biomedical, and others.
Owing to technological improvements spurred on by the telecommunications boom of the last decade, Raman spectroscopy has become much more accessible to users in all application areas, including agricultural, forensic, pharmaceutical, biomedical, and others. However, there remains a struggle to extract useful Raman spectra from fluorescent and luminescent samples.
Most users with fluorescent samples switched to near-infrared wavelengths such as 785 nm and 830 nm to avoid fluorescence. But now, BaySpec's new dispersive 1064 nm Raman spectrometer family offers a turn-key solution combines the speed, sensitivity, and ruggedness of the dispersive Raman instruments with superior fluorescence avoidance of traditional FT-Raman.
Any new method for routine determination of chemical composition in beverage manufacturing processes should be non-invasive, non-destructive, and rapid. Raman spectroscopy offers the advantages of minimal sample preparation and fast spectral collection. However, the pigments in red wines are usually too fluorescent to allow Raman to be measured, even at 785 nm. But at 1064 nm, a clear Raman spectrum is generated while florescence background is almost totally avoided.


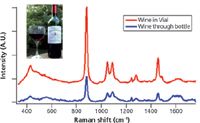
Figure 1: Identification of methanol in red wine based on its unique Raman features different from ethanol.
Further, glass is mostly transparent to NIR wavelengths, compared to 532 nm and 785 nm, which makes 1064 nm Raman even more suitable for non-destructive measurement of red wine through the bottle. As in Figure 1, comparing the red wine spectrum in a secondary vial with that collected through the bottle, despite a small attenuation in the signal intensity, the Raman features are maintained and distinguishable for further identification and quantification.
Further component analysis was performed by adding methanol into the wine and measuring as before. As seen in Figure 2, most of the Raman features from pure red wine could be easily identified as ethanol. For the Raman spectrum of red wine with methanol added, a Raman peak centered around 1020 cm-1 is apparent, and this peak can be utilized for the quantification of the methanol concentration profile in different red wine samples as seen in Figure 3. Slight variances in spectral intensity on different measuring spots were found due the heterogeneity of the bottle glass.


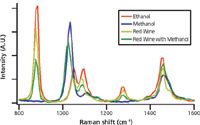
Figure 2: Identification of methanol in red wine based on its unique Raman features different from ethanol.
Based on these experiments, 1064 nm dispersive Raman is demonstrated as a viable new option to determine wine composition and contamination in the bottle. Chemometrics tools such as principal component analysis (PCA) and partial least squares regression (PLS) can significantly increase the accuracy and precision. It can be expected that future development of such applications may provide the wine industry a fast and non-destructive quality control and assurance tool for composition monitoring. This methodology can be easily applied to distilled spirits, beer, and others.

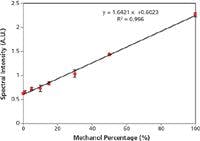
Figure 3: Quantification of methanol concentrations in red wine based on the intensity of one major Raman feature.
BaySpec, Inc.
1101 McKay Drive, San Jose, CA 95131
tel. (408) 512-5928, fax (408) 512-5929
Website: www.bayspec.com


Single Cell and Microplastic Analysis by ICP-MS with Automated Micro-Flow Sample Introduction
April 25th 2024Single cell ICP-MS (scICP-MS) is increasingly seen as a powerful and fast tool for the measurement of elements in individual cells, mainly due to the high sensitivity and selectivity of ICP-MS. Analysis is performed in the same way as single nanoparticle (spICP-MS) analysis, which has become a well-established technique for the analysis of nanoparticles and particles.
Hot News on Agilent LDIR, New Developments, and Future Perspective
April 25th 2024Watch this video featuring Darren Robey and Dr. Wesam Alwan from Agilent Technologies to gain insights into the future trends shaping microplastics research and the challenges of their characterization. Discover the essential components necessary for accurate microplastics analysis and learn how the Agilent 8700 LDIR system addresses these challenges. Offering rapid and precise analysis capabilities, along with easy sample preparation methods that minimize contamination, the Agilent 8700 LDIR system is at the forefront of advancing microplastics research.
The World of Microplastics Up to Date – an Overview
April 23rd 2024Watch this 20-minute educational video by Andreas Kerstan, Agilent Product Specialist in molecular spectroscopy, to gain a comprehensive update on the microplastics landscape and the environmental concerns related to them. Discover the current challenges in microplastics characterization and how Agilent innovative solutions and techniques, including FTIR, LDIR, GC/MS, and ICP-MS, are addressing these issues head-on.

