
|Articles|June 1, 2013
- Special Issues-06-01-2013
- Volume 28
- Issue 6
Classical or Transmission Raman, SERS or TERS: Which Raman Spectroscopy Technique Is Right for You?
This article re-explains and demystifies some definitions and opinions concerning Raman spectroscopy from two distinct sides: academic and industrial.
Advertisement
Raman spectroscopy has found its place as an important analytical tool after years of exclusion as an "academic" technique. The intense instrumental and software developments made easier — or simply possible — the use of different types of Raman spectroscopy. However, as is usual in a relatively new field, Raman spectroscopy — or more exactly, Raman spectroscopies — suffer from some misunderstandings, common (and sometimes false) beliefs, and "fashion" attitudes that make the choice of an appropriate technique and the required parameters of the system difficult. This article re-explains and demystifies some definitions and opinions concerning Raman spectroscopy from two distinct sides: academic and industrial. Different Raman techniques are compared with respect to their main field of applications, possibilities, advantages, difficulties, and limits.
Some time ago I read on the packaging of facial cream that the product was tested using Raman spectroscopy. My first thought was "Great, finally Raman has found its place in industry." The second thought was that the cosmetic laboratory found it worth mentioning on the box. As a Raman spectroscopist, I'm obviously happy to see the technique rise to fame as it is truly useful and information-rich, and, thus, well-worthy of wider interest. However, between the high-end research, the analytical market, and the marketing, the knowledge about Raman spectroscopy and technique — popularized too quickly sometimes — can be confusing or lost. I see this clearly in my job as a Raman applications scientist, which offers an interesting view on changing Raman applications, technology, and user profiles. Today's Raman spectroscopy market offers systems ranging from easy-to-use handheld systems dedicated to one application, through automated analytical systems to multipurpose high-end research systems. The intense instrumental and software developments have made easier, or simply possible, the use of different types of Raman spectroscopy, like the plasmon enhancement techniques used in surface-enhanced Raman spectroscopy (SERS) or tip-enhanced Raman spectroscopy (TERS), spatially offset Raman spectroscopy (SORS), transmission Raman, and Raman optical activity (ROA), to name just a few, which made their way independently from classical Raman spectroscopy to become new techniques on their own.
In this contribution, addressed to nonexpert Raman users, I will review some Raman-related techniques. I've focused on those I have personal experience with to show their advantages and limitations.
Classical Raman Microspectroscopy
Raman spectroscopy is a universal and versatile method for analysis of the atomic structure and chemical properties of matter by analysis of the interaction between the light and molecular and crystalline vibrations, similarly to near-infrared (NIR) absorption spectroscopy (1).
Raman spectroscopy has numerous advantages. The spectra allow a differentiation between even chemically similar species or different polytypes and their analysis can be quite direct (Figure 1). The confocal setup of modern Raman spectrometers gives lateral and axial spatial resolution on a submicrometer level. It does not require any sample preparation and is nondestructive — an important advantage over other techniques, particularly when the integrity of the sample is an issue. Obviously, laser power should be taken into consideration because burning may happen at high power, but this is a problem related more to the sample itself than to Raman spectroscopy.
Figure 1: Comparison of Raman spectra of two isomers (which have the same chemical formula but different molecular structure): glucose and fructose.
Raman spectroscopy is not considered very efficient, meaning low sensitivity and long acquisition times. Indeed, compared to a fluorescence signal, for example, Raman does not look very impressive, even if some good Raman scatterers can give a signal in a few milliseconds or less. However, the advantage of Raman spectroscopy over other techniques is that the information is intrinsic to the material and, thus, label-free. Fluorescence itself can be a problem because it may appear in a Raman spectrum. Usually much more intense, it can mask the Raman signal. It can be intrinsic to the sample coming from light diffused in porous or powder samples or from color centers; it can also be related to the preparation of the sample, such as fluorescent markers, resins used to fix the sample, or organic solvents. Methods exist to avoid or reduce it, however some precaution should be taken during the preparation of the sample.
Who Is It For?
Extensive scientific or technical experience is not required to use and understand Raman spectroscopy, at least at the basic level. Of course, more advanced analyses require more-detailed knowledge about the investigated sample. Most often used in academic research, or industrial development, classical Raman can be adapted to dedicated quality control applications. Because Raman spectroscopy can investigate almost all materials except metals and all states of matter, the applications are numerous. The most common applications involve the analysis of molecular or crystalline structure and chemical composition of materials (polymers, carbon, and semiconductors, to name a few), pharmaceuticals, inorganics and minerals, and biological samples, thus, there are few limitations from this point of view. Corrosion or catalysis studies can be more challenging mainly because of the small volumes, but Raman spectroscopy remains an interesting method, considering the complexity of the investigated structures.
Surface-Enhanced Raman Spectroscopy
Surface-enhanced Raman spectroscopy (SERS) is one of the answers to low Raman signals. Discovered (and rediscovered) in the 1970s, today SERS is a star of spectroscopic conferences and scientific reviews. No wonder, signal enhancement of several orders of magnitude and single molecule detection sound promising. However, looking at the publications and conferences related to SERS, it becomes clear that only a small part of them concerns the application of SERS; a relatively large part relates to the development of the SERS supports (substrates or colloids). So, what is the real SERS situation?
The obvious advantage of SERS is the enhancement of the signal, which sometimes cannot even be measured by classical Raman spectroscopy because of the low concentration of the analyte. SERS inherits, of course, the high chemical selectivity of Raman spectroscopy. SERS spectra and Raman spectra are basically similar, but they are not always exactly the same. There are some reasons for that. The SERS effect is highly localized, therefore, only a signal from part of the molecule, close to the substrate, will be enhanced. When the molecule is adsorbed on the surface, its symmetry might slightly change, and so do the selection rules. Also, because plasmon resonance is wavelength dependent, the different spectral regions of the spectrum may be enhanced differently (Figure 2).
Figure 2: Example of Raman and SERS measurements of a solution of 5 mM DTT, compared to the Raman spectrum of the powder. No Raman signal is observed for the solution because of its low concentration and low Raman efficiency, however the same concentration can be detected using the SERS technique.
However, the reproducibility of the SERS supports is still the major issue, which probably explains the number of publications related to substrate development. Other issues are the capacity of molecules to attach to the substrate and signal enhancement itself (which, incidentally, has something like 20 various definitions, and, thus, is not a reliable parameter for the comparison of different substrates). The holy grail — substrates that give high enhancement, are reproducible, uniform, and easy and cheap to mass produce — has not been found yet. This is very well summarized in the "SERS uncertainty principle": We either have high enhancement and low reproducibility, essential for very low concentration measurements like single-molecule SERS; or we have relatively good reproducibility with less impressive enhancement, which is still a very interesting option in the case of routine analysis when the classical Raman signal is not strong enough (2).
Who Is It For?
SERS is for those who analyze very small amounts of materials or substances of low Raman efficiency, which could be the case in applications related to pharmaceuticals, life sciences, forensics, or art (2–5). In the case of standard measurements, once optimized, SERS does not require more experience than classical Raman spectroscopy; however, sample preparation is necessary, which can sometimes be time consuming to ensure good adsorption of the sample on the SERS substrate. Optimization consists of the choice of an appropriate substrate (with a uniform enhancement on the whole surface some commercially available substrates are reasonably good), a laser wavelength to match the resonance, a suitable concentration range (very low concentrations can suffer from blinking effects), and an operation protocol. There are no particular requirements for the Raman system, which should be obviously adapted to the application. In the case of more extreme measurements (lower concentrations, higher enhancements), specially designed SERS supports can be necessary and tunable lasers can be an interesting option (6).
Tip-Enhanced Raman Spectroscopy
Tip-enhanced Raman spectroscopy (TERS) is based on the same physical phenomenon as SERS. The difference lies in the technical solution. The Raman spectrometer uses a scanning probe microscopy (SPM) system as the sampling device. The SPM system (usually an atomic force microscope) uses a special metallic or metal-coated tip that acts as a plasmonic antenna. Signal is enhanced, as in SERS, but the enhancement is confined to the nanometer-scale area under the tip (Figure 3). The advantage of this technique is not only the enhancement of the Raman signal but also the spatial resolution on the nanometer scale. Therefore, its applications are mainly in the domain of nanomaterials based on semiconductors, carbon or polymers, life sciences (such as cell analysis), and molecule interrogation (in particular, DNA or RNA) (7–11). It is worth remembering that TERS is not the same as colocalized Raman–atomic force microscopy (AFM) measurements, although a TERS system can perform both of them. The latter combines the information on physical properties of the sample with the spatial resolution of SPM (nanometer scale) and the chemical information with the spatial resolution of Raman spectroscopy (hundreds of nanometers scale). Colocalization ensures that these two results come from the same area on the sample. Taking into account that both SPM and Raman spectroscopy are relatively mature techniques, such analysis is relatively simple.
Figure 3: Comparison of Raman and TERS spectra of azobenzene. The integration time was 30 s for the Raman spectrum and 1 s for the TERS spectrum. Courtesy of Marc Chaigneau, Ecole Polytechnique, Paris.
TERS provides chemical information on the nanometer scale; the special TERS probe tip is key to create the signal enhancement that is necessary to obtain information from the near-field. Although the SPM tips are easily available, few TERS tips are commercially available and all have limitations. Most TERS researchers coat the SPM tips with a noble metal on their own, or produce the full-metal tips by electrochemical etching. Just as the case with SERS, definition of the enhancement factor is still an open question.
Who Is It For?
Today, TERS is not a push-button technique and it requires some experience in Raman spectroscopy, SPM microscopy, and resonance enhancement. A very stable laboratory environment is necessary, including mechanical isolation. Generally speaking, TERS requires significant investment not only in equipment, but also in time. However, when mastered, it brings quite impressive results, as proved by research groups around the world specializing in TERS spectroscopy.
Transmission Raman Spectroscopy
Transmission Raman spectroscopy (TRS) shows an opposite trend to TERS in materials analysis. The latter aims at the nanometer scale, whereas TRS targets the collection of information about the bulk volume of a sample, because it analyses the light that traveled through the entire thickness of the sample. First tests in a forward configuration were done in the late 1960s, but it is only the recent advances in signal detection and availability of small, but powerful lasers and efficient rejection of Rayleigh scattering that made TRS practically possible.
The technique was initially developed for the pharmaceutical industry, for which it is very well adapted (12,13). TRS requires diffusing materials, such as pharmaceutical tablets, and provides information about the whole volume of the sample without a strong influence on the tablet coating, which can be a problem in classical backscattering configuration. It can be used for the analysis of component concentration, and, in particular, content uniformity. It also works for capsules and other materials outside of the pharmaceutical field, which are diffusing, translucent, and require whole sample analysis. The examples of applications can be in the domain of biomaterials (tissues, food), polymers, or even geology. It can be used successfully through the packaging.
Figure 4: Typical TRS spectra obtained from a pharmaceutical sample.
Who Is It For?
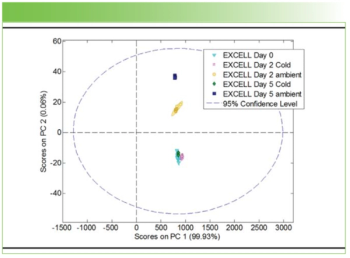
TRS is a technique for analysts looking for bulk analysis; however, TRS is limited to translucent samples. It is an interesting solution for the routine analysis of samples content (Figure 4). No preparation of the sample is necessary and it does not require any particular experience from the operator. It is often combined with multivariate analysis techniques for data processing because it may bring large datasets of similar spectra (Figure 5). Although it exists as a separate technique, it can be an excellent add-on to the classical Raman system to combine the bulk overall information provided by TRS and more detailed, spatial information given by Raman microspectroscopy.
Figure 5: Example of processing TRS spectra: preprocessed spectra from Figure 3 and results of principal component analysis (PCA) decomposition.
Review of Some Typical Raman Spectrometer Options
Today, imaging is one of the most advertised options for spectroscopy software. Is it really worth it? I'm convinced that yes, it is worth it. Beyond the esthetics, hyperspectral imaging is an excellent and quick method to get and analyze overall information about the sample: for example, component identification and distribution (particularly when some of them could be not detected if just a few measurements were made in discrete locations) (Figure 6) or local changes of structure or polarization. Going further, what about fast imaging? With the exception of signal-enhancing electron multiplying charge coupled device (EMCCD) detectors, the techniques of "fast imaging" actually do not improve the Raman signal (which is strictly related to the Raman efficiency of the sample), but they efficiently optimize the hardware and software and the gain of time is real without compromising the quality of the data (too much).
Figure 6: Raman maps of a pharmaceutical tablet on three levels of detail: the whole tablet covering a 7 mm à 18 mm area (upper image), a higher resolution image highlighting a fourth, minor, component (lower left), and a detailed Raman image acquired with 2-μm steps (lower right). Sample constituents: aspirin (red), paracetamol (green), caffeine (blue), and cellulose (yellow); in addition to the tablet coating (pink).
But where there's "imaging," there are "large datasets," and thus the necessity of efficient data treatment. The classical method of data analysis consists of processing spectrum by spectrum. Today, software packages usually offer a wide range of functionalities for automatic treatment of groups of spectra and hyperspectral images, including baseline correction, smoothing, normalization, or peak fitting. Multivariate analysis, which offers a more holistic attitude to data analysis, has become a standard functionality for spectroscopy data treatment software. Multivariate analysis can easily show the patterns in large data sets, find the pure component spectra (loadings), or simply improve the contrast of images (Figure 7).
Figure 7: Raman fast imaging of carbon nanotubes (CNT): (a) Raman image after a basic treatment, (b) Raman image after a multivariate processing (multicurve resolution method, MCR), (c) original spectrum, (d) MCR loading.
A Raman spectrum is strictly independent of laser wavelength, but this parameter must be taken into consideration, as it will influence the Raman efficiency, penetration depth (and thereby, analyzed volume), resonance conditions, and (potential) fluorescence. UV excitations are of interest as a solution to avoid fluorescence, provide possible resonance effects, produce low penetration depths (which indeed, improves the detection and analysis of very thin layers), and high Raman efficiency (which is inversely proportional to the fourth power of the wavelength). This last argument is obviously true, at least from the theoretical point of view. However, the volume analyzed by UV lasers is very small (because of its low penetration depth) and the optics and detectors are typically less efficient in the UV region than in the visible region. The NIR lasers are also used as an ultimate solution to fluorescence issues, which is essentially true because the substances that give fluorescence in this spectral region are rare. However, in this case, we will struggle with low Raman efficiency and the necessity to use specialized, less-efficient detectors (beyond 1000 nm). Putting all this together, green or blue lasers show the best compromise between Raman efficiency and analyzed volume, and thus the strongest effective Raman signal. In addition, blue lasers, which are relatively new on the market, can be an option to avoid fluorescence because they are on the frontier between UV and visible excitation. The 785 nm laser remains an optimized solution for NIR excitation.
Conclusions
The aim of this contribution was to show the practical aspects of some techniques related to Raman spectroscopy (or spectroscopies). Without a doubt, the latest generation of Raman spectrometers in all their guises (classical, SERS, TERS, TRS, and so on) open up a vast wealth of analytical opportunities, and Raman continues to experience impressive growth as a technique of choice by analysts in many varied fields. The choice of subjects covered here was not exhaustive, but was based on my own experiences and the techniques' relative importance for understanding the advantages (and the difficulties) related to Raman spectroscopy.
References
(1) J.M. Chalmers and P.R. Griffiths, Eds., Handbook of Vibrational Spectroscopy (John Wiley & Sons Ltd, Chichester, UK, 2002).
(2) E.C. Le Ru and P.G. Etchegoin, Principles of Surface-Enhanced Raman Spectrscopy and related plasmonic effects (Elsevier B.V., Amsterdam, The Netherlands, 2009).
(3) K. Kneipp, M. Moskovits, and H. Kneipp, Eds., Surface-Enhanced Raman Scattering – Physics and Applications 103 (Springer, Berlin/Heidelberg, 2006).
(4) B. Sharma, R.R. Frontiera, A.-I. Henry, E. Ringe, and R.P. Van Duyne, Mater. Today 15, 16–25 (2012).
(5) D. Cialla, A. März, R. Böhme, F. Theil, K. Weber, M. Schmitt, and J. Popp, Anal. Bioanal Chem. 403, 27–54 (2012).
(6) A.R. Tripp, A.R. Dluhy, and Y. Zhao, NanoToday 3, 31–37, (2008).
(7) E. Bailo and V. Deckert, Chem. Soc. Rev. 37, 921–930 (2008).
(8) A. Hartschuh, Angew. Chem. Int. Ed. 47, 8178–8191 (2008).
(9) J. Stadler, T. Schmidt, and R. Zenobi, Nanoscale 4, 1856–1870 (2012).
(10) E. Bailo and V. Deckert, Angew. Chem. Int. Ed. 47, 1658–1661 (2008).
(11) G. Picardi, M. Chaigneau, and R. Ossikovski, Chem. Phys. Lett. 469, 161–165 (2009).
(12) K. Buckley and P. Matousek, J. Pharm. Biomed. Anal. 55, 645–652 (2011).
(13) J. Johansson, A. Sparén, O. Svensson, S. Folestad, and M. Claybourn, Appl. Spectrosc. 61, 1211–1218 (2007).
Renata Lewandowska is a Raman application scientist with Horiba Scientific in Villeneuve d'Ascq, France. Direct correspondence to:
Articles in this issue
Newsletter
Get essential updates on the latest spectroscopy technologies, regulatory standards, and best practices—subscribe today to Spectroscopy.
Advertisement
Related Content
Advertisement


Advertisement
Advertisement