SEC–ICP-OES Hyphenation: Speciation and Quantification of Polydimethylsiloxanes at Trace Levels
Spectroscopy
Polydimethylsiloxane (PDMS) compounds are ubiquitous; thus it is challenging to develop analytical methods that ensure their absence. A newly developed method combining sizeexclusion chromatography with inductively coupled plasma–optical emission spectroscopy makes it possible to quantify ultratrace levels of PDMS in volatile and nonvolatile organic solvents. A complete range of molecular weights can also be distinguished with this approach.
Polydimethylsiloxane (PDMS) compounds are polymeric organosilicon substances commonly referred to as silicones. PDMS is the most often used silicon-based polymer worldwide, and, because of its outstanding properties, it finds use in a wide variety of industrial processes and consumer products. A newly developed inductively coupled plasma–optical emission spectrometry (ICP-OES) method makes it possible to quantify ultratrace levels (<50 ppb w/w) of PDMS as silicon in volatile and nonvolatile organic solvents. The drawback of the mentioned ICP method is that it is only suitable for the determination of total silicon; distinguishing between different silicon components is not possible. Size-exclusion chromatography (SEC), combined with ICP-OES, provides a highly flexible separation of organosilicon compounds according to molecular weight. Molecular weights ranging from 311 to 186,000 Da can be distinguished using this approach. Good sensitivity is achieved with sub-part-per-million detection capability for silicon. The method is linear over the entire investigated mass range with an average precision of 5.3%, and a mean recovery of 96%.
Polydimethylsiloxane (PDMS) compounds are polymeric organosilicon substances commonly referred to as silicones. (1). Because of their physical properties such as thermal stability, weather resistance, hydrophobicity, film-forming abilities, surface activity, and release and lubrication properties. PDMS compounds are the most frequently used synthetic, silicon-based polymers worldwide. PDMS is used in a wide variety of industrial processes and consumer products (2).
Indeed, because various industrial technical products contain significant amounts of silicon components, such as fumed silicas or silanes as adhesion promoters, in some cases the absence of PDMS has to be guaranteed. This absence of PDMS is particularly important for siloxane-free coatings in the automotive industry. This challenge leads to the demanding analytical task of not only quantifying ultratrace amounts of PDMS in organic products, but also separating the different species of silicon compounds (silicones, silanes, and inorganic silicon.
A newly developed, fast, and robust inductively coupled plasma–optical emission spectroscopy (ICP–OES) method (3) enables quantification of ultratrace amounts of silicon (<19 ppb) in a wide variety of industrial organic products. However, the drawback of the mentioned ICP method is that it is only suitable for the determination of total silicon; distinguishing between different silicon components is not possible.
Size-exclusion chromatography (SEC), also called gel permeation chromatography (GPC), is a well established method for the separation of polymers according to their molecular weight (4), with smaller polymers being eluted at longer elution times. When used as such, SEC may lack the necessary sensitivity for certain industrial applications. SEC combined with ICP-OES provides a highly flexible separation of compounds with sub-part-per-million detection capability for various elements, including silicon.
The principle of combining both techniques for the characterization and quantification of high-molecular-mass silicones in environmental samples with high sensitivity has been demonstrated previously (5). The aim of the present work differs from earlier approaches (4–6) in the sense that in this work SEC is mainly used to separate high- and low-molecular-weight compounds (such as silanes and PDMS). The focus of the new method is the quantification of (organo)silicon species versus different molecular masses. The determination of the silicon from PDMS content down to the trace range relative to the various molecular weights is of decisive importance from a product quality perspective.
In the current work, former approaches were modified in that the calibration of SEC and ICP were both performed using PDMS standard solutions (PDMS dissolved in toluene) without any other internal standard used. This approach leads to a universal calibration that can quantify each type of PDMS within different products, even if their molecular masses differ from the masses used for calibration. A further advantage of the presented method is the simple coupling configuration, which allows widespread use in other industrial and commercial laboratories.
This article describes the establishment of a robust and easy-to-use method, including validation of the separation of different molecular weight polymeric organosilicon substances and their quantification with high sensitivity. The method is suitable for separating high- and low-molecular-mass compounds of silicon- and nonsilicon-based components. It also enables determination of the silicon distribution versus molecular mass at sub-part-per-million levels (limits of quantification [LOQs] lower than 1 ppm for different types of PDMS can be achieved). Eventually, undesirable contamination of industrial products with PDMS compounds can be revealed. Therefore, calibration and measurements have been made using different PDMS compounds with different molecular weights. A special approach with respect to the necessary calibration curve has been worked out to enable quantification of all types of PDMS.
Experimental
For the SEC–ICP-OES coupling, an Agilent 1260 Infinity LC system, equipped with a quaternary pump, an autosampler with large-volume injection capability (250 µl), and a refractive index (RI) detector (negative signal polarity) was used. Chromatographic separations were carried out with a set of two 300 mm x 7.5 mm, 5-µm Agilent Polypore columns, which were operated at a temperature of 40 °C, and with a flow rate of 1 mL/min of toluene. In this first approach, no splitter was used between the RI detector and the ICP-OES system.
The ICP-OES system was a Thermo Scientific iCAP 7600 Radial system modified with a Trigger board, equipped with a temperature-programmable Glass Expansion IsoMist XR kit with Twinnabar spray chamber (at -8 °C), using a MicroMist U-Series nebulizer and a ceramic D-torch with a 1.0 mm injector piece. Data collection and evaluation was done using iTEVA software (time scan mode). A separate digital peristaltic pump (Cole-Parmer Instrument Company) was used for the drain.
The operation conditions of the SEC–ICP-OES system are shown in Table I.
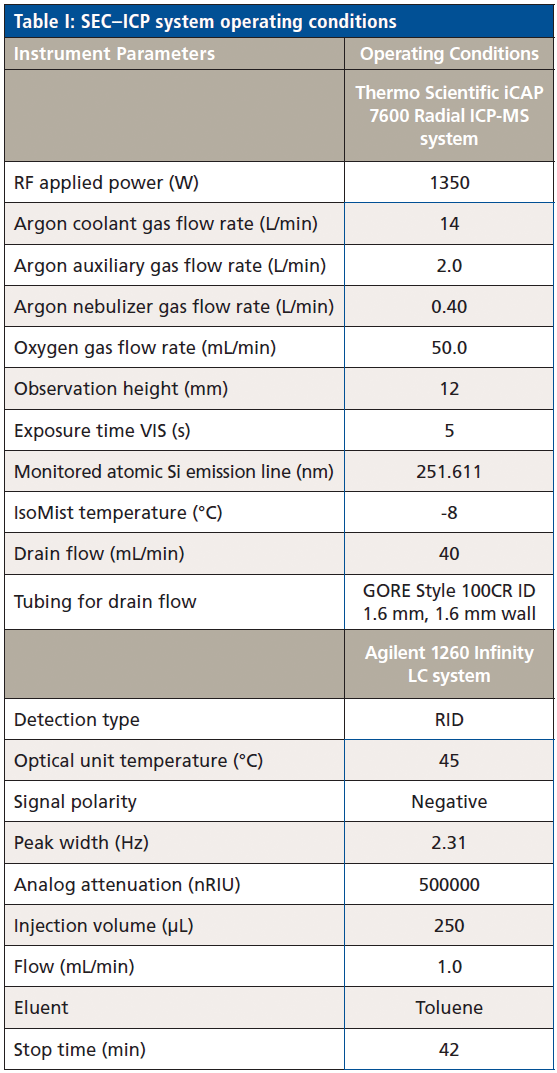
Table I: SEC–ICP system operating conditions
Calibration
Nine PDMS standards, all narrow standards except for the 186,000 Da standard, were obtained from PSS Polymer Standards Service GmbH and were used for calibration of the SEC–ICP system covering the range between 311 and 186,000 Da (MW 311 Da, 1600 Da, 4310 Da, 4980 Da, 10,700 Da, 22,700 Da, 49,500 Da, 90,400 Da, and 186,000 Da). For determination of PDMS by SEC–ICP–OES, individual stock standard solutions of 1000 ppm of the above mentioned PDMS standards were prepared by dissolving each PDMS standard in toluene (Merck LiChrosolv). These solutions were serially diluted to provide working standards in the range of 1–20 ppm PDMS (equal to 0.38, 0.76, 1.89, 3.79, and 7.58 ppm of silicon).
An injection volume of 250 µL was used for the standards. The calibration graph was constructed by plotting the average area (silicon peak) for each independent standard of the same concentration but different molecular weight versus the PDMS concentration (nine individual areas were combined for each calibration point). Toluene, which was used for dissolution and dilution, was measured as the blank.
Calibration solutions were analyzed in the first step by using the coupled system with refractive index (RI) detection, to identify the retention times of the different molecular weights, and, in the second step, without RI detection, to enhance the sensitivity of the ICP system. All further measurements and quantifications were performed without RI detection, given that retention times were observed to be stable over several weeks.
Results and Discussion System Stability
As for the separation, all relevant components were eluted within 25 min. However, additional non-silicon-containing peaks were observed with RI detection, therefore a total run time of approximately 42 min was chosen. Acceptable stability of the spectrometer (plasma, wavelength position, and so forth) and of the SEC system (pump, injector, column packing, and so forth) is crucial to obtain suitable results over hours and days. Furthermore, the toluene quality can influence the measurement stability. Therefore, a measurement of the utilized toluene is always essential, as discussed in detail in this section.
For verification of system stability, a 20 ppm PDMS polymer mix standard (containing molecular weights of 311 Da, 4980 Da, 21,600 Da, and 46,200 Da) dissolved in toluene was used.
Figure 1 shows that shifts in background signal intensities between different days of measurements can occur. Therefore, the measurement of an appropriate number of toluene blanks is always of high importance to correct this shift. For calibration and quantification of PDMS, respectively, the background-corrected intensities should always be used.
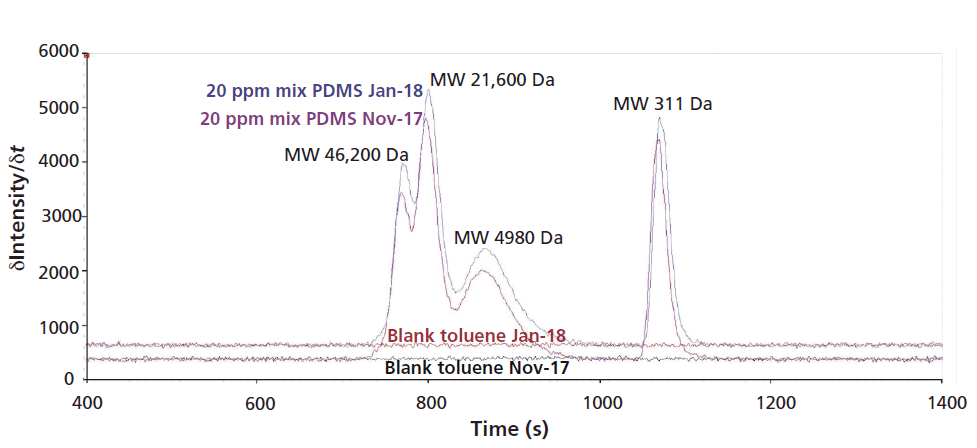
Figure 1: Overlays of silicon time scans (measured using ICP-OES) comparing intensities of two 20 ppm PDMS mix standards and toluene blanks on two different days.
The 20 ppm PDMS polymer mixed standard had been measured 11 times over a two-month period without recalibration of the system, showing an average variation of the background corrected peak areas of only 5.3% (see Table II). Additionally, this result demonstrates that the system is very stable with regard to observed retention times (average of 0.2% RSD) for a wide range of PDMS polymers (see also Figure 1). Both parameters verify that the spectroscopic and chromatographic conditions were both stable and reproducible.
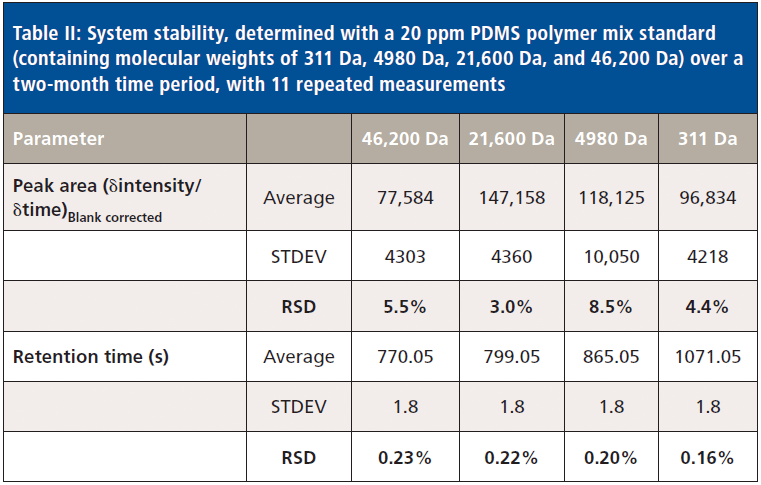
Table II: System stability, determined with a 20 ppm PDMS polymer mix standard (containing molecular weights of 311 Da, 4980 Da, 21,600 Da, and 46,200 Da) over a two-month time period, with 11 repeated measurements
Separation of PDMS Polymers
The resolution of the system under the operating conditions must be good enough to separate and detect PDMS-related silicon in a wide range of different organosilicon compositions, involving forms that can occur in industrial environments. Additionally, the method must allow the detection of subtle composition changes, which is a need in the assessment, control, and optimization of production processes.
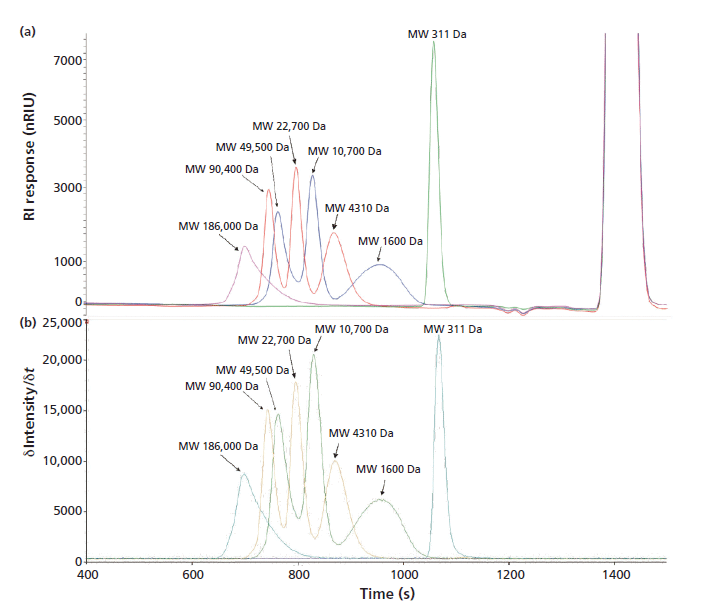
Figure 2: Comparison of (a) an SEC chromatogram (with RI detection) and (b) an ICP-OES silicon time scan of 100 ppm PDMS standards in toluene separated under the operating conditions described.
Figure 2 displays the resolution of the system under the given operating conditions for a wide range of PDMS standards. Obtained peak areas are directly proportional to the concentration of each standard, permitting the calibration of any PDMS oligomer or mixture with any other oligomer or mixture.
Calibration
The universal calibration graph was linear from 1 to 20 ppm PDMS (0.38 to 7.58 ppm Si), using 250 µL injection volumes. Each calibration point represents the average intensity from nine single PDMS standard solutions (MW from 186,000 Da to 311 Da) (see Figure 3).
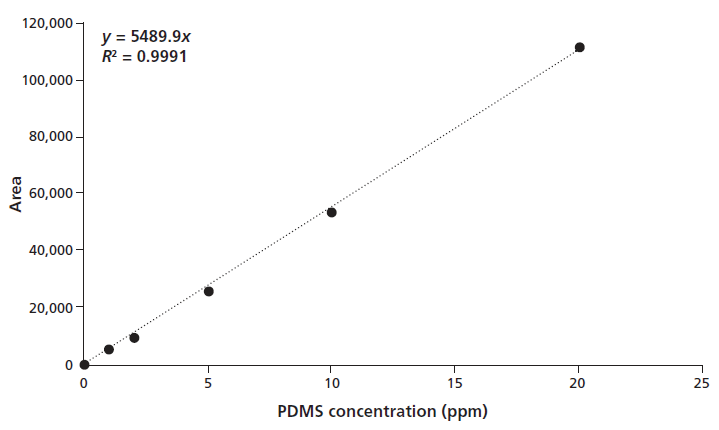
Figure 3: PDMS calibration curve of an ICP-OES silicon time scan, ranging from 0 to 20 ppm PDMS. Each calibration point represents the average intensity from nine single PDMS standard solutions (MW 186,000 to 311 Da).
Peak area differences between low- and high-molecular-mass PDMS were negligible (an average of 4% difference was determined). This result has been tested by normalizing the areas determined for the different masses to the PDMS polymer of the molecular mass 22,700 Da, similar to the approach described by Dorn and Skelly Frame (5). Our approach permits the quantitative analysis of any molecular mass PDMS by using the present calibration.
Limit of Detection and Quantification
The limits of detection (LOD) and quantitation (LOQ) for PDMS and silicon have been determined using the uncertainty of the blank value (measured 10 times on several days) according to the blank value method. For this purpose, the scattering of the blank has been calculated for each individual molecular mass (nine in total) after background correction (forced through zero). The threefold standard deviation of the blank values thus yielded the LOD, while the tenfold standard deviation gave the LOQ. Those measurements resulted in an LOD of 0.23 ppm for silicon and 0.60 ppm of PDMS and in an LOQ of 0.76 ppm silicon and 2.0 ppm PDMS.
Figure 4 shows the signals and background (blank) obtained for 250 µL injections of a 1 ppm and a 2 ppm (as PDMS) solution. It can be observed that, under the operating conditions used, 1 ppm PDMS (0.38 ppm silicon is equal to 95 ng silicon) is clearly detectable with a signal-to-noise ratio (S/N) slightly higher than the calculated LOD. This result supports the theoretical level obtained from the blank value method.
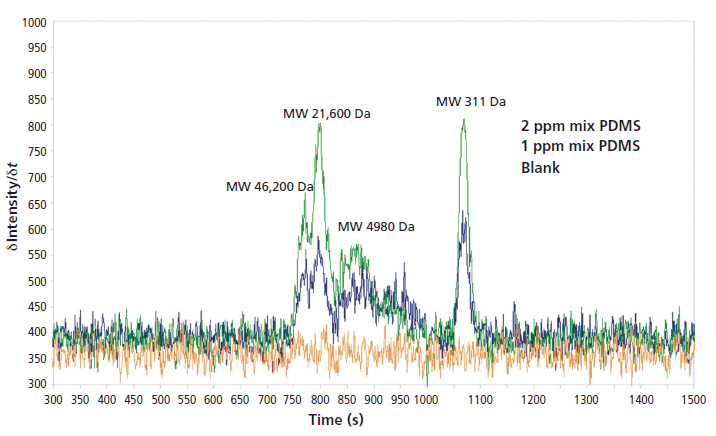
Figure 4: Comparison of ICP-OES silicon time scans of 1 ppm and 2 ppm PDMS standards in toluene as well as a toluene blank separated under the operating conditions described.
Recoveries
A suitable method accuracy (recovery) is an important criterion for industrial applications. For this purpose, known amounts of two individual PDMS polymer standard solutions were added to a real sample (additive of 0.1% concentration) which contained a broad distribution of high- and low-molecular-mass organosilicon compounds.
Determined recoveries for the spikes were 110% for MW 10,700 Da and 82% for MW 311 Da. This result was deemed very satisfactory (see Figure 5).
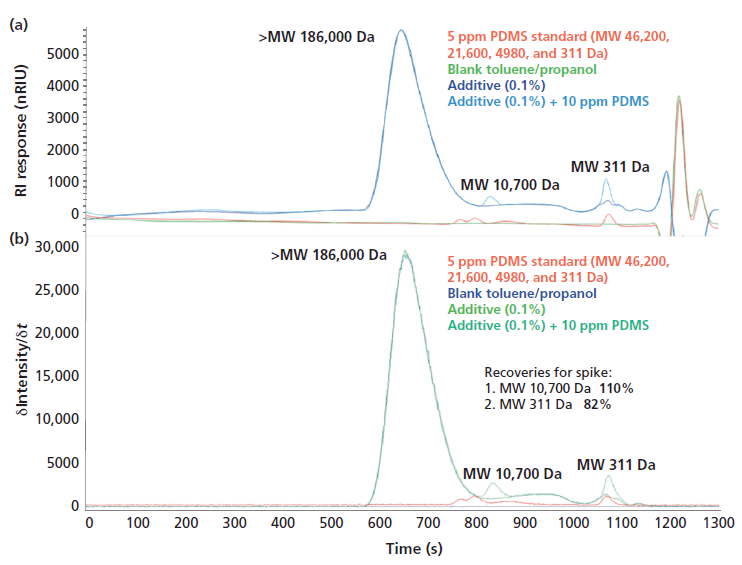
Figure 5: An SEC chromatogram (a) and an ICP-OES Si time scan (b) of additive, additive with PDMS spike, blank, and 5 ppm PDMS standard.
Outlook
All measurements and quantifications were performed without RI detection in the SEC system, after the stability of the SEC–ICP system had been verified because the sensitivity was twofold higher in this configuration. To further enhance efficiency with regard to routine usage of SEC–ICP hyphenation, a splitter was incorporated and the first tests have been performed (split ratio was 30:1 RI detection/ICP).
These first tests were very promising, because only a slight loss in intensities was observed. Therefore, further development of the present method is ongoing-especially with respect to some hardware modifications-with the aim to reach similar results by using both detectors (RI and ICP) simultaneously.
Conclusion
SEC–ICP-OES hyphenation is a powerful tool to separate a wide range of high- and low-molecular-mass compounds of silicon- and nonsilicon-based compounds. The developed method enables the determination of silicon distribution versus molecular weight. The instrument configuration allows direct injection of organic solvents.
PDMS polymers can be determined at sub-part-per-million levels (LOQ <1 ppm silicon for different types of PDMS) and characterized by molecular mass using this coupling technique. The response was uniform over a wide range of molecular masses (186,000 to 311 Da) under the conditions used. It provides a universal calibration, allowing the system to be calibrated with any single PDMS standard or a mixture of standards with a variety of molecular weights. The ICP–SEC system proved to be very stable over several months, with stable calibration throughout this time.
The recovery experiments showed the robustness of the system and the method. Measurements of additives spiked into real industrial samples demonstrated the suitability of the method and showed satisfying recoveries.
LOD and LOQ in the desired range were determined using commonly accepted procedures.
References
(1) "Linear Polydimethylsiloxanes" Joint Assessment of Commodity Chemicals, 2011 (Report No. 55), ISSN 2079-1496-55 online.
(2) S. Varaprath, D.H. Stutts, and G.E. Kozerski, Silicon Chemistry 3, 79–102 (2006). DOI: 10.1007/s11201-006-9005-8
(3) K. Vogel, "Trace Analysis with ICP-OES: Analysis of Polydimethylsiloxane in Organic Solvents," poster presentation, 2017, ANAKON, Tübingen
(4) R.G. Lehmann, J.R. Miller, and G.E. Kozerski, Chemosphere 41, 743–749 (2000).
(5) S.B. Dorn and E.M. Skelly Frame, Analyst 119, 1687–1694 (1994). DOI: 10.1039/AN9941901687
(6) A.L. Smith and R.D. Parker, The Analytical Chemistry of Silicones, A.L. Smith, Ed. (Wiley, New York, 1991), pp. 71–95.
Kerstin Vogel, Antje Wegener, and Matthias Pursch are with Dow Deutschland Anlagengesellschaft mbH, Stade, Germany. Peter Luschas and Marc Wiesman are with Thermo Fisher Scientific GmbH, Dreieich, Germany. Direct correspondence to: kvogel@dow.com
Geographical Traceability of Millet by Mid-Infrared Spectroscopy and Feature Extraction
February 13th 2025The study developed an effective mid-infrared spectroscopic identification model, combining principal component analysis (PCA) and support vector machine (SVM), to accurately determine the geographical origin of five types of millet with a recognition accuracy of up to 99.2% for the training set and 98.3% for the prediction set.
Authenticity Identification of Panax notoginseng by Terahertz Spectroscopy Combined with LS-SVM
In this article, it is explored whether THz-TDS combined with LS-SVM can be used to effectively identify the authenticity of Panax notoginseng, a traditional Chinese medicine.