
|Articles|January 1, 2012
- Spectroscopy-01-01-2012
- Volume 27
- Issue 1
Tracking Unknown Intracellular Activity with Fluorescence Correlation Spectroscopy
The basic techniques of fluorescence correlation spectroscopy (FCS) are discussed as well as several applications, such as nanoparticle dispersion studies.
Advertisement
Recent advancements in photomultiplier tubes and detectors, along with improved filter contrast and transmission, have allowed what was once impossible: detection and analysis of spontaneous movements on the nanometer level using fluorescence correlation spectroscopy (FCS). Here, the basic techniques of FCS are discussed along with several novel applications, such as nanoparticle dispersion studies. Insights into solving potential problems, such as photobleaching, also are provided.
Fluorescence correlation spectroscopy (FCS) is an extremely powerful, versatile technique that is useful both in vivo and in vitro for biochemistry and biophysics. Using FCS, one can determine and obtain a great deal of quantitative information, such as diffusion coefficients, hydrodynamic radii, kinetic chemical reaction rates, photophysical processes, and a wide variety of internal and external dynamic characteristics of biological molecules. These measurements can be done quickly and easily by modifying any standard fluorescence or confocal microscope. Here, we cover the important details of FCS in a few specific examples as well as focus on the material side and see how improved filters and detectors have resurrected this once popular technique.
How Does the Technique Work?
The technique of fluorescence correlation spectroscopy, in conjunction with confocal or two-photon excitation microscopy, begins, as most fluorescent microscopy systems do, with focusing light on a sample. The sample's emission is measured over time and the fluorescence intensity fluctuations are analyzed using what is called temporal autocorrelation (1). Temporal autocorrelation stems from spatial dependency and analysis of demographics or geography and is a very useful method of measurement and analysis when working with small fluctuations in a known sample size. Essentially, it refers to the association between time-shifted values given a voxel time series, and those particular signal values at present time are independent of past and future signals (2). Temporal autocorrelation is important to consider because cellular and subcellular activity is completely random and minute. Analysis of the signal during a short time domain should assist in improving the understanding of intracellular activity. The intensity fluctuations vary depending on the sample under inspection. This is crucial because the measured fluorescence is directly related to the intensity of the entity's overall fluctuations. In this technique, it is very important to ensure that the number of molecules remains constant during inspection; no samples should enter or leave the observation volume. Additionally, when the threshold of units is exceeded, fluctuations in the observation volume become undetectable. This threshold is not a specific value but rather an observational determinant. If the inspection region is saturated with noise and light, or if there is no noticeable flux, then the threshold more than likely has been crossed. A consistent concentration ratio and observation volume of a variety of specimens allows researchers to conduct experiments in a wide variety of fields, such as materials science and biology. This is not the easiest of tasks but as the saying goes, "practice makes perfect."
FCS Setups and Equipment
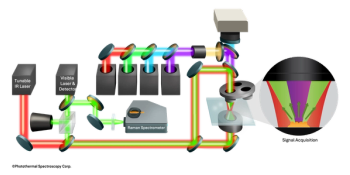
Typical FCS setups consist of a laser line, a focusing objective, dichroic and emission filters, and a photomultiplier tube (PMT) or detector. Depending on the sample, the laser line can be a continuous wave in the visible spectrum or a pulsed beam in the near-infrared (NIR) wavelengths. NIR wavelengths are less harmful to cells than UV–vis wavelengths, so when working with biological material it is better to expose them to longer wavelengths if possible. Companies have been producing and advancing PMTs for many years, resulting in wider spectral responses, faster time responses, lower dark noise, and higher sensitivity. For many years, traditional coated filters have dominated the market and have performed adequately. However, a recently developed coating technique (advanced plasma reactive sputtering coating, Edmund Optics, Barrington, New Jersey) is now yielding higher quality filters. These hard-sputtered filters are produced on a single-substrate and can provide deeper blocking, higher transmission, and steeper slopes than what was traditionally available. Their dense coating design also helps prevent filter degradation. The recent advancements in PMTs and detectors, along with improved filter contrast and transmission, have allowed for the detection and analysis of minute and spontaneous movements on the nanometer level, which was once impossible.
Filtering in a fluorescent microscope system typically uses three specific filter types: excitation, emission, and a dichroic filter (Figure 1). The excitation filter rests within the optical path between the illumination source and the sample of interest. This ensures that the wavelengths transmitted through the filter closely match the fluorophore's absorption bands. The dichroic filter reflects excitation wavelengths, transmits emission wavelengths, and is positioned at 45° within the optical path. The combination of the dichroic and emission filters prevents additional energy and noise from propagating through to the detector.
Figure 1: Standard filtering for fluorescence microscopy.
By incorporating a filter with a high optical density (OD), narrow full width-half maximum (FWHM), and high transmission at the center wavelength (CWL), it will be easier to excite particular fluorophores and quantify their emission without photobleaching or damaging the sample. Photobleaching is the destruction of a fluorophore and its ability to produce a light emission. This destructive effect is especially problematic in time-lapse microscopy techniques and can be easily avoided. As mentioned above, the appropriate filter or reduced light exposure intensity can prevent this effect from occurring. This is increasingly important for FCS as molecular concentrations and fluid volumes are further reduced. One of the biggest problems today for fluorescence microscopy is photobleaching or burning of the sample because of overexposure to a source or laser line. One common fluorophore is the green fluorescent protein (GFP). GFP is a protein that emits a bright green fluorescence when exposed to a blue excitation source. The two excitation bands in the blue spectrum are 395 nm and 475 nm, which result in an emission band of 509 nm. There are a number of GFPs in nature, including one derived from jellyfish (Aequorea victoria). The average lifetime of a GFP is only 0.1–1 s when exposed to blue light whereas typical organic dyes have a longer lifetime of approximately 1–10 s. To avoid this risk, it is important to identify the CWL, make sure that it is narrow enough to incorporate the necessary bandwidth, and have a high OD to reject unwanted light and energy. When selecting the appropriate filter for an FCS setup, it is crucial to know what your peak excitation and peak emission wavelengths are. The excitation filter should have a CWL that is closely matched to the absorption band of the fluorophore and should cover as much of the bandwidth as possible. The minimum transmission of this filter will determine how much fluorescence can be attained in the system. When discussing transmission, it is important to focus on OD. Transmissions >85% are recommended and ODs close to 6.0 will ensure the best signal-to-noise ratio. The OD of the filter ensures the blocking efficiency of the filter outside of the specified CWL and FWHM.
FCS Applications
There are a large number of applications and experimental setups for FCS. Molecular concentration analysis and aggregation measurements are typically applied to protein analysis. Mobility and molecular interactions such as diffusion, active transport, molecular interactions, and conformational changes are measured for a variety of biological molecules. Another important application involves the association or dissociation of enzyme kinetics that can be analyzed using two-photon excitation microscopy. Finally, FCS can explore the molecular dynamics and conditions in the microenvironment that affect the activation and photoluminescence of particular fluorophores in solution (1).
FCS varies from standard fluorescence techniques because it focuses less on the emission wavelength and concentrates more on the spontaneous intensity fluctuation that is caused by small deviations in size, shape, or molecular interactions. These recorded deviations can provide invaluable information on how a protein folds and what induced such a reaction; how a clinical drug trial can affect cellular vitality; or how a particular fluorophore decays over time under exposure to light. FCS offers high spatial resolution while providing an accurate analysis of very low concentrations of biomolecular elements in solution. FCS is an exceptionally sensitive analytical tool because it examines such a small sample of molecules in an extremely tiny solution bed. The advent of confocal technology has certainly assisted in the advancement of FCS's spatial resolution and high-throughput screening. That is why one typically sees FCS used in conjunction with confocal or two-photon excitation microscopy. Improved resolution and rapid screening, along with the combination of short data acquisition times and direct measurement analysis has pushed FCS into the field of intracellular analysis. Intracellular imaging has regained popularity, especially as researchers have begun studying nucleic acid segments in DNA and RNA in greater detail and investigating protein–protein interactions (3). Proteins can fold and alter their native conformation via their amino acid sequences or compound interactions. When this happens randomly with tertiary or quaternary protein structures, there can be serious consequences. The protein transformations in tissue and the nucleic makeup of cells are thought to be the key to a number of deadly and incurable genetic disorders, such as Parkinson's disease. The new ability of FCS to detect intracellular changes may aid in the research of such diseases by allowing researchers to trace and follow biochemical pathways in live, vital cells and organs.
Nanoparticle Dispersion with FCS
Another novel application involving FCS is the characterization and quantification of nanoparticle dispersion. This is important to mention here considering the advantages of nanoparticles in a fluorescent system and the fact that they are superior labels and markers that do not pose the risk of photobleaching. Nanoparticles are an incredible advancement because they bring scientists one step closer to accessing atomic and molecular structures. Effectively, the use of nanoparticles could allow the human species to alter the state of elements and compounds without a chemical reaction or catalyst. They are currently used and will be continuously developed in many biomedical and optical fields. To use nanoparticles, however, it is crucial to determine and understand their diffusion effects in a liquid environment. The best method of analysis is through FCS.
Understanding nanoparticle diffusion will help with applications in vivo and in vitro. Diffusion properties vary under different environments and physical conditions such as core size and shape, capping materials, and viscous or electrically induced fields. Today, one of the biggest problems with using nanoparticles in vivo is the toxicity of the shell and core. Identifying substrates with reduced toxicity is not a simple task, and understanding the rate at which the particles travel in a biological system will help determine appropriate sample sizes and methods of delivery. In addition, the fluorescence and photon correlation will provide a better understanding of the physics and chemistry and how nanoparticles affect protein folding, crystal growth, and general aggregation processes (4).
Using FCS as a Bioassay
Another application where fluorescence correlation spectroscopy can be advantageous is in bioassays. A bioassay is a method for measuring and assaying molecular interactions in solution. Key types of molecular interactions assessed through bioassays include protein-to-protein binding, nucleic acid binding, and protein-to-nucleic acid binding. These applications are specifically useful in drug discovery, medical diagnostics, and environment and biological warfare screening.
In comparison to polymerase chain reaction (PCR) and enzyme-linked immunosorbent assay (ELISA), the technique of FCS offers improvements in quantitative data, normalization time, measurement time, detection, distinction, specificity, and overall design. FCS does not require any normalization before measurement, nor does it require a standard curve to compare present and future data. The measurement time is significantly decreased from about 30 min for real-time PCR and 3–6 h for ELISA down to roughly 10–20 min for FCS. Additionally, the time it takes to assess the assay quality falls from 1–2 h for PCR and 3–6 h for ELISA to <1 min for FCS. There is very little sample handling required for a FCS analysis in comparison to the tedious prework and preparation required for PCR and ELISA, in which DNA amplification and enzyme washing are required. The biggest advantage of using FCS as a bioassay, however, is the reduction of false positives and negatives because of the improvement in the ability to separate signal from noise. Perhaps the only advantage PCR and ELISA have on FCS is the cost of a full system and instrumentation — PCR and ELISA run between $20–30K, while FCS can cost upwards of $100K.
Disadvantages of FCS
There are many advantages of working with fluorescence correlation spectroscopy. However, there are some pitfalls and areas that need improvement. First, when working with biological material, specifically proteins, preparing the sample for inspection can be challenging. Proteins, much like cells, tend to adhere to surfaces that they interact with; proteins can stick to cover slips or the observation chamber because of molecular surface charges (1). Protein adhesion is very noticeable when working with extremely small concentration ratios, and not noticeable at all when working with a large mass of proteins, so it is very important to find a happy medium between the two. Not only is there a risk of the proteins adhering to surfaces, but they also are prone to aggregating with one another and forming a larger mass. If aggregation occurs, one has to account for fluorescence enhancement of the larger aggregate. Photobleaching, discussed earlier, is another frequent problem. Photophysical damage to a specimen will decrease the number of active molecules. Inactive molecules will not fluoresce, and instead will remain idle and possibly inhibit the dynamics of molecules in its vicinity. Although the three pitfalls listed above are minor problems that can easily be resolved or accounted for, it is important to point them out to ensure that the highest quality data are captured and analyzed with FCS (2).
Conclusion
Fluorescence correlation spectroscopy is a very powerful measurement and analytical tool for biological material in vivo and in vitro. The procedure is minimally invasive, which is extremely beneficial, and works on a confocal system to ensure very high spatial and temporal resolution. The information gathered helps determine molecular stability, diffusion coefficients, and a number of internal dynamics, along with photophysical methods. The typical concentration ratio and sample size is a few molecules per nanoliter, resulting in very fast measurements that range from a few nanoseconds to hundreds of milliseconds. As mentioned above, there are a few challenges involving molecular adhesion, aggregation, and photobleaching, but these are avoidable and certainly do not inhibit this advanced technique from evolving further. In the future, FCS may provide groundbreaking information or shed more light on unknown intracellular activity.
Stephan Briggs is the biomedical product line engineer responsible for the microscopy product line and life sciences segmentation at Edmund Optics. He holds a bachelors of science in biomedical engineering from Drexel University and is currently working toward his masters of science. Direct correspondence to:
Stephan Briggs
References
(1) P. Schwille and E. Haustein, Fluorescence Correlation Spectroscopy — An Introduction to its Concepts and Applications (Experimental Biophysics Group, Gottingen, Germany: Biophysics Textbook Online, 2004).
(2) T. Johnstone, NIH Message Board, (July 9, 2002), Retrieved October 3, 2011, from National Institute of Health:
(3) .B. Pawley, Handbook of Biological Confocal Microscopy (Springer, Madison, Wisconsin, 2006).
(4) E.V. Keuren, Lasers and Optical Characterization Lab, October, 2011. Retrieved 2011 from:
Articles in this issue
almost 14 years ago
Market Profile: Fluorescence Correlation Spectroscopyalmost 14 years ago
Productsalmost 14 years ago
Maxwell's Equations, Part Valmost 14 years ago
Managing Mass Spectrometric Dataalmost 14 years ago
Vol 27 No 1 Spectroscopy January 2012 Regular Issue PDFNewsletter
Get essential updates on the latest spectroscopy technologies, regulatory standards, and best practices—subscribe today to Spectroscopy.
Advertisement
Related Content
Advertisement
![Figure 3: Plots of lg[(F0-F)/F] vs. lg[Q] of ZNF191(243-368) by DNA.](https://cdn.sanity.io/images/0vv8moc6/spectroscopy/a1aa032a5c8b165ac1a84e997ece7c4311d5322d-620x432.png?w=350&fit=crop&auto=format)

Advertisement
Advertisement