Comparison of Secondary Structures of Similar Proteins Using Automated CD
Application Notebook
In this study, far-UV CD spectra of eight different mammalian serum albumins were measured repeatedly using automated CD spectroscopy. Two independent methods of normalizing the CD data were used to eliminate the need for accurate knowledge of protein concentration or extinction coefficient. The normalized far-UV data, representative of secondary structure, were compared to determine if there were statistically significant differences between samples. The two normalization methods agreed in every case, increasing confidence in the results.
In this study, far-UV CD spectra of eight different mammalian serum albumins were measured repeatedly using automated CD spectroscopy. Two independent methods of normalizing the CD data were used to eliminate the need for accurate knowledge of protein concentration or extinction coefficient. The normalized far-UV data, representative of secondary structure, were compared to determine if there were statistically significant differences between samples. The two normalization methods agreed in every case, increasing confidence in the results.
Experimental Conditions
The eight proteins (~1 mg/mL) were dissolved in buffer (20 mM phosphate, 150 mM NaF, pH 7.4). Aliquots of sample and buffer were pipetted into a microtiter plate. Three independent sets were loaded permitting triplicate measurements and the determination of standard deviations. Samples were transferred using a fixedprobe robot from the microplate to a 0.1 mm pathlength flow-cell. CD and absorption spectra were measured simultaneously and four repeats for each of the 36 wells used were recorded. The experiment ran unattended overnight, using a Chirascan-plus automated CD spectrometer. CD and absorption data were processed by automated averaging and then subtraction of buffer baselines. Averaging across repeat samples gave standard deviations which were propagated through all subsequent calculations.

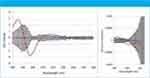
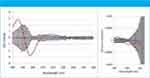
Figure 1: Difference-CD and difference G-factor spectra, hamster SA vs. human SA.
Results
Human serum albumin (HSA) was chosen as the reference protein to which the seven others were compared. CD spectra were normalized to that of HSA using the sum of the absolute CD values across all wavelengths; a second method of normalization involved calculating the G-factor spectra (1). Difference-CD and difference-G-factor spectra were plotted with their associated two-sigma error bars: representative spectra from the set are shown in Figure 1. Where there is systematic excursion from zero and in particular outside the 2-sigma (95% confidence) limits, a significant difference in secondary structure is indicated. Confidence in these results is high because the control experiment shows no systematic excursion and because the independent methods of normalization agreed in every case.
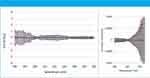

Figure 2: Control experiment - difference-CD and difference Gfactor spectra, human SA (0.2 mm cell) vs. human SA (0.1 mm cell).
Conclusion
This model study shows that it is relatively straightforward to identify very subtle differences in protein conformation without accurate knowledge of protein concentration or extinction coefficient. Establishing whether or not the higher structures of proteins are similar is becoming increasingly important with the advent of generic biotherapeutics. The automation of CD spectroscopy opens up applications that were previously inaccessible and, in this example, offers a critical insight into subtle conformational differences in similar proteins.
References
(1) B. Baker and R. Garrell, Faraday Discuss. 126, 245–254 (2004).
Applied Photophysics Ltd
21 Mole Business Park, Leatherhead, Surrey, United Kingdom
tel. +44 (0)1372 386537; Fax +44 (0)1372 386477
Email: sales@photophysics.com


Single Cell and Microplastic Analysis by ICP-MS with Automated Micro-Flow Sample Introduction
April 25th 2024Single cell ICP-MS (scICP-MS) is increasingly seen as a powerful and fast tool for the measurement of elements in individual cells, mainly due to the high sensitivity and selectivity of ICP-MS. Analysis is performed in the same way as single nanoparticle (spICP-MS) analysis, which has become a well-established technique for the analysis of nanoparticles and particles.
Hot News on Agilent LDIR, New Developments, and Future Perspective
April 25th 2024Watch this video featuring Darren Robey and Dr. Wesam Alwan from Agilent Technologies to gain insights into the future trends shaping microplastics research and the challenges of their characterization. Discover the essential components necessary for accurate microplastics analysis and learn how the Agilent 8700 LDIR system addresses these challenges. Offering rapid and precise analysis capabilities, along with easy sample preparation methods that minimize contamination, the Agilent 8700 LDIR system is at the forefront of advancing microplastics research.
The World of Microplastics Up to Date – an Overview
April 23rd 2024Watch this 20-minute educational video by Andreas Kerstan, Agilent Product Specialist in molecular spectroscopy, to gain a comprehensive update on the microplastics landscape and the environmental concerns related to them. Discover the current challenges in microplastics characterization and how Agilent innovative solutions and techniques, including FTIR, LDIR, GC/MS, and ICP-MS, are addressing these issues head-on.

