Far-Ultraviolet Spectroscopy
In celebration of Spectroscopy’s 35th Anniversary, leading experts discuss important issues and challenges in analytical spectroscopy.
In this review, I define the far-ultraviolet (FUV) region as that for 120–200 nm (1). In the FUV region, a number of electronic transitions, due to π electrons, lone pair electrons, and σ electrons, are observed, however, absorption spectroscopy in the FUV region of the condensed phase was an unexplored area of molecular spectroscopy (1–6). FUV spectroscopy has a long history as spectroscopy of a gas state (1,2,4). However, the progress in FUV spectroscopy for analysis of the condensed phase has been rather slow (1–6). The most important reason for this slow progress is the very high absorptivity of a molecule in the FUV region. We introduced an attenuated total reflectance (ATR) technique to the FUV region 12 years ago (1–6). The ATR-FUV method has made it possible to investigate electronic states of almost all types of molecules in the condensed phase. Recently, ATR-FUV spectroscopy has been applied extensively to a wide area of research fields including physical chemistry, analytical chemistry, solution chemistry, electrochemistry, materials sciences, nanoscience and technology, and industrial applications (1–6).
Characteristics and Advantages of FUV Spectroscopy
Even materials that do not show a significant absorption in the region longer than 200 nm yield intense absorptions in the FUV region. Water and n-alkanes are good examples. Thus, FUV spectroscopy is a unique electronic spectroscopic technique. It has opened a new avenue for σ chemistry. The characteristics of FUV spectroscopy for liquid and solid studies may be summarized as follows (1–6):
- Electronic transitions and structure of a molecule, which one cannot investigate by ordinary UV spectroscopy, can be explored. In the FUV region, not only π–π* and n–π* but also n– σ* and σ–Rydberg transitions may be observed (1,4).
- One can explore Rydberg transitions of solids and liquids (1,4). For example, FUV spectroscopy reveals the existence of confined Rydberg excited states in the liquid phase and strong valence-Rydberg coupling.
- Water absorbs light strongly in the region shorter than 170 nm. Therefore, FUV spectroscopy is very suitable for studying water, aqueous solutions, and adsorbed water (1,10).
One can investigate intermolecular interaction, hydrogen bonding, and hydrations of solids and liquids. It is of note that Morisawa and colleagues explored CH···HC interactions of alkanes by the use of FUV spectroscopy (11).
- Thanks to the ATR technique, ATR–FUV spectroscopy has its own advantages, enabling us to probe the surface structure and properties of materials (1,8–10).
FUV spectroscopy has widespread applications (1–6). For example, FUV spectroscopy has provided new opportunities for materials research (1,4–6). It has been applied to studies of polymers, semiconductor materials (8,9), ionic liquids (13), and nanomaterials. We developed a nanosecond pump-probe transient FUV spectrometer to probe radical species in chain reactions such as an O3 pulse-photolytic reaction in an aqueous solution (1). On-line analysis such as monitoring of semiconductor cleaning solutions and disinfectant solutions is also possible by employing FUV spectroscopy (1,8,9). Tanabe and associates have proposed FUV-deep ultraviolet (DUV) surface plasmon resonance (SPR) sensors using Al thin films (1,5,6).
Applications of ATR-FUV Spectroscopy
In this section I introduce several examples of applications of ATR-FUV spectroscopy (1,3,4).
Electronic States of Alkanes In Liquid and Solid Phases Studied by ATR-FUV Spectroscopy
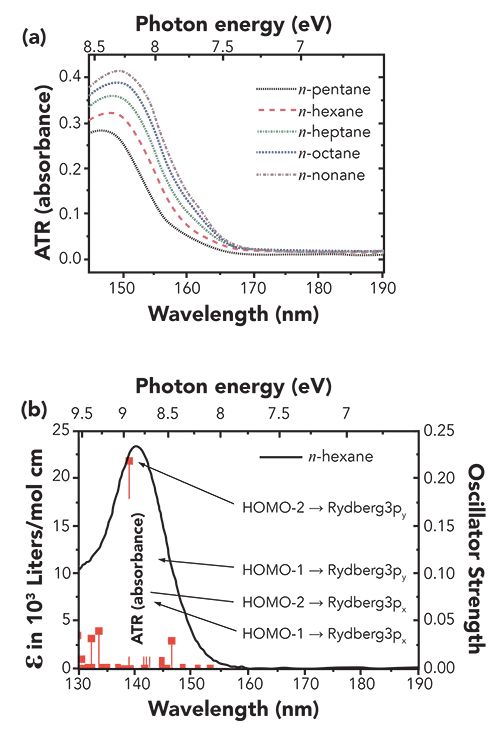
Morisawa and associates investigated electronic states and structure of liquid alkanes, alcohols, ketone, and amides using ATR-FUV spectroscopy and quantum chemical calculations (1,4,7). They obtained a number of interesting results, not only on electronic states and transitions where Rydberg orbitals are involved, but also on the effects of molecular interactions on valence electrons (σ electrons) of single bonds of a molecule. Figure 1a shows ATR-FUV spectra of n-alkanes in the liquid phase (7). The FUV spectra of n-alkanes show a broad feature near 150 nm. It shows a lower energy shift with a significant intensity increase as the alkyl chain length increases. Figure 1b depicts simulation spectra for n-hexane derived from quantum chemical calculations (using time-dependent density functional theory [TD-DFT/aug-cc-pVTZ]) (7). The calculated spectra are in good agreement with the experimental spectra in terms of the shift and intensity increase with the number of carbon atoms. It can be seen from Figure 1b that the most intense peak is due to the transition from HOMO-2 to Rydberg 3py (T1) molecular orbitals (7). It was found from the quantum chemical calculations that the redshift of the 150 nm band arises from the destabilization of HOMO-2 and HOMO-3 orbitals and the stabilization of Rydberg 3py level. Alkanes consist only of single bonds and do not have non-covalent electron pair, and thus, the transition giving the 150 nm band reflects the state of σ electrons of alkanes (1,4,7).

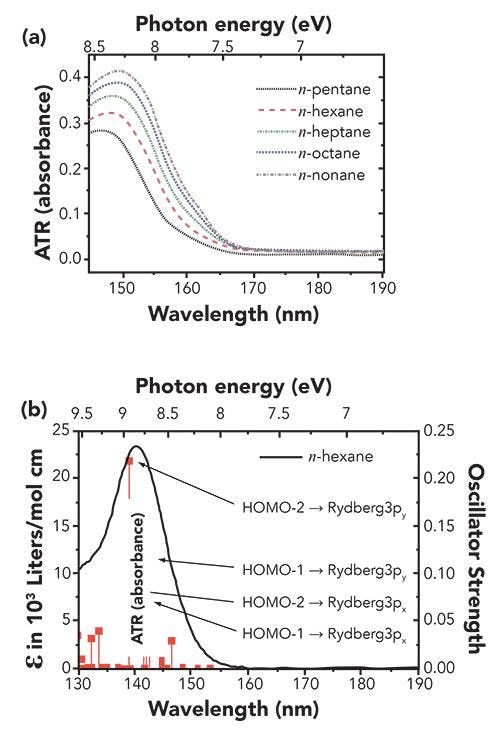
Figure 1: (a) ATR-FUV spectra of n-alkanes. (b) A theoretical spectrum for n-pentane derived from TD-DFT/aug-cc-pVTZ. Reproduced from (7) with permission.
FUV spectroscopy allowed Morisawa and associates (11) to explore interactions between alkanes in a crystal, which are very important to the understanding of interactions that involve hydrogen atoms with the same polarity, such as CH···HC. They measured temperature dependence of ATR–FUV spectra of n-tetradecane during (A) cooling and (B) heating between 15 to −38 °C (11). The band at 153 nm in the liquid phase becomes weaker, and instead, new bands appear at around 200 and 230 nm with decreasing temperature. Of note is that the conversion from the 153 nm band to the 200 and 230 nm bands occurs at the melting temperature, and the spectral changes are reversible during cooling and heating processes (11). Therefore, it is very likely that the changes in the electronic states are induced by changes during the phase transition.
To explain the observed temperature-dependent variations Morisawa and associates (11) carried out TD–DFT calculations using a model dimer structure of n-pentane and periodic DFT calculations of polyethylene crystal structure. It was found from the calculation that the band intensity at 141 nm becomes weak as the intermolecular distance is decreased from 6 to 3 Å. The spectrum of the dimer with r = 3 Å shows three bands at lower energy below 141 nm. These changes in the simulated spectra are in good agreement with that observed ones in the experimental spectra.
The ATR-FUV spectra of the low-temperature solid n-alkane indicate that the energy of its HOMO and the energy gap between its HOMO and LUMO in the solid phase are reduced to approximately 60% of those in the liquid phase (11).
FUV and DUV Studies of Electronic Structures and Photocatalytic Activities of TiO2 and TiO2 Modified Metal Nanoparticles
Tanabe and associates (8,9) applied the ATR-FUV-DUV spectroscopy to investigate electronic states and photocatalytic activities of TiO2 and metal (Pt, Pd, and Au)-modified TiO2 powders. ATR-FUV-DUV spectra of TiO2 (blue) and Au- (red), Pd- (green), Pt- (purple) modified TiO2 are shown in Figure 2a (8). The spectra show a distinct peak in the FUV region (about 160 nm) assigned to the t2g(π) → eg(σ*) transition. It was found that upon the deposition of metal nanoparticles, the absorption intensity at the longer wavelength region decreases, while that at the shorter wavelength region increases (Figure 2a–b). Tanabe and associates (8) calculated the degree of spectral changes as the integrated intensity ratio of absorption in the 150–180 nm region to that in the 270–300 nm region. Figure 2c plots the integrated intensity ratio versus the difference in the work function between TiO2 and each metal (8). It is noted that there is a strong positive correlation between the calculated ratio and the work function of the modified metal.

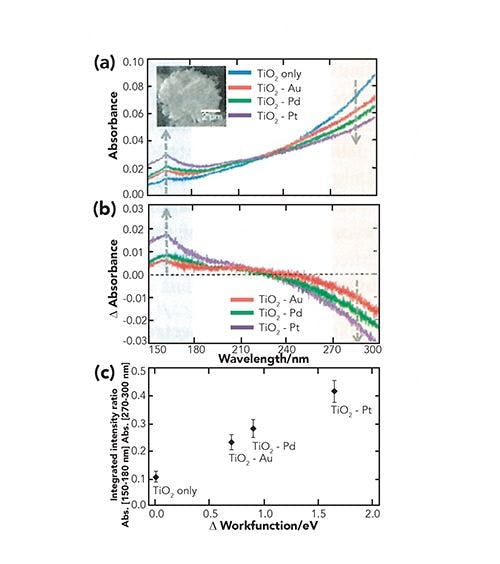
Figure 2: (a) ATR-FUV-DUV spectra of TiO2 (blue) and Au- (red), Pd- (green), Pt- (purple) modified TiO2. (b) Difference spectra of TiO2 between spectra measured before and after metal modification. (c) Integrated intensity ratio versus the difference in the work function between TiO2 and each metal. (Reproduced from reference [8] with permission).

Figure 2: (a) ATR-FUV-DUV spectra of TiO2 (blue) and Au- (red), Pd- (green), Pt- (purple) modified TiO2. (b) Difference spectra of TiO2 between spectra measured before and after metal modification. (c) Integrated intensity ratio versus the difference in the work function between TiO2 and each metal. (Reproduced from reference [8] with permission).
ATR-FUV-DUV spectroscopy was also applied to study the photocatalytic activities of TiO2 and TiO2 modified with Au, Pt, and Ad nanoparticles (9). Their photocatalytic activities, estimated by photo-induced degradation reaction of methylene blue aqueous solution, showed strong dependence on the metals. Tanabe and associates plotted the photocatalytic activity versus work function difference between TiO2 and each metal (9). It is very likely that the larger work-function difference results in an increased electron inflow from TiO2 to the metal, and thus, in a stronger enhancement of the charge separation, thereby increasing the TiO2 photocatalytic activity. The result obtained by ATR-FUV-DUV technique was in agreement with previous studies on a correlation between the work function of the metals and the photocatalytic activity.
Structure of Water Adsorbed on an Aluminum Surface Studied by the Variable Angle-ATR-FUV Technique
Goto and associates (10) explored the structure of liquid water on an aluminum surface by variable angle (VA) ATR-FUV spectroscopy. The VA-ATR technique enables one to tune the penetration depth of the evanescent wave of the probe light by varying the incident angle.
FUV absorption spectra of H2O on the aluminum with incident angles from 58.4 to 71.8° (10). As θ increased from 58.4 to 71.8°, the band maxima due to H2O showed a lower energy shift were blue-shifted from 8.41 to 8.48 eV, the α values increased from 2.01 x 105 cm-1 to 2.39 x 105 cm-1 (10). The observed blue-shift, increasing absorptivity, and broadening bandwidth with larger θ (shortening dp) reflect the electronic nature of the interfacial water. It is possible to examine the spectral difference between bulk and interfacial phases of liquid samples by analyzing the spectral variations with the incident angle.
From the VA-ATR-FUV spectra of liquid H2O on an alumina prism, the bands of the bulk and interfacial water on the alumina surface are able to be individually determined. The optimum spectra of the bulk and interfacial phases were calculated with the alternating least squares (ALS) method (10). The bands of the bulk and interfacial water are clearly different. The interfacial water band is much closer to the band of ice rather than that of the bulk water. Moreover, the red-tailing of the band was peculiarly observed only for the interfacial water (10). This tailing was ascribed to the broken hydrogen-bond acceptor of water.
Future Prospects
FUV spectroscopy hold considerable potential as new electronic spectroscopy. From a spectroscopic perspective, measurements in the whole FUV–DUV–UV–VIS region (140–800 nm) will be more popular because one can extract different information about electronic structure and transitions at the same time. Imaging techniques may be introduced to the FUV region soon, and the combination of imaging and variable-angle-incidence techniques may be very interesting from the perspective of materials and reactions research.
FUV spectroscopy holds a bright future for its practical applications. Among them, on-line and in-line analyses have attracted strong interest. Recent studies by Morisawa and associates (12) on changes on the electronic transitions of polyethylene glycol upon the formation of a coordinate band with Li+ and by Tanabe and associates (13) on electrochemical ATR-FUV spectroscopy demonstrate the future trend of FUV spectroscopy.
References
- Y. Ozaki and S. Kawata, Eds., Far- and Deep-Ultraviolet Spectroscopy (Springer, Tokyo, Japan, 2015).
- Y. Ozaki, Y. Morisawa, A. Ikehata, and N. Higashi, Appl. Spectrosc. 66, 1–25 (2012).
- Y. Ozaki, Bull. Chem. Soc. Jpn. 92, 629–654 (2019).
- Y. Morisawa, I. Tanabe, and Y. Ozaki, in J. Laane ed., Frontiers and Advances in Molecular Spectroscopy (Elsevier, Amsterdam, The Netherlands, 2018). p. 251.
- Y. Ozaki and I. Tanabe, Analyst 141, 3962–3981(2016).
- I. Tanabe and Y. Ozaki, J. Mater. Chem. C4, 7706–7717 (2016).
- Y. Morisawa, S. Tachibana, M. Ehara, and Y. Ozaki, J. Phys. Chem. 116, 11957–11964 (2012).
- I. Tanabe and Y. Ozaki, Chem. Commun.50, 2117–2119 (2014).
- I. Tanabe, T. Ryoki, and Y. Ozaki, Phys. Chem. Chem. Phys. 16, 7749–7753 (2014).
- T. Goto, A. Ikehata, Y. Morisawa, and Y. Ozaki, J. Phys. Chem. Lett. 6, 1022–1026 (2015).
- Y. Morisawa, S. Tachibana, A. Ikehata, T. Yang, M. Ehara, and Y. Ozaki, ACS Omega 2, 618–625 (2017).
- N. Ueno, T. Wakabayasgi, H. Sato, and Y. Morisawa, J. Phys. Chem. A 123, 10746–10756 (2019).
- I. Tanabe, A. Suyama, T. Sato, and K. Fukui, Anal. Chem. 91, 3436–3442 (2019).


Yukihiro Ozaki is a professor emeritus of Kwansei Gakuin University, in Sanda, Hyogo, Japan. Direct correspondence to yukiz89016@gmail.com


Synthesizing Synthetic Oligonucleotides: An Interview with the CEO of Oligo Factory
February 6th 2024LCGC and Spectroscopy Editor Patrick Lavery spoke with Oligo Factory CEO Chris Boggess about the company’s recently attained compliance with Good Manufacturing Practice (GMP) International Conference on Harmonisation of Technical Requirements for Registration of Pharmaceuticals for Human Use (ICH) Expert Working Group (Q7) guidance and its distinction from Research Use Only (RUO) and International Organization for Standardization (ISO) 13485 designations.


