Rise of the Machines: SERS Instrumentation and Machine Learning Enabling Complex Bioanalysis
Spectroscopy
In celebration of Spectroscopy’s 35th Anniversary, leading spectroscopists discuss important issues and challenges in analytical spectroscopy.
Advances in instrumentation and data analysis suggest that surface enhanced Raman scattering (SERS) is a powerful tool to characterize complex samples. Since the initial experiments and subsequent realization that Raman signals are significantly enhanced on the surface of plasmonic, structured, metal surfaces, surface enhanced Raman scattering (SERS) has evolved into an ultrasensitive method for chemical analysis (1–3). Indeed, understanding of how light is concentrated and how the local fields are enhanced and re-radiated by plasmonic structures has driven SERS research forward (4). Advances in SERS substrates, now commercially available from a number of sources, and improved sampling strategies, suggest that SERS is poised to be potent analytical technique. Indeed, it is now relatively straightforward to produce a SERS signal, and with this greater understanding of signal enhancements, increased attention is being given to applications using SERS.
However, since the early days of SERS, one of the more befuddling aspects of SERS analysis has been that the SERS spectrum observed from a molecule is not always the same as the spontaneous Raman spectrum. The origin of these spectral differences has been attributed to surface selection rules, charge-transfer effects, photo-reactions, and other phenomena (5–8). Indeed, these signal variations have raised suggestions that libraries of SERS spectra are needed to properly identify analytes in mixtures. This need for libraries is complicated by observations that the SERS signal from a sample can vary depending on common variables like the substrate or laser excitation wavelength.
Although the identity of an unknown molecule, or molecules, in a complex system (such as human biofluids) that give rise to a SERS signal can be elusive, new advances in computing are enabling SERS analysis of complex systems through machine learning and related algorithms (9). The detected bands in a SERS spectrum provide an information-rich signal that can be analyzed with computer algorithms, even if an analyst does not know the molecular origin of the signal. Algorithms include neural networks, random forest, and artificial intelligence algorithms, as well as multivariate regression and other chemometric routines. With a rise in companies producing commercial software and the availability of web-based shareware routines, the activation barrier to these analyses methods continues to decrease.
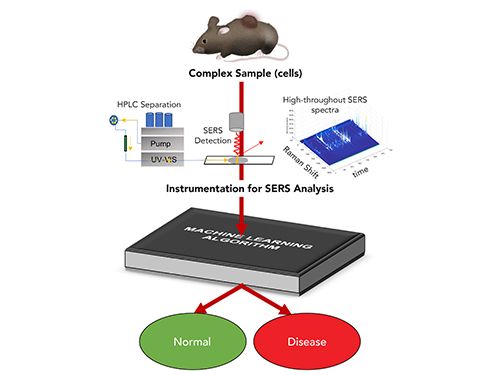
The underlying principle of machine learning is that given enough data, a computer can use small fluctuations and patterns to classify the outcome. The most common approach is to use a training set‚ samples of known classes to generate a neural network or other machine learning model that will properly capture the variance in the sample data and predict to what class an unknown sample belongs. As the cost of computing power decreases, more-sophisticated methods are accessible to analyze data. The clear advantage of machine learning is that the chemically rich SERS signal, where each vibrational mode detected acts as a variable, can classify the complex sample signals as arising from different specific classes, such as healthy or diseased cells (Figure 1). As the instrumentation and methods using SERS increase the ability to generate large amounts of SERS data quickly, these analyses provide an incredibly powerful way to utilize the chemical information in the SERS spectra for diagnostic assays and to monitor chemical changes. With increased training sets, there is potential to refine such classes further, such as to determine which treatment will likely be most effective for a disease.


FIGURE 1: Flow chart illustrating how SERS provides chemical information from a sample to enable diagnostic assays.
The downside to machine learning algorithms is that the models rely on appropriate training data and, for the most part, can only classify a sample into classes that have been predetermined. Both supervised and unsupervised methods exist, but all models require validation against data sets with known classifications. A further downside to these methods is the loss of information. Although the variance in the SERS data arises from molecular differences, the identity of these molecules can be difficult to recover. Returning to the biofluid example, the machine learning algorithm may classify a sample correctly; however, information, such as a specific upregulated biomolecule to be targeted for therapy, is lost. Complementary methods are often necessary to further assess the disease.
In a recent study we were able to perform SERS detection following a high-performance liquid chromatography (HPLC) separation of a mouse tumor cell lysate and show that the molecular composition significantly changed between healthy and various types of cancerous cells (10). The molecules with consistent increases in concentration generated patterns that appear to be characteristic of the sampled cells. These patterns can be readily differentiated by machine learning algorithms. Again, although the identity of the molecules detected by HPLC are unknown, computer models can use the patterns in the observed spectra to track and diagnose disease. Additionally, analysis of the underlying data may indicate key biomolecules important in the disease, without knowing the identity of the actual molecules. In such cases where knowing the identity of a specific molecule is not necessary, the ability to rapidly generate SERS spectra and analyze them with machine learning makes it possible to capture the chemical information in SERS data to enable informative characterization.
References
- M. Fleischmann, P.J. Hendra, A.J. McQuillan, Chem. Phys. Lett. 26(2), 163–166 (1974).
- D.L. Jeanmaire and R.P. Van Duyne, J. Electroanal. Chem. Interfacial Electrochem. 84(1), 1–20 (1977).
- M. Moskovits, J. Chem. Physics 69(9), 4159–4161 (1978).
- J. Langer, D. Jimenez de AberÂasturi, J. Aizpurua, R.A. Alvarez- Puebla, B. Auguié, J.J. BaumÂberg, G.C. Bazan, S.E.J. Bell, A. Boisen, A.G. Brolo, J. Choo, D. Cialla-May, V. Deckert, L. Fabris, K. Faulds, F.J. García de Abajo, R. Goodacre, D Graham, A.J. Haes, C.L. Haynes, C Huck, T. Itoh, M. Käll, J. Kneipp, N.A. Kotov, H. Kuang, E.C. Le Ru, H.K. Lee, J.-F. Li, X.Y. Ling, S.A. Maier, T. Mayerhöfer, M. Moskovits, K. Murakoshi, J.-M. Nam, S. Nie, Y. Ozaki, I. Pastoriza-Santos, J. Perez-Juste, J. Popp, A Pucci, S Reich, B Ren, G.C. Schatz, T. Shegai, S. Schlücker, L.-L. Tay, K.G. Thomas, Z.-Q. Tian, R.P. Van Duyne, T. Vo-Dinh, Y. Wang, K.A. Willets, C Xu, H. Xu, Y. Xu, Y.S YaÂmamoto, B. Zhao, and L.M. Liz- Marzán, ACS Nano 14(1), 28–117 (2019).
- J. SzczerbiÅski, L. Gyr, J. Kaeslin, and R. Zenobi, Nano Lett. 18(11), 6740–6749 (2018).
- Y. Zhang, S. He, W. Guo, Y. Hu, J. Huang, J.R. Mulcahy, and W.D Wei, Chem. Rev. 118(6), 2927–2954 (2018).
- J.R. Lombardi and R.L. Birke, Accounts Chem. Res. 42(6), 734–742 (2009).
- Y.-F. Huang, H.-P. Zhu, G.K. Liu, D.Y. Wu, B. Ren, and Z.Q. Tian, J. Am. Chem. Soc. 132(27), 9244–9246 (2010).
- F. Lussier, V. Thibault, B. Charron, G.Q. Wallace, and J.-F. Masson, TrAC Trends Anal. Chem. 124, 115796 (2020).
- L. Xiao, C. Wang, C. Dai, L.E. Littlepage, J. Li, and Z.D. Schultz, Ang. Chemie 59(9), 3439–3443 (2020).


Zachary D. Schultz is an associate professor at The Ohio State University. Direct correspondence to schultz.133@osu.edu


Nanometer-Scale Studies Using Tip Enhanced Raman Spectroscopy
February 8th 2013Volker Deckert, the winner of the 2013 Charles Mann Award, is advancing the use of tip enhanced Raman spectroscopy (TERS) to push the lateral resolution of vibrational spectroscopy well below the Abbe limit, to achieve single-molecule sensitivity. Because the tip can be moved with sub-nanometer precision, structural information with unmatched spatial resolution can be achieved without the need of specific labels.


