News|Articles|February 13, 2026

Advanced Computational Methods in Spectroscopy: A Q&A Guide

Fact checked by: Jerome Workman, Jr.
Listen
0:00 / 0:00

Spectroscopists are routinely embracing complex algorithms to handle high-dimensional, nonlinear, and multimodal data. Why is this happening? We explore this question in this tutorial.

Spectroscopy published an online content series, titled “Unsolved Problems in Spectroscopy,” which explored evolving intersection of advanced computational methods and spectroscopic analysis, focusing on the limitations of traditional linear models. Written by associate editorial director Jerome Workman, Jr., the series examined how statistical power with physical interpretability helped improve accuracy in pharmaceutical, environmental, and industrial applications.

To that end, spectroscopists are routinely embracing complex algorithms to handle high-dimensional, nonlinear, and multimodal data. Why is this happening, and why is this an improvement in spectroscopic analysis? In this Q&A, we address these questions and more, as we explore how advanced computational methods are reshaping spectroscopic analysis and how you might apply these methods in your own work.

Q: Why are researchers moving beyond traditional linear models like partial least squares (PLS)?

A: Although linear methods like PLS have been central to chemometrics, real-world systems often exhibit nonlinear effects that violate linear assumptions.1 These deviations arise from chemical effects, which include spectral band saturation at high concentrations or hydrogen bonding; physical effects (like scattering in diffuse reflectance); and instrumental artifacts (such as detector nonlinearity or stray light).1 To improve prediction accuracy, especially when transferring models between instruments, detecting and correcting these nonlinearities is essential.1

Q: What are some specific nonlinear methods currently used in spectroscopic calibration?

A: There are several advanced mathematical frameworks employed to address these challenges. We highlight some of the most common ones below:

  1. Polynomial Regression: A simple extension for mild nonlinearities, though it can overfit high-dimensional spectra.1
  2. Kernel Partial Least Squares (K-PLS): Maps data into a high-dimensional feature space to capture complex nonlinearities without explicit computation.1
  3. Gaussian Process Regression (GPR): A Bayesian approach that provides uncertainty estimates but is computationally intensive for large data sets.1
  4. Artificial Neural Networks (ANNs): Highly flexible models suitable for massive datasets like hyperspectral imaging, though they often require significantly large data sets and lack inherent interpretability.1

Q: What is "Data Fusion," and how does it enhance chemical analysis?

A: Data fusion integrates information from different modalities, such as vibrational (infrared [IR], Raman) and atomic (inductively coupled plasma–optical emission spectroscopy [ICP-OES], X-ray) spectroscopies, to provide a more comprehensive sample analysis than any single technique could.2 For example, in pharmaceuticals, vibrational methods can quantify excipients while atomic methods track elemental impurities.2 Fusion strategies include early fusion (stacking raw data), intermediate fusion (using shared latent spaces), and late fusion (combining decisions from separate models).2

Q: As models become more complex, how can researchers trust their "black box" predictions?

A: The "black box" nature of advanced machine learning (ML) is a significant hurdle, particularly in regulatory or clinical environments.3 Explainable AI (XAI) techniques are being developed to overcome this obstacle. Tools like SHAP (SHapley Additive exPlanations), LIME, and saliency maps help identify which specific wavelengths or spectral regions are driving a prediction.3 This allows researchers to verify that model decisions are based on chemically meaningful features rather than noise or artifacts.3

Q: What are the primary remaining challenges in these computational workflows?

A: Currently, AI is a hot topic in spectroscopic analysis. As a result, some of the primary remaining challenges in computational workflows revolve around integrating AI with spectroscopy. For example, spectroscopic data contains thousands of highly correlated wavelengths, making it difficult to attribute predictions to specific chemical signals.3 Another challenge is that there is still a trade-off between accuracy and transparency. Highly accurate deep learning models are often the most opaque, while interpretable linear models may underfit complex data.3 And finally, there are challenges associated with data alignment and scaling. In data fusion, different modalities often have varying resolutions and dynamic ranges, requiring complex interpolation and normalization.2

Q: What does the future of spectroscopic computation look like?

A: Currently, spectroscopic computation is shifting toward hybrid physical–statistical models that combine radiative transfer theory with machine learning (ML) to ensure both accuracy and interpretability.1,2 Ultimately, the goal is to create predictive digital twins, where measurements across different domains are seamlessly integrated for real-time analysis of chemical systems.2 Simply stated, this involves combining physics-based models and AI to build build smart, real-time virtual models of chemical systems that help our understanding and predict behavior more accurately for chemical systems.

References

  1. Workman, Jr. J. Beyond Linearity: Identifying and Managing Nonlinear Effects in Spectroscopic Data. Spectroscopy. Available at: https://www.spectroscopyonline.com/view/beyond-linearity-identifying-and-managing-nonlinear-effects-in-spectroscopic-data (accessed 2026-02-11).
  2. Workman, Jr., J. Data Fusion in Action: Integrating Different Vibrational and Atomic Spectroscopy Data. Spectroscopy. Available at: https://www.spectroscopyonline.com/view/data-fusion-in-action-integrating-different-vibrational-and-atomic-spectroscopy-data (accessed 2026-02-11).
  3. Workman, Jr., J. Demystifying the Black Box: Making Machine Learning Models Explainable in Spectroscopy. Spectroscopy. Available at: https://www.spectroscopyonline.com/view/demystifying-the-black-box-making-machine-learning-models-explainable-in-spectroscopy (accessed 2026-02-11).

Related to this article

2026 SciX Conference Summary ©   Bos Amico -chronicles-stock.adobe.com
SciX 2026, the annual conference presented by the Federation of Analytical Chemistry and Spectroscopy Societies (FACSS), ran October 4–9, 2026, at the Nugget Casino Resort in Sparks, Nevada. The program spanned atomic and molecular spectroscopy, mass spectrometry, chemometrics, and bioanalysis. This report follows the meeting day by day, from Monday's clinical Raman plenaries to Friday's closing talks, drawing on the online program and Spectroscopy coverage of award winners, highlighting efforts to move Raman, SERS, LIBS, and single-particle ICP-MS toward clinical, environmental, and field use.
2026 SciX Conference Innovation ©   Dilok -chronicles-stock.adobe.com
Four finalists for the FACSS Innovation Award presented on the afternoon of October 8, 2026, at SciX 2026. Their work spanned drone-mounted laser-induced breakdown spectroscopy (LIBS), a touch-and-sound virtual reality system for blind scientists, polarized infrared (IR) imaging of shape memory polymers, and an ultrasound-activated plasmonic nanoplatform aimed at Parkinson’s disease.
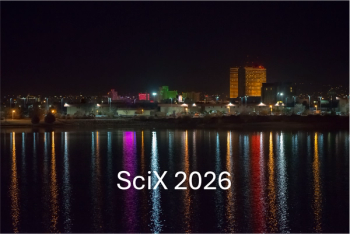
Sparks near Reno Nevada – Site of 2026 SciX Conference ©   DTM Media  -chronicles-stock.adobe.com
Wednesday's program at SciX 2026 kept returning to one question: can spectroscopy perform outside the controlled laboratory? Speakers took surface-enhanced Raman scattering (SERS), laser-induced breakdown spectroscopy (LIBS), mid-infrared photonics, chemometrics, and fluorescence excitation–emission matrix (EEM) spectroscopy into clinics, food plants, reactor coolant loops, brine fields, and drinking water supplies.
NIR Spectroscopy of the Brain and Other Complex Analyses, ©   Navaporn  -chronicles-stock.adobe.com
Near-infrared spectroscopy has quietly stopped being a niche calibration exercise and started acting like an autonomous diagnostic partner, reading consciousness in an injured brain, steering a fermenter without a human hand, and hunting invisible plastic in a glass of water. The tool chemists once used to check moisture in grain is now fusing with artificial intelligence to make decisions no spectrometer could make alone.
Infrared Reimagined: How FT-IR Spectroscopy Learned to Read Molecules, ©  Luis Eduardo  -chronicles-stock.adobe.com
FT-IR spectroscopy, long treated as a mature bench technique for confirming a carbonyl stretch or fingerprinting a polymer, has quietly become one of chemistry’s most versatile discovery engines: it now infers molecular structure straight from a spectrum without a reference library, resolves chemistry tens of nanometers wide, and screens a fingerstick of blood for disease in minutes. The last five years of published research show FT-IR moving from a confirmatory tool into a predictive, autonomous, and field-ready analytical platform.