How has Raman spectroscopy been applied to the development of materials that are important in technology?
How has Raman spectroscopy been applied to the development of materials that are important in technology?
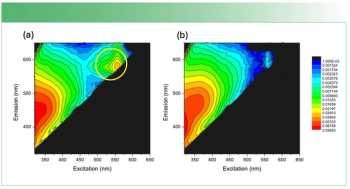
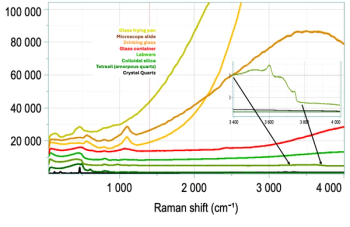
This column will show Raman results and ATEEM fluorescence whose correlations indicate that important information is available non-destructively.
In this "Molecular Spectroscopy Workbench" column, a new spectroscopy, called A-TEEM, is explored.

In this column, I describe what I believe may be the origin of this fluorescence emission and support my conjecture with some measurements of polycyclic aromatic hydrocarbons (PAHs). Understanding the origin of these interfering backgrounds may enable you to design experiments with less interference, avoid the laser illuminations that make things worse, or both.

Because there is a different Raman signature for each of the polymorphs as well as the contaminants, Raman microscopy is an ideal tool for analyzing the structure of these materials as well as identifying possible contaminants that would also interfere with performance.

In this article, we show a cross-sectional map of a film compared to a depth profile to evaluate the quality of depth profile measurements.

Here, we will show the chemical and spectral changes that occur during the cure of a commercial epoxy.

The use of polarized Raman microscopy to complement the polarized light micrographs of spherulites in polymers reveals much about the orientation behavior of the lamellae in spherulites.
Raman spectroscopy has the capability of accurately determining the physical and chemical properties of bioplastics (polyhydroxybutyrate hexanoate [PHBHx]), which helps determine the maximum crystallinity a polymer can experience.

Studying the crystallinity of biodegradable polymers can be done without the complexity of larger instruments. Here’s how.

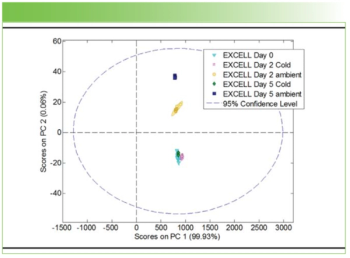
Extractables and leachable are typically studied using chromatographic techniques. This study explores what we can learn by using from using Raman microscopy for such studies.

Here, we explain how Raman spectroscopy is valuable for characterizing industrially important carbon materials.
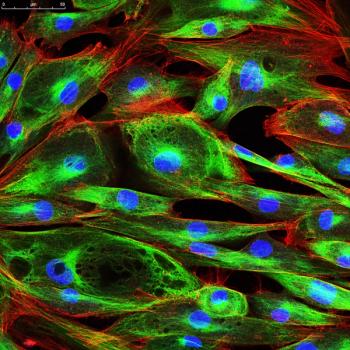
Raman spectra can help determine protein structure. Here’s how.

We explain how to characterize barium fluorohalides with Raman spectroscopy.

Innovative database search technology can help Raman spectroscopists identify molecular vibrations; here, we show how to use these tools more effectively.

To better understand Raman spectral profiles, we briefly examine spectral line shapes, while discussing spectral shape, bandwidth, and broadening as percentage of Gaussian and Lorentzian components.
We illustrate how matching the optical properties of the microscope objective with the sample properties improves the spatial resolution and chemical speciation in depth profile measurements using confocal Raman microscopy.
Raman and photoluminescence spectroscopy were combined with imaging to examine the spatial variation of solid-state structure and electronic character of two-dimensional (2-D) tungsten disulfide (WS2) crystals, which represent a family of new inorganic 2-D materials.
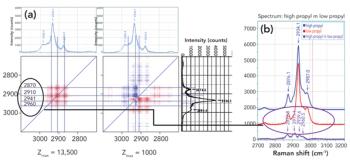
Raman spectra were measured in combination with 2D-COS analysis to understand how the addition of propyl side groups to a biopolymer backbone influences the structure of the polymer at the atomic level.

Raman spectroscopy is extremely useful for characterizing crystalline materials.
Low frequency Raman scattering measurements can be used to predict physical properties of polymers and the crystalline polymorphic form of active pharmaceutical ingredients (APIs). These measurements are made by recording the Stokes and anti-Stokes side of the laser line with the laser centered on the detector. Spectra of polyethylene and linear alkanes were recorded down to 4 cm-1.

Spectroscopy
Raman imaging provides detailed crystal orientation information for two-dimensional MoS2 prepared by chemical vapor deposition on silicon substrates. These two-dimensional crystals consist of individual atomic layers of sulfur, molybdenum, and sulfur atoms.
Spectroscopy
Raman microscopy, combined with X-ray fluorescence, can provide detailed information about extractables and leachables from medically implantable devices.
Spectroscopy
Raman measurements can be used to infer the temperature of a material based on the Stokes and anti-Stokes band signal strengths, and by applying a predefined mathematical relationship. In reality, the temperature, Raman shift, and laser excitation wavelength all interact, and should be considered to better understand these measurements.
Spectroscopy
Raman 2D-COS spectral data provide information on conformational changes of polymers. Here, Raman spectra of ethylene vinyl acetate and vinyl acetate copolymer are measured and interpreted, enabling a description of morphological changes related to the vinyl acetate group.
Spectroscopy
When stress is applied to an object, it can produce strain. Strain can be detected through changes in peak position and bandwidth in Raman spectra. Here, we show examples of how strain in technologically important materials appears in the Raman spectra.
Spectroscopy
The spectral behavior of water is studied using Raman with an NIR spectrograph and dual wavelength lasers for measurements of both the fingerprint and the OH stretching regions. Raman spectra are recorded between 5 ⁰C and 80 ⁰C, and treated with both band-fitting and the 2D-COS algorithm revealing improved insights into the spectral behavior of water.
Spectroscopy
The differentiation of polymorphs is important, particularly in the pharmaceutical industry. We demonstrate the practicality of using Raman spectroscopy to differentiate crystal forms for polymorph characterization and screening, and explain aspects of chemical bonding and solid state structure that affect the Raman spectra of crystal lattice vibrational modes.
Spectroscopy
Two-dimensional correlation spectroscopy (2D-COS) can reveal subtle chemical interactions that are difficult to discern when analyzing individual spectra. A demonstration of the subtleties of this technique can be seen in the analysis of ethanol–water and ethanol–methanol mixtures.
Spectroscopy
Resonance Raman spectroscopy demonstrates up to 106 signal enhancement. In this overview a detailed description of how resonance Raman spectroscopy differs from normal Raman spectroscopy is given with some specific examples explained.