
In this column, we will introduce the spectra of tri-, tetra-, and penta-substituted benzene rings.
In this column, we will introduce the spectra of tri-, tetra-, and penta-substituted benzene rings.
This column considers the spectra of saturated rings, such as cyclopentane and cyclohexane, and how not all of them are easily detectable by infrared spectroscopy.
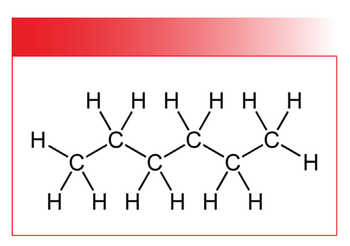
Brian Smith offers a review of the C-H stretching and bending vibrations of methyl and methylene groups and then discusses how to use infrared spectroscopy to determine some of the branch points found in alkanes.
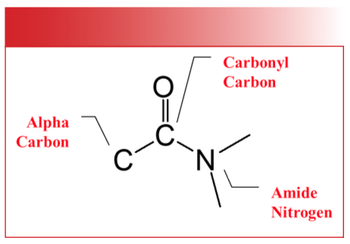
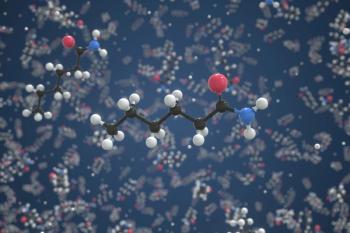
In our ongoing review of infrared spectra, we will study organic nitrogen containing compounds including amides and amines. Amides contain both nitrogen and a C=O group and are found in proteins and polymers. Amines contain carbon, nitrogen, and hydrogen, and are ubiquitous in medicines. As always, concepts will be illustrated with reference spectra.
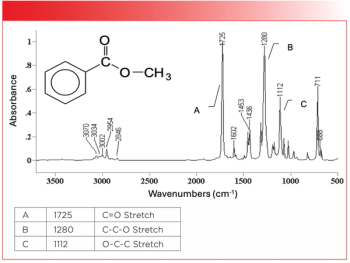
In this part of our ongoing review of the infrared spectra of carbonyl-containing functional groups, we will study the spectra of esters and carbonates. Esters are ubiquitous in our food and medicines, and polymeric carbonates form an important part of the materials around us. As always, concepts will be illustrated with reference spectra.

Carbonyl containing functional groups are strong infrared absorbers and a number of them are easy to identify by infrared spectroscopy. Here, we will review the spectra of ketone and carboxylic acids.

In the fifth installment of “The Big Review” of infrared (IR) spectral interpretation, we review the spectroscopy of functional groups containing C-O bonds, discuss alcohols and phenols, and see how to use IR spectroscopy to distinguish these alcohols from each other. We then discuss ethers and see how to use IR spectroscopy to distinguish the three different types from each other.

In the fourth installment of our review of infrared spectral interpretation, we will discuss the spectroscopy of hydrocarbons. We will look at the stretching and bending vibrations of methyl (CH3) and methylene (CH2) groups, how to distinguish them, and how to know whether one or both of these functional groups are present in a sample. We will also discuss aromatic hydrocarbons, specifically the C-H stretching and bending peaks of mono- and disubstituted benzene rings, and how to distinguish them.

It has occurred to me that, in the 10+ years I have been writing about molecular vibrations, I have never introduced my readers to its basic theory! I will rectify that now. Some of this is new material, and some will be review. Either way, it is important that all this material be covered in one place.

In the second installment of “The Big Review,” we discuss the physical mechanism behind how molecules absorb infrared (IR) radiation. Because light can be thought of as a wave or a particle, we have two equivalent pictures of IR absorbance. We also discuss the quantum mechanics behind IR absorbance, and how this leads to the different peak types observed in IR spectrum.

I have been writing this column for almost 10 years, and we have reached a watershed moment. We have covered what I call the beginning and intermediate topics. However, before we venture off into advanced topics, a review is in order. I will spend the next four columns summarizing what we have learned so far so that the advanced topics will make more sense.

We wrap up our discussion of the mid-infrared spectra of inorganic compounds by looking at the spectra of silicates, nitrates, and phosphates. We will see that silicates have complex surface chemistry, and that infrared spectroscopy can tell us something about this. We will note that, of the five families of inorganics examined, the wavenumber ranges for the polyatomic anion stretching peaks in several of these functional groups overlap. However, polyatomic anion bending vibration peaks can be used to distinguish the five types of inorganics studied.

This column discusses the spectra of different inorganic functional groups, such as sulfates, carbonates, nitrates, silicates, and phosphates, with special attention being paid to the stretching and bending vibrations of the polyatomic anions in these compounds.

The author dispels the notion that inorganics do not have mid-infrared spectra by providing an overview of the general characteristics of their infrared spectra.
An examination of halogenated compounds and some common halogenated polymers is explored here.

The structure and infrared spectra of polyurethanes and polymeric amides are similar, but there are several key differences worth calling attention to.

Slip agents are commonly used amide small molecules that lubricate the molds in injection molding processes. By studying the spectra of a primary amide, we can see how they can contaminate the spectra of polymeric materials.
We study the spectra of organic nitrogen polymers with a particular focus on polyamides.

We study the spectrum of polymethyl methacrylate (PMMA)—otherwise known as plexiglass—and the spectra of PMMA mixtures and copolymers.

We continue our survey of the spectra of carbonyl-containing polymers by looking at cellulose acetate and the economically important polycarbonate Lexan.

An exploration of polyethylene terephthalate (PET), one of the most important polymers, is presented.
We continue our survey of the infrared (IR) spectra of polymers with a look at the spectra of polymers that contain carbonyl or C=O bonds. Our long-term goal is to examine the spectra of polymers that contain ketone, carboxylic acid, ester, and carbonate linkages. Studying these spectra is vital, because these molecules are important economically and are ubiquitous in society.
An examination of polymers with C-O bonds, focusing on the spectra of polyvinyl alcohol, cellulose, starch, and copolymers.

Epoxies are perhaps the most economically important functional group of polymers. We explain how to interpret their spectra.

Many rubbery polymers contain C=C bonds, which means they are alkenes. Thus, we can identify natural and synthetic rubbers by examining the spectra of cis-, trans-, and tri-substituted alkenes.

Infrared (IR) spectroscopy can be used to distinguish the spectra of hydrocarbon polymers from one another.
Here, we finish a discussion of the spectrum of polyethylene (PE) and explore how different PE syntheses produce materials with different physical and spectroscopic properties.

Polymers contain practically every infrared functional group imaginable. Now that we understand infrared functional groups from previous articles, it is time to look at the spectra of polymers in greater detail.

Determining the components in a mixture can be a significant challenge in infrared spectroscopy, but spectral subtraction can help. We show the proper way to perform spectral subtraction, and the pitfalls to avoid.

One of the biggest practical limitations of infrared spectroscopy is its difficulty in analyzing mixtures. Infrared library searching can help, but it must be done right.