EDX and LIBS Studies on Gallstones Using Partial Least Squares Discriminant Analysis (PLS-DA)
Gallstone formation inside the gallbladder is a serious disease and causes health problems. To create preventative measures, it is crucial to examine the composition of gallstones and identify the minerals that are responsible for their pathogenesis. In the present work, we have employed laser-induced breakdown spectroscopy (LIBS)-based elemental studies in combination with partial least squares discriminative analyses (PLS-DA). Energy dispersive X-ray spectroscopy (EDX) was also applied to quantify the elements in the different parts (core and surface) of the gallstones. Fourier transform infrared (FT-IR) spectroscopy was used to classify the gallstone samples. Spectral studies using the LIBS and EDX techniques revealed the presence of trace and toxic elements in the center part of gallstones in higher amounts than that from surface parts. The EDX study also revealed that the elemental distribution is quite heterogenous, and their distribution is random. The EDX method revealed that the center (core) part of the stone samples contained the presence of numerous heavy and toxic elements such as arsenic (As), cadmium (Cd), mercury (Hg), lead (Pb), and nickel (Ni).
Gallstone disease is a severe health problem that affects millions of people globally. Gallstone production takes years in vivo, and it is difficult to investigate such processes from nucleation to consolidation (1,2). The mechanical irritation of the stones on the gallbladder tissues makes it one of the most painful disorders. Surprisingly, gallstone disease has become more common in children and adults over the last few decades. Adults are the subject of the great majority of reports (2). Gallstone disease is now treated solely by surgically removing the gallbladder. As a result, the disease has a significant impact on children. The primary job of the gallbladder is to concentrate bile by absorbing water and salt. It increases the concentration of impermeable solutes in hepatic bile by a factor of two.
The pathophysiology of gallstones is still unknown. Changes in hepatic bile composition, biliary glycoprotein, infection, age, genetics, sex, oestrogens, dietary variables, geographical distribution, and liver cirrhosis are all factors that may contribute to the formation of gallstones (2–5). Gallstones have a complex chemical composition. As a result, determining the major and trace elements present in the gallstones is critical. On the other hand, toxic elements are known to be exceedingly dangerous even at very low concentrations. Therefore, reliable elemental studies are needed to aid in the clarification and identification of effective treatment and management.
Gallstones of different compositions have a variety of color appearances. Gallstones are mostly comprised of organic components like cholesterol, bilirubin, bile acid, and fatty acid. According to their composition, there are three basic types of gallstones seen in patients: cholesterol type (cholesterol-rich); pigment type (bilirubin and calcium bilirubinate rich); and mixed type, which is the combination of cholesterol and bilirubin (6).
Many studies showed the presence of toxic elements, such as chromium, lead, nickel, cadmium, and arsenic in some of these stones, possibly as a result of people’s exposure to pollution, industrial waste, and smoking. Some research showed that toxic metals, such as chromium, lead, and cadmium, found in drinking water accumulate in the biliary system, eventually leading to gallbladder stones. The growth in heavy metal toxicity has been linked to the gallbladder and other organ cancers (7). In some studies of gallstones, the authors used some techniques like X-ray fluorescence (XRF) and neutron activation analysis to show that the elements like calcium (Ca), sodium (Na), chlorine (Cl), potassium (K), magnesium (Mg), manganese (Mn), iron (Fe), phosphorus (P), copper (Cu), lead (Pb), titanium (Ti), zinc (Zn), aluminum (Al), nickel (Ni), and chro- mium (Cr) are the main constituents of gallstones (8).
Over the last few decades, a lot of research has been done to see how the accumulation and lack of particular elements in the human viscera cause disease. Many researchers are currently focused more on the elemental analysis of gallstones to detect the constituents and the presence of trace and toxic metal elements to understand their pathogenesis (9–11). For determining major and trace elements in gallstones, several analytical methods have been used, including atomic absorption spectrometry (AAS), particle-induced X-ray emission (PIXE), energy dispersive X-ray spectroscopy (EDX), wavelength dispersive X-ray fluorescence (WDXRF), inductively coupled plasma–optical emission spectrometry (ICP-OES), and laser-induced breakdown spectroscopy (LIBS).
LIBS is a well-known spectrochemical technique based on spectral analysis of radiation released by a micro-plasma created on the target surface by a laser pulse. The relative simplicity of the LIBS principle makes it incredibly appealing for a wide range of applications (1,12). The first analytical application of laser-plasma on surfaces, and therefore the origin of LIBS, occurred in 1962–1963. LIBS has been used in a wide range of applications and has a number of advantages over other well-known spectrochemical techniques. There is minimal or no sample preparation is required in LIBS.
Gazili and others (13) performed LIBS and photoacoustic spectroscopy (PAS) for the compositional analysis of gallstones. They classified the gallstones used in their study based on the organic and inorganic components presents in the samples and discriminate the gallstone samples using principal component analysis (PCA). For the first time, Singh and others (14) performed the variational analysis of gallstone samples using LIBS. They analyzed the variation in elemental composition from the center to the surface of the gallstones.
In numerous applications, including forensic evidence analysis and biomaterial identification, statistical approaches have been applied to analyze spectroscopic data. In some research publications, LIBS and chemometric approaches were used to test the feasibility of some biomaterial identification. Improved use of statistical approaches like PLS-DA is likely to play a big role in LIBS-based biological sample discrimination. PLS-DA is a type of multivariate analysis that identifies and maps interrelationships between data sets.
In the present work, we used LIBS to perform a comprehensive screening of the major and trace elements contained in the gallstone samples. The relative profiling of the com- ponents qualitatively present in the gallstone samples was done using the intensity ratio approach. For a better understanding of the characteristic variation of gallstone samples, the chemometric multivariate approach PLS-DA was applied to the LIBS data.
Materials and Methods
Collection of Gallstone Samples
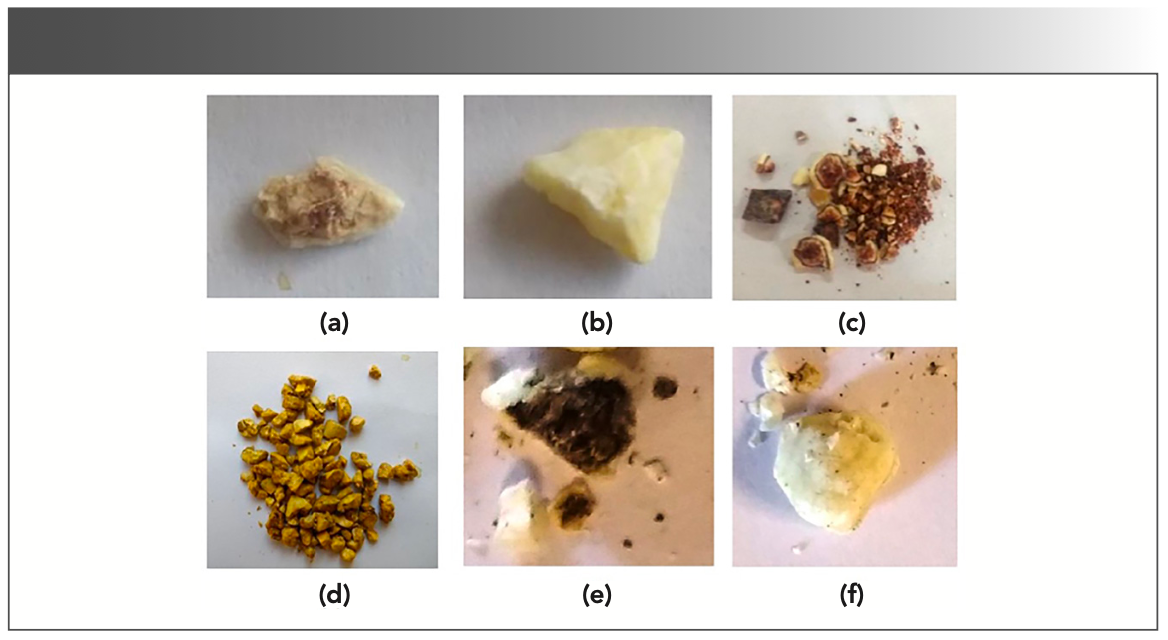
The gallstone samples were provided by the Department of Nephrology, Opal Hospital, in Varanasi, India, after surgical treatment of the patients. In the present study, five gallstones were used for the investigations. The stones were first washed thoroughly with doubly distilled water to get rid of blood or any other possible impurities and then dried at room temperature. The stones were observed microscopically and found of different colors (as can be seen from Figure 1a–f). During the visual examination, the surface and center portion of gallstones were also found to have a different appearance in color (Figure 1). The center parts were observed to be dark brown or black in coloration, whereas the colors of the surface parts varied, ranging from white to off white to yellow. This shows the different portions of major and minor chemical compositions. The center parts and surface parts of the stones were carefully removed. For convenience, the samples were coded G1, G2, G3, G4, G5, and G6. G5 and G6 represent the center and surface parts of a gallstone. The dried stone samples were crushed into fine powder using mortar and pestle and then analyzed using LIBS, EDX, and FT-IR spectroscopy.

 used in the present study.")
FIGURE 1: Photographs of gallstone samples (G1–G6) used in the present study.
LIBS and EDX
A LIBS experimental setup RT100-EC instrument (Applied Spectra, Inc.) was used to record the LIBS spectra of the various gallstone samples. A laser source, sample stage, spectrometer with detector system, and plasma collection optics were the main components of the arrangement. The stone sample was put on a translational stage, and the plasma was created by focusing a Q-switched Nd:YAG laser operating at 1064 nm wavelength on the sample using a 15-cm focal length lens. The laser pulse energy, pulse repetition rate, and pulse duration were tuned at 17 mJ/pulse, 5 Hz, and 10 ns respectively to produce the best signal-to-background and signal-to-noise ratios. A five-channel charge-coupled device (CCD) spectrometer having approximately a 0.1 nm spectral resolution with 187–887 nm coverage was used to record the data. The size of the laser spot on the surface of the sample was 100 μm in diameter, which was measured by the LIBS instrument T100-EC from Applied Spectra, Inc. For each sample, 20 line scans were taken, and these 20 scans were then averaged to predict our LIBS results and to avoid the fluctuations because of shot-to-shot variation.
The chemical compositions of gallstones were recorded using a Hitachi SU 8010 cold field emission scanning electron microscope (SEM). EDX attachment provided the elemental composition of trace and toxic elements present in the different parts of the gallstone samples.
Results and Discussion
FT-IR Characterization of Gallstones
FT-IR spectroscopy has been used to characterize the gallstone samples. The surface parts of the stones were found rich in cholesterol, and the center parts were found rich in bilirubin using FT-IR spectroscopy. The contents of cholesterol and bilirubin were observed in varying amount in gallstones of different colors, and thus, the stones were categorized as mixed type gallstones.
Relative Concentrations of Elements in Gallstones (G1–G6) Using LIBS
LIBS spectra of gallstone samples (G1–G6) were recorded at optimized experimental conditions in the spectral region 187–887 nm. The spectra were recorded using twenty laser line scans. Identification of the atomic and ionic lines present in the LIBS spectra of gallstone samples were carried out by NIST database (15) and “Identification of Molecular Spectra” by Pearse and Gaydon (16). The detected elements were Al, Mg, Fe, silicon (Si), Mn, Ca, K, P, Na, Cu, Ti, strontium (Sr), and Zn.
The intensities of the spectral lines of the elements detected in the gallstone samples were significantly different in different gallstones. The intensity of the atomic emission lines of LIBS spectra was directly proportional to the concentrations of the elements present in the samples and therefore reflect the concentrations of the elements present in the gallstones (17). The relative LIBS concentration ratios were measured and indicated by the bar graph shown in Figures 2a–b. Because Ca is the major element detected in all the gallstones, the Ca line at 396.8 nm has been taken as the internal reference line for comparing the intensities of spectral lines of minor constituent elements in the stones (as can be seen from Figures 2a–b). We have chosen the resonance line of ionic Ca at 396.8 nm for taking the intensity ratio because it is free from the self-absorption effect. It can be seen that the concentrations of elements Fe, Ti, Mn, Al, Na, K, Mg, and Si are different in different stone samples. Figure 4 clearly shows that the concentration variations of these elements.

 Fe, Ti, Mn, Al; and (B) Na, K, Mg, and Si in gallstones (G1–G6).")
FIGURE 2: Relative LIBS concentration of (A) Fe, Ti, Mn, Al; and (B) Na, K, Mg, and Si in gallstones (G1–G6).
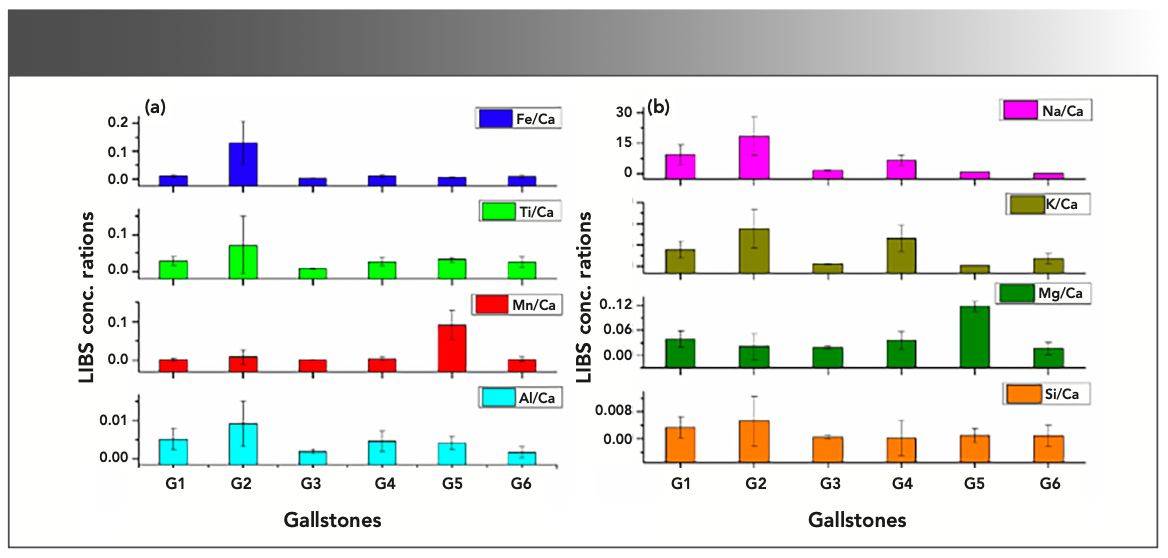


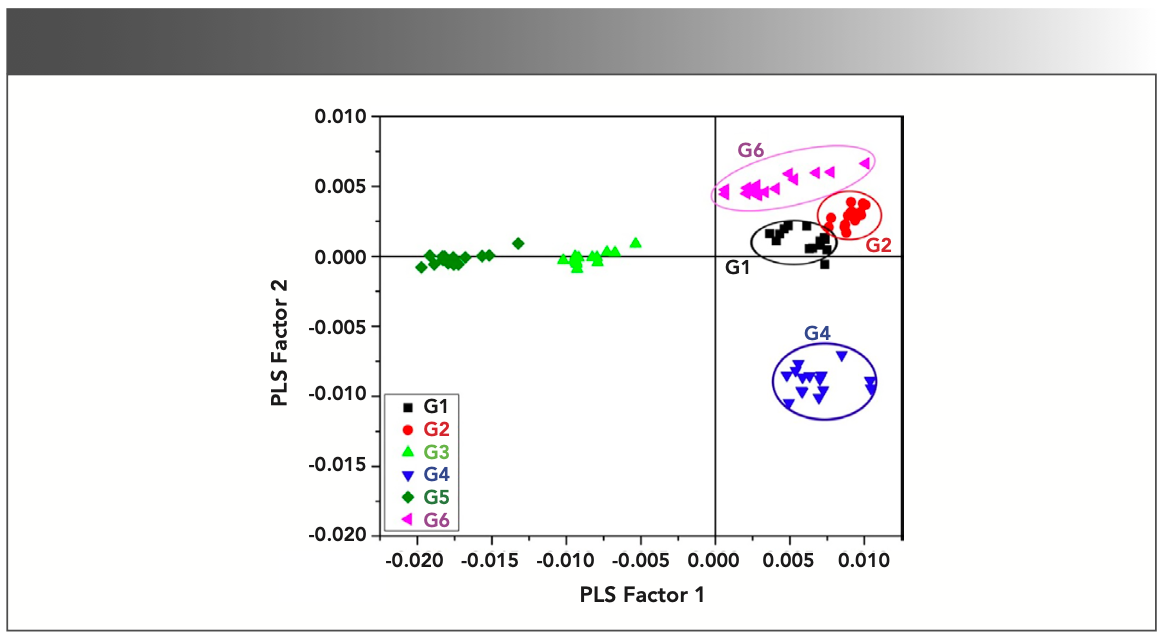
FIGURE 4: Score plot of PLS factor 1 compared to PLS factor 2.
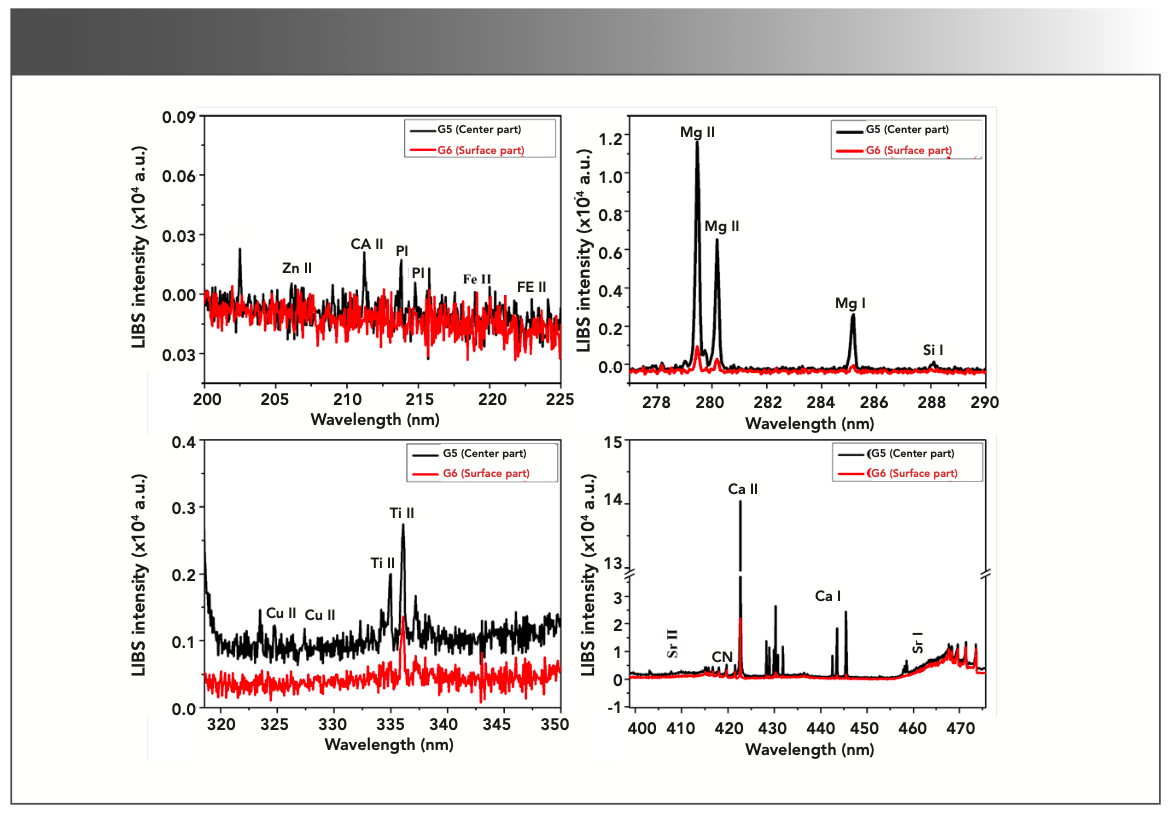
Gallstones can easily be identified by the presence of molecular Swan bands of C2 [d3Πg→a3Πu] present in their LIBS spectra. LIBS spectra of gallstones (Figure 3) show the presence of C2 Swan bands at 468.4, 469.7, and 471.5 nm. The occurrence of C2 swan bands is directly related to sputtering from the cholesterol and possible hydrocarbons present in the gallstones (18).

 and surface (G6-red spectra) parts of gallstone in different spectral range.")
FIGURE 3: Typical LIBS spectra of center (G5-black spectra) and surface (G6-red spectra) parts of gallstone in different spectral range.
LIBS Analysis of Center Part (G5) and Surface Part (G6) of Gallstone Sample
We have analyzed the center part (G5) and surface part (G6) of a gallstone sample using LIBS. The typical LIBS spectra of center and surface parts are shown in Figure 3 in the wavelength region 200–225 nm, 278–286 nm, 320–345 nm, and 400–475 nm. It can be seen from Figure 3 that the concentrations of the mineral elements Ca, Zn, P, Fe, Mg, Si, Cu, and Ti were found higher in center part than that of the surface parts. To reduce the shot-to-shot fluctuations, each LIBS spectrum was obtained as the average of 50 laser shots and to ensure the reliability of the LIBS data.
The FT-IR results showed the presence of bilirubin in center parts of the stones than that of the surface parts, whereas the LIBS study revealed the presence of higher level of Cu in center part than that of the surface parts. This clearly shows that Cu in the form of copper bilirubinate plays an important role in the formation of the pigmented parts of the black and brown color (Figure 1, gallstone G5) inside the core region of gallstones. Our finds are well supported by the studies performed on gallstones using the technique UV-visible (UV-vis) and time-of-flight secondary ion mass spectrometry (ToF-SIMS) (19).
Partial Least-Square Discriminative Analysis (PLS-DA) Modeling of LIBS to Distinguish Gallstones
According to our FT-IR study, we have observed that the amount of cholesterol and bilirubin is different in different gallstone samples and hence, their color is different. Our LIBS studies on gallstones revealed that the concentrations of elements are also different in these different gallstones. Also, in the center part, the elements were observed in higher concentration than that of surface parts. Therefore, the nature of gallstones was found to be heterogeneous. Using PLS-DA modeling of LIBS data, we attempted to classify them based on their elemental composition so that we could distinguish the gallstone based on their elemental composition.
We have performed PLS-DA statistical analysis on LIBS spectral data to model all the outcome variables simultaneously for gathering and interpreting the PLS factors. These PLS factors could be further used to obtain the relevant information about the varying characteristics of different sample groups because of their slightly different chemical compositions. The whole data has been represented by a data matrix Xm×n which includes wavelengths as variables for the total “n” number of LIBS spectra. It has been modeled for m = 10239 wavelengths ranging from 200–900 nm for n = 120 LIBS spectra corresponding to each sample groups G1, G2, G3, G4, G5, and G6. The class matrix, or category vector Yi×j, comprised of different categories (G1, G2, G3, G4, G5, and G6) where i = 6 stands for the number of sample groups and j = 120 denoted the total number of spectral data values taken for each sample groups. The two data matrix Xm×n and Yi×j are modeled to get the new variables known as latent variables or PLS factors and are relevant to depict the maximum covariance of X and Y. These newly developed latent variables are found to be linear combination of old variables and are best suited to explain the maximum information of X and Y.
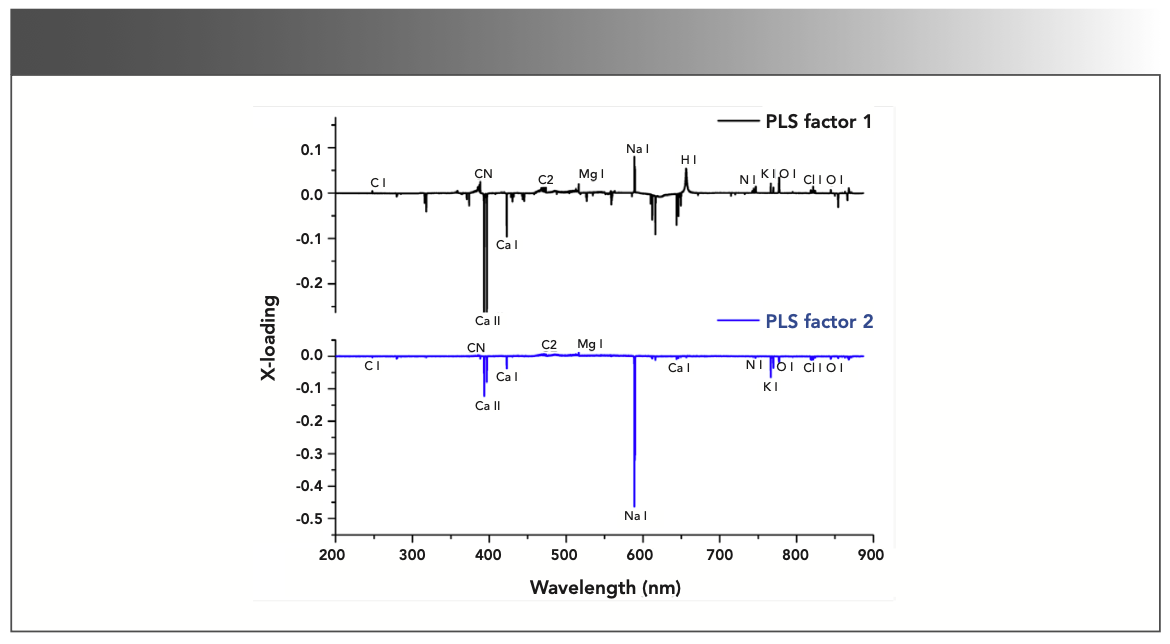
The interpretation of PLS-DA model gives two main outputs in the form of score and loading plots. Score plot reflects the clustering of sample groups in different quadrants whereas loading plot specifies the weight age of each variable on the basis of which sample groups cluster themselves in different quadrants of score plot of PLS-DA model. Each and every point or dot appeared in the clustering of sample groups in the score plot represents the variables of X data matrix that are best suited for the classification of the Y matrix. The points or dots which are positioned closed to the sample groups are said to be positively correlated with that much sample group and the points, which positioned themselves near the origin line do not reflect any knowledge about the samples groups and cannot be used for the analysis purpose.
The prepared PLS-DA model can be analyzed by looking upon both score and loading plot simultaneously in which one depicts the grouping of sample groups in the form of variables in different quadrants of score plot and other defined the weightage of each variable in the grouping of different samples groups in score plot. Figure 4 shows the score plot of PLS factors 1 and 2 which can clearly presents the distinction view of the gallstones (G1–G6) based on their relative elemental contents and grouped with the similar ones. By looking into score and loading plots of PLS factors 1 and 2 (Figures 4–5), it has been seen that emission intensities of elements such as K and Na are responsible for the clustered G4 sample group in the last quadrant of score plot (Figure 4). Therefore, the sample group G4 includes the increasing contents of elements K and Na and decreasing contents of other elements.


FIGURE 5: Loading plot of PLS factor 1 compared to PLS factor 2.
By looking into both score and loading plots of PLS factor 1 compared to PLS factor 3 (Figure not shown in this article), we concluded about the G1 sample group as it is clustered itself in the first quadrant of the same score plot where both PLS factor 1 and PLS factor 3 are observed positive ones. From the loading plots of the same PLS factor 1 and PLS factor 3 (Figure not shown here), it has been noticed that O and N are the only variables that satisfy the criteria of having both PLS factor 1 and PLS factor 3 as positive ones. This observation indicates that the increasing trends of emission intensities of variables O and N and decreasing contents of other elements are responsible for clustering the G1 sample group in the first quadrant of score plot of PLS-DA. On switching to the G3 sample group in the score plot of PLS factor 1 compared to PLS factor 3, we saw that the G3 sample group clustered itself in the second quadrant where PLS factor 1 is negative and PLS factor 3 is positive. From the loading plot of PLS factor 1 compared to PLS factor 3 (Figure not shown here), it was found that the wavelength of elements such as Ca, Al, Sr, and Mn are having PLS factor 1 as negative and PLS factor 3 as positive. This implies that the increasing content of elements, such as Ca, Al, Sr, and Mn, are responsible to cluster the G3 group in second quadrant of the score plot of PLS factor 1 and PLS factor 3. The same sample group G3 is also clustered in the last quadrant of the score plot of PLS factor 3 and PLS factor 4, where PLS factor 3 is positive and PLS factor 4 is negative. From loading plots of PLS factor 3 and PLS factor 4 (Figure not shown here), it has been found that the emission intensities of elements, such as Ca, Mn, Cn, H, Sr, and Al, are responsible for clustering the G3 sample group. Therefore, the content of elements, such as Ca, Mn, Sr, Al, copernicium (Cn), and hydrogen (H), were found to be more in the G3 sample group than other sample groups. The sample group G2 is found to be clustered in the last quadrant of the score plot of PLS factor 2 and PLS factor 3 (Figure not shown here), where PLS factor 2 is positive and PLS factor 3 is negative. From the loading plot of the same PLS factor 2 and PLS factor 3 (Figure not shown here), it was found that only the wavelengths of elements, such as the C2 band, satisfied the similar criteria, and their increasing trends in G2 make it clustered in the last quadrant of PLS factor 2 and PLS factor 3. In a similar way, the behavior of the center and surface parts of sample groups G5 and G6 have also been predicted by ana- lyzing the score and loading plots of PLS factor 1 and PLS factor 4 (Figures not shown here).
The behavior of sample groups can also be interpreted by looking over the spotted areas of points along their aligning directions. If we assume gridlines x = 0 and y = 0 as imaginary lines, then the alignment of the sample groups in different quadrants will give us idea about how close the behavior of sample groups are on the basis of their similar characteristics. The same alignment of the two sample groups has been seen in score plot of PLS factor 1 and PLS factor 3, in which the G3 sample group is clustered in the second quadrant and sample group G2 is clustered in the last quadrant. This alignment of sample groups indicates the idea about their inverse behavior (that is, the variables that are found to be more in the G3 group, such as CN, Mn, Ca, Mg, H, Sr, and Al, are found to be least in the G2 sample group).
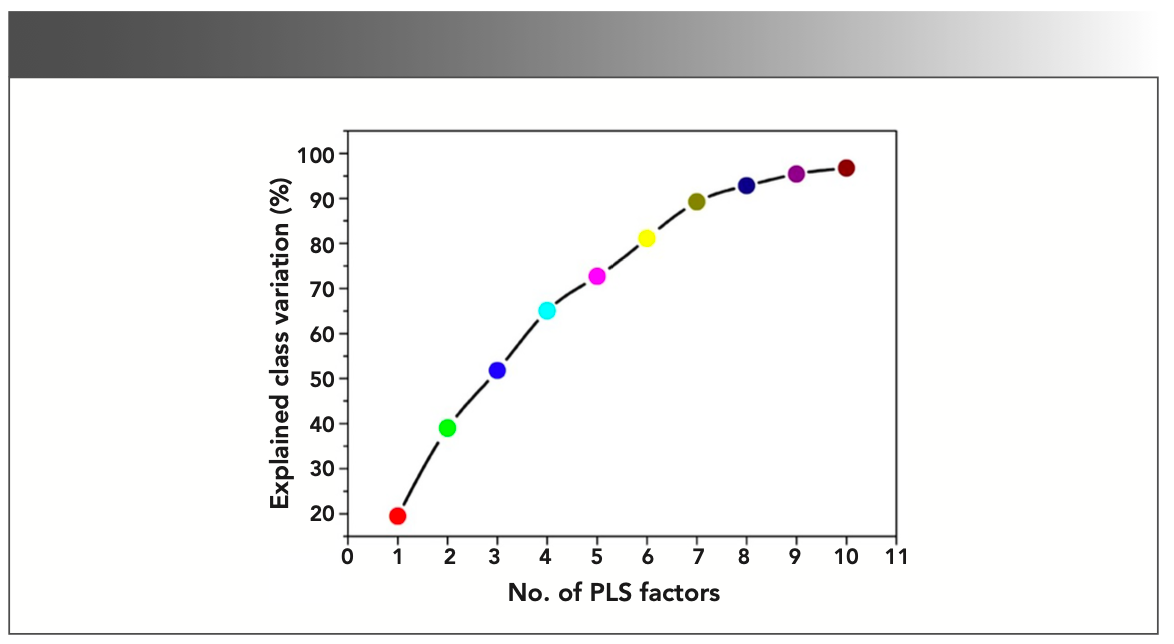
The validity of the prepared PLS-DA model has been examined by the classification accuracy of the model. The whole LIBS spectra have been divided into two groups in which one is for training the model and other is for testing the model. This model has been calibrated by considering 20 × 6 = 120 spectral values and tested by randomly choosing 5 × 6 = 30 data values. The leave-one-out (LOO) method was adopted for the cross-validation of the prepared PLS-DA model. The prediction accuracy has been plotted as a function of number of PLS factors included in the model and shown in Figure 6. It has been noticed that PLS factors 1–10 are sufficient to discriminate all the six sample groups (G1–G6) with the explained variance of approximately 96% shown in Figure 7. Therefore, we can conclude that based on the PLS-DA modeling of LIBS data, the different colors of gallstones samples were successfully discriminated based on their relative elemental contents, which are responsible for stone formation and color appearance. This kind of discrimination is not possible by other elemental analysis techniques, which proves the utility of chemometrics coupled with LIBS techniques.


FIGURE 6: Predicted accuracy in the validation process as a function of number of PLS factors.
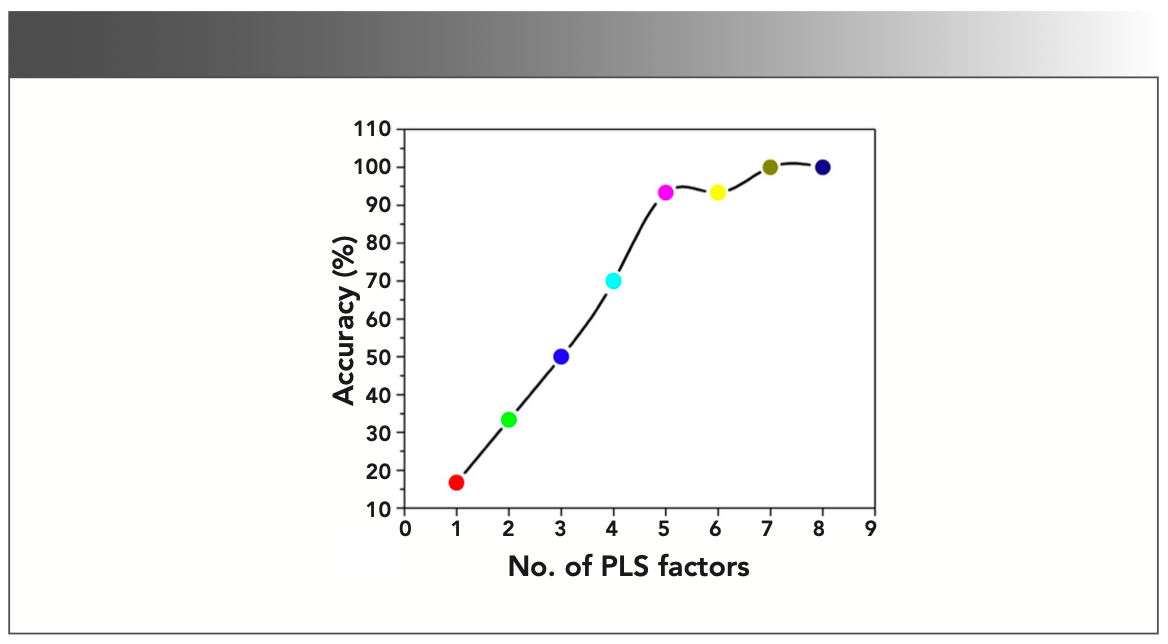


FIGURE 7: Explained class variance with the adoption of number of PLS factors.
EDX Analysis of Centre and Surface Parts of Gallstones
To verify our FT-IR and LIBS experimental data and also to quantify more numbers of heavy and toxic elements in gallstones, different parts (center as well as surface) were analyzed using the EDX technique. Different scans (scan 1 and scan 2) at two locations at the center and surface parts were carried out using EDX. The concentration (wt.%) of the heavy and toxic elements observed in center and surface parts are tabulated in Table I. The heavy and toxic elements detected were As, Cd, Pb, Hg, Sr, Ni, Cu, and Zn. From Table I, it can be seen that the concentrations of the elements at different locations (center as well as surface parts) were quite different, which indicates the heterogeneous distributions of the elements throughout the gallstones. For example, Sr has been observed in center region, which is absent at the surface parts during scan 2. Mercury (Hg) and nickel (Ni) were only observed in center region and absent at surface region. Overall, it has been found that the concentrations of the elements are higher in center part than that of surface parts, which is in good agreement with the LIBS elemental concentration of Ca, Mn, P, Cu, Zn, and Fe. Our findings are in good agreement with the results reported on gallstones using other techniques such as WDXRF and ToF-SIMS (10,19,21).

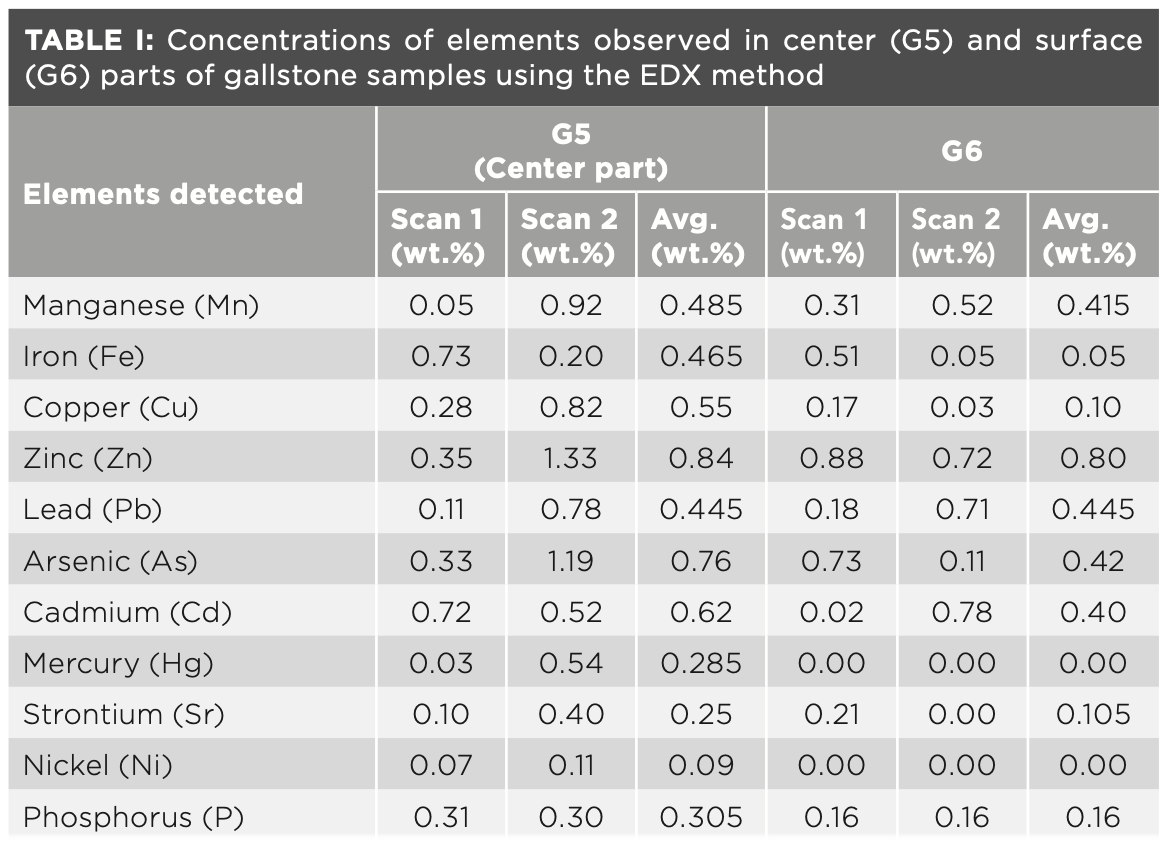

The main organic elemental composition of gallstones as observed by EDX was carbon (C), oxygen (O), and nitrogen (N), which shows the presence of cholesterol and bilirubin in gallstones and which have been detected using FT-IR spectroscopy. Hydrogen is not detected by EDX because hydrogen has no core electrons (20). The EDS analysis revealed that the gallstones contained 91.10% C (wt.%) and 4.49% O (wt.%). Nitrogen was present in the core region of gallstones and was absent from the surface parts. The presence of N indicates the presence of bilirubin in the core region and responsible for the black/brown color of core region. The ratio of carbon to oxygen (C:O) was 20:28, which coincides with pure cholesterol (C27H46O) composition after omitting the hydrogen (that is, C (83.1%)/O (4.14%) = 20.07.
Conclusion
The characterization of gallbladder stones using the fast and reliable techniques EDX and LIBS are advantageous compared to the traditional chemical analytical methods. The presence of cholesterol was confirmed using FT-IR spectroscopy as the major chemical constituent in gallstone. In addition, bilirubin, calcium carbonate, and calcium phosphate were also noticed in gallstones. Elemental analyses of gallstones were carried out using LIBS. The chemometric method PLS-DA coupled with LIBS data were successfully used to discriminate the gallstones under present study. EDX was used to analyze the heterogeneous distribution of heavy and toxic elements throughout the gallstones and data were well correlated with the LIBS data. High contents of heavy and toxic elements in the core region suggested the nucleation and growth of gallbladder stones. In conclusion, it is recommended that foods having high amount of cholesterol, low-fiber diets, and contaminated water intake having heavy and toxic elements should be avoided to minimize, which prevents the formation of gallstones.
Acknowledgments
Author V.K. Singh is much thankful to UGC-DAE CSR Kolkata Centre for partial financial support. Authors V. Bali, Y. Khajuria, N. Sharma, and V. K. Singh are also grateful to SMVD University, India, for providing the necessary facility and support.
References
(1) Singh, V.K.; Singh, V.; Rai, A.K. et al. Quantitative Analysis Of Gallstones Using Laser-Induced Breakdown Spectroscopy. Appl. Opt. 2008, 47 (31), G38–G47 (2008). DOI: 10.1364/AO.47.000G38.
(2) Cox, M.R.; Eslick, G.D.; Padbury, R (eds.). The Management of Gallstone Disease: A Practical and Evidence-Based Approach; Springer International Publishing, Cham, 2018.
(3) Swobodnik, W.; Soloway, R.D.; Ditschuneit, H; (eds.).; Springer-Verlag, Berlin Heidelberg. 1990. DOI: 10.1007/978-3-642-74619-2.
(4) Afdhal, N. H. Diseases Of The Gallbladder And Bile Ducts.; Goldman, L.; Ausiello, D (eds.). Cecil Textbook of Medicine, Saunders Elsevier, Philadelphia, 2004; pp. 949–946.
(5) Di-Ciaula, A. Wang, D. Q. H.; Portincasa, P. An Update on the Pathogenesis of Cholesterol Gallstone Disease. Curr. Opin. Gastroenterol. 2018, 34 (2), 71–80. DOI: 10.1097/MOG.0000000000000423.
(6) Ravnborg, L.; Teilum, D.; and Pedersen, L. R. Gallbladder Stones Classified By Chemical Analysis Of Cholesterol Content. Scand. J. Gast. 1990, 25, 720–724. DOI: 10.3109/00365529008997598.
(7) Shukla, V.K.; Prakash, A.; Tripathi, B.D.; Reddy, D.C.S.; and Singh, S. Biliary Heavy Metal Concentrations in Carcinoma Of The Gall Bladder: Case-Control Study. BMJ. 1998, 317, 1288–1289. DOI: 10.1136/bmj.317.7168.1288.
(8) Basu, S.; Singh, M.K.; Singh, T.B. et al. Heavy and Trace Metals in Carcinoma of The Gallbladder. World J. Surg. 2013, 37, 2641–2646. DOI: 10.1007/s00268-013-2164-9.
(9) Al-Kinani, A.T.; Harris, I.A.; Watt, D.E. Analysis of Minor and Trace Elements In Gallstones By Induction of Characteristic Ionizing Radiation. Phys. Med. Biol. 1984, 29 (2), 175–184. DOI: 10.1088/0031-9155/29/2/012.
(10) Jaswal, B.B.S.; Rai, P.K.; Singh, T; Zorba, V; and Singh, V.K. Detection and Quantification of Heavy Metal Elements in Gallstones Using X-Ray Fluorescence Spectrometry. X-Ray Spectrom. 2019, 48 (3), 178–187. DOI: 10.1002/xrs.3010.
(11) Gondal, M.A.; Shemis, M.A.; Gondal, B.; Khalil, A.A.I. Gallbladder Stones Analysis Using Pulsed UV Laser-Induced Breakdown Spectroscopy. J. Med. Bioeng. 2016, 5 (2), 85–88. DOI: 10.18178/jomb.5.2.85-88.
(12) Singh, V. K.; Rai, N. K.; Pandhija, S.; Rai, A. K.; Rai,P. K. Investigation Of Common Indian Edible Salts Suitable For Kidney Disease By Laser Induced Breakdown Spectroscopy. Laser. Med. Sci. 2009, 24, 917–924. https://doi.org/10.1007/s10103-009-0659-2.
(13) Gazali, Z.; Kumar, R.; Rai, P.K. et al. Discrimination of Gallbladder Stone Employing Laser-Induced Breakdown Spectroscopy (LIBS) And Photoacoustic Spectroscopy (PAS). Spectrochim. Acta A: Mol. Biomol. Spectrosc. 2021, 260, 119948. DOI: 10.1016/j.saa.2021.119948.
(14) Singh, V.K.; Rai, V.; Rai, A.K. Variational Study of Constituents Of Cholesterol Stones Using Laser-Induced Breakdown Spectroscopy. Laser Med. Sci. 2009, 24, 27–33. DOI: 10.1007/s10103-007-0516-0.
(15) NIST: National Institute of Standards and Technology USA, electronic database. http://physics.nist.gov/PhysRefData/ASD/lines form.html.
(16) Pearse, R.W.B.; Gydon, A.G. The Identification of Molecular Spectra, First Eds., American Chemical Society,1951.
(17) Miziolek, A.W.; Andrzej, W.; Palleschi, V.; Schechter, I. (eds.). Laser-Induced Breakdown Spectroscopy (LIBS): Fundamentals and Applications. Cambridge University Press, 2006. DOI:10.1017/CBO9780511541261
(18) Pathak, A. K.; Singh, V. K.; Rai, N. K. et al. Study of Different Concentric Rings inside Gallstones with LIBS. Lasers Med. Sci. 2011, 26 (4), 531–537. DOI: 10.1007/s10103-011-0886-1.
(19) Jaswal, B. B. S.; Singh, V.K. Analytical Assessments Of Gallstones And Urinary Stones: A Comprehensive Review of The Development From Laser to LIBS. Appl. Spectrosc. Rev. 2015, 50 (6), 473–498. DOI: 10.1080/05704928.2015.1010206.
(20) Vyas, P. M.; Joshi, M. Surface Micro Topographical and Dielectric Studies of Cholesterol Crystals. Adv. Mat. Res. 2013, 665, 289–296. DOI: 10.4028/www.scientific.net/AMR.665.289.
(21) Jaswal, B. B. S.; Kumar, V.; Swart, H.C. Elemental and Molecular Analysis of Gallstones Using Wave-Dispersive X-Ray Fluorescence and Fourier Transform Infra-Red Spectroscopy. Appl. Phy. B. 2015, 121, 49–56. DOI: 10.1007/s00340-015-6200-3.
Varun Bali, Yugal Khajuria, Neha Sharma, and Vivek K. Singh are with Shri Mata Vaishno Devi University, in the Jammu and Kashmir region of India. Sandeep Kumar and Yonghoon Lee are with Mokpo National University, in Muan-gun, South Korea. Pradeep K. Rai is with Opal Hospital in Uttar Pradesh, India. Singh is also with University of Lucknow, in Uttar Pradesh, India. Sharma is also with Cluster University of Jammu, in the Jammu and Kashmir region of India. Direct correspondence to: vivekksingh2005@gmail.com ●


Newsletter
Get essential updates on the latest spectroscopy technologies, regulatory standards, and best practices—subscribe today to Spectroscopy.


Laser Ablation Molecular Isotopic Spectrometry: A New Dimension of LIBS
July 5th 2012Part of a new podcast series presented in collaboration with the Federation of Analytical Chemistry and Spectroscopy Societies (FACSS), in connection with SciX 2012 — the Great Scientific Exchange, the North American conference (39th Annual) of FACSS.

Rapid Analysis of Logging Wellhead Gases Based on Fourier Transform Infrared Spectroscopy
Fourier transform infrared (FT-IR) spectroscopy was used in this paper to rapidly analyze seven light alkanes (methane, ethane, propane, n-butane, i-butane, n-pentane, and i-pentane) in wellhead gases.


Bruce R. Kowalski: The Maverick Mind Behind Chemometrics
June 2nd 2025In this Icons of Spectroscopy article, Executive Editor Jerome Workman Jr. delves into the life and impact of Bruce Kowalski, an analytical chemist whose major contributions to chemometrics helped establish the field of applying advanced quantitative and qualitative mathematics to extract meaningful chemical information from complex datasets. Kowalski’s visionary approach to chemical data analysis, education, and software development has transformed the landscape of modern analytical chemistry for academia and industry.

