Identification and Classification of Degradation-Indicator Grass Species in a Desertified Steppe Based on HSI-UAV
The emergence and number of grassland degradation-indicator grass species are important in evaluating the extent of grassland degradation. Plant populations in desertified steppe are distributed randomly and at low density. Specifically, degradation-indicator grass species mainly exist as individuals, making spectrum-based identification difficult. Here, a low-altitude unmanned aerial vehicle (UAV) hyperspectral remote-sensing system was constructed to identify the typical degradation-indicator grass species of a desertified steppe in China. The ASI index (Artemisia frigida Willd. and Stipa breviflora Grisb. index) and classification rules were proposed and applied. We implemented a comprehensive application of amplified differences in spectral characteristics between vegetation communities and assigned plant senescence reflectance-index bands, using the characteristics of the plant populations under observation and UAV hyperspectral remote-sensing data, to solve the problems resulting from high similarity while identifying ground objects. Our results lay a solid foundation for monitoring and evaluating desertified steppe degradation-indicator grass species based on remote sensing.
Grasslands play a critical role in global ecosystem services such as wind-breaking, sand-fixing, and water conservation (1). However, these fragile ecosystems have been undergoing increasing desertification in recent years, as they are severely affected by climate change and long-term irrational land use. In China, 80% of desertification occurs in pasture areas, the greatest extent of which are in Inner Mongolia, most prominently in the autonomous region (2).
Located along the northern frontier, the Inner Mongolia region is mainly affected by wind erosion-induced desertification, which primarily produces mildly desertified grassland. Desertification is manifested in the degradation of vegetation communities, reduction of biodiversity, invasion by degraded grass species, land desertification, and soil salinization; all these factors result in changes in vegetation community structure and reverse the succession of grassland ecosystems, which eventually become deserts (3).
One of the characteristics of grassland degradation is invasion by degradation-indicator grass species, which changes the original vegetation community structure. Therefore, monitoring and evaluating the occurrence and increase in the number of grassland degradation-indicator grass species is the primary method of studying grassland degradation. Traditional grassland monitoring is mainly based on sampling to study grassland vegetation coverage (4), above-ground biomass (5,6), leaf area index, and soil quality and bulk density (7). However, the data are scattered and difficult to organize, and large-scale acquisition and accuracy cannot be effectively guaranteed (8,9), as they are prone to subjective human bias. Nonetheless, recent developments in aerospace technology and the improvement of sensor accuracy based on satellite remote sensing have greatly facilitated research on land cover, aquatic plant biological monitoring, and tree diversity division, such that the limitations of spatial scale have been effectively overcome (10–12). Despite hardware and sensor accuracy limitations, satellite remote sensing is widely used in identifying large-scale vegetation communities, although it is impossible to achieve fine-scale division between plant populations of different species (13,14). However, manual field investigation and satellite remote sensing monitoring cannot accomplish quantitative and rapid research on the changes in the population structure of grassland vegetation. Therefore, a fast and high-resolution method to conduct dynamic monitoring of grassland degradation-indicator grass species is urgently needed. Unmanned aerial vehicle (UAV) hyperspectral remote sensing has the advantages of real-time efficiency and high resolution, which are highly convenient for data collection in desertified steppes and can be applied to the detection and research of small objects (15).
Hyperspectral remote sensing based on UAV enables crop leaf area index (LAI) inversion modeling, large area pest-monitoring, single tree detection, and tree species classification. Therefore, hyperspectral remote sensing has facilitated substantial progress in forest and crop research (16–18). However, there have been relatively few studies on hyperspectral remote sensing in the field of grassland science, which may be affected by the diversity of grassland types and the complexity of soil backgrounds. In a desertified steppe, only the recognition and classification of single ground objects is possible and is mostly used to distinguish vegetation from bare soil and calculate vegetation coverage (19).
Desertified steppes are usually located between the desert and grassland belts. Under the combined action of natural and human activities, fragmentation has occurred to different extents. Crops and tree plantations are characterized by a single species in a specific area, which can be identified in the form of surfaces in hyperspectral remote sensing images, whereas features of grassland desertification mostly appear in the form of points. Due to the ubiquitous phenomenon of “same objects with different spectra” and “same spectrum of foreign objects,” high-precision species identification is extremely difficult. When a steppe degrades and becomes desertified, the grass species tend to appear as single plants and appear as patch populations of different sizes, increasing the difficulty of high-precision identification and monitoring. UAVs have flexible control and low-altitude flight. Hyperspectral images have multiple and continuous bands, higher spectral and spatial resolution, and more spectral identification characteristics. Building a hyperspectral remote sensing platform for a low-altitude UAV based on the advantages of the two is the best choice for identifying and separating the desertified steppe degradation-indicator species. Using the advantages of hyperspectral images, our research group achieved feature extraction from grassland rodent holes and the separation of vegetation communities from non-vegetation areas based on ground data (20,21). In this study, UAV low-altitude remote sensing technology and hyperspectral imaging (HSI) technology were combined to extract the spectral information of degradation-indicator species Artemisia frigida Willd. and Stipa breviflora Grisb. in a desertified steppe against a complex soil background. The characteristic bands in the hyperspectral data of the plant populations were selected to establish the high-precision identification and classification model of the degradation-indicator species occurring in a desertified steppe in Inner Mongolia.
Materials and Methods
Experimental Area
The experimental area belongs to the temperate semi-arid grassland located in Gegentala Grassland (41°47’N, 111°53’E) in Siziwang Banner, Inner Mongolia Autonomous Region, China, in the central Inner Mongolia Plateau, with a southeast-northwest decreasing elevation gradient, where summers are hot and winters are cold, dry, and long (22). Annual precipitation is relatively low and concentrated in the summer months; the frost-free period is short and typical poor weather conditions of the temperate continental monsoon climate prevail. The desertification of the grassland in this region is relatively severe, which makes it representative of desertified steppe, with A. frigida Willd. and S. breviflora Grisb. as representative of the typical vegetation of the area. The soils are relatively barren calcite chestnuts, meaning they are classified as chestnut soils.The height of the vegetation community is low, the species are rare, and their distribution is sparse. The coverage rate is only 13%–35%.
Introduction to Degradation-Indicator Grass Species
Stipa breviflora Grisb. is a dense perennial herb in the family Gramineae. It generally turns green at the end of April, flowers at the end of May, bears fruit at the beginning of June, seeds mature at the beginning of July, and starts to wither in September. Stipa breviflora Grisb. has good drought tolerance and strong regeneration ability and is the main population building species in desertified steppe. Artemisia frigida Willd.is a perennial herb of the genus Artemisia in the family Asteraceae, with stems up to 70 cm tall, and grows from mid-March to April in Inner Mongolia, flowering and fruiting from July to October. It is highly adaptable, and is mainly found in desertified steppe and arid and semi-arid areas. In degraded grasslands, A. frigida Willd. has obvious population dominance, and is the dominant species in desertified steppe plant communities.
Experimental Equipment
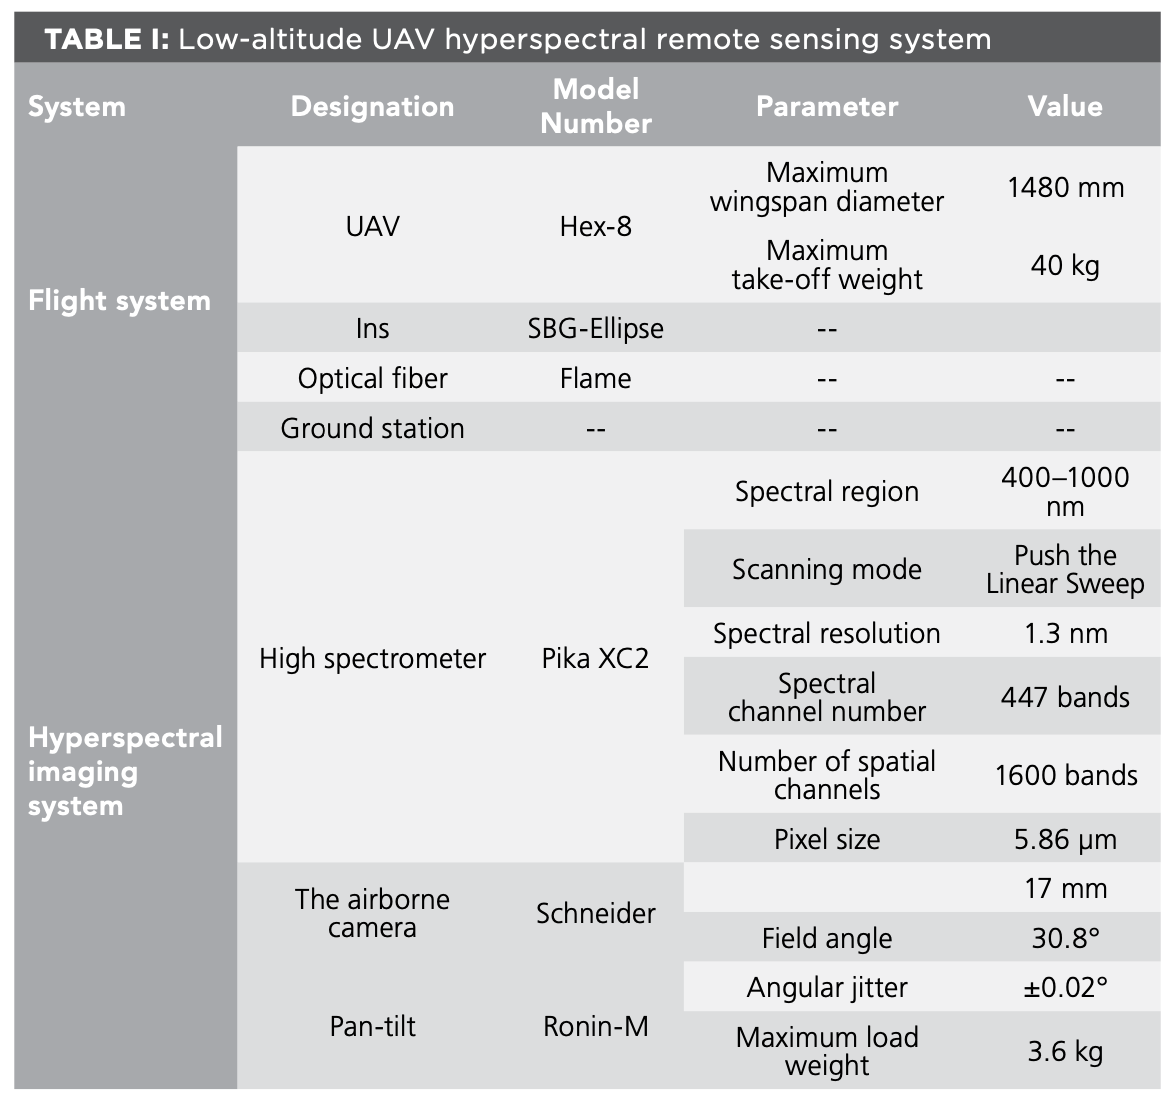
The low-altitude UAV hyperspectral remote sensing system constructed for this study mainly comprises a flight system and a hyperspectral imaging system. The specific parameters are shown in Table I.


Data Collection
According to the climatic conditions of the test area and the growth status of the native grassland vegetation, the data collection time was set from June to August each year from 2019 to 2021. The experimental area belongs to the no-grazing area, and at sampling time, the grassland vegetation was in the transition stage from the seed-setting to the dry yellow stage. A. frigida Willd., S. breviflora Grisb., and companion species grow well within this period and the grassland vegetation coverage rate is high.
The data collection area established for this study was 150 × 50 m and was precisely located using a handheld GPS. The HSI-UAV route was planned through the ground station; the overlap was set to 55% and the flight speed to 1 m/s. Data collection in the area was divided into three sorties with a 20-min duration for each flight in consideration of the aircraft’s power consumption. Fieldwork was only carried out in light wind conditions (≤5.4 m/s) and non-cloudy weather. Data collection time was set from 10:00 to 14:00 (local time) and the flight altitude was set at 30 m. Before data collection, a standard whiteboard was used to calibrate the spectrometer to eliminate errors caused by illumination differences. During data collection, the spectral data collection time, flying altitude, and the quadrat position were recorded in real time. To prevent errors, data from the same area were collected three times over a total duration of 180 min.
Data Preprocessing
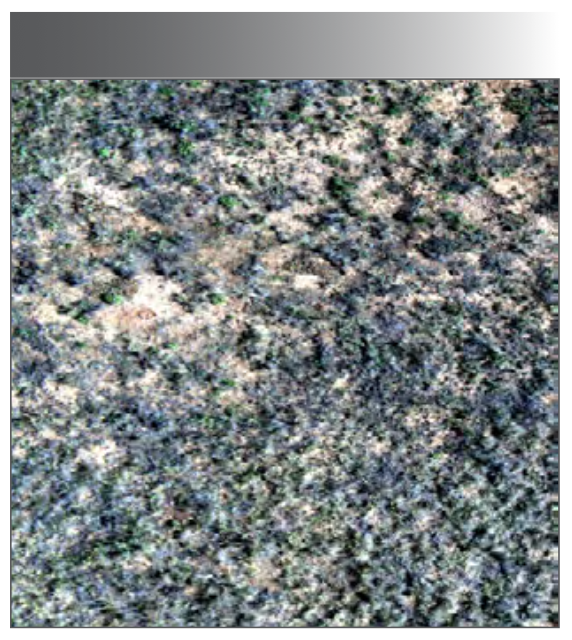
To weaken the influence of camera dark current and noise during the experiment, the hyperspectral image is smoothed by convolution. At the same time, the reflectance correction is performed on the hyperspectral image, and the original DN value of the pixel in the hyperspectral image is converted into the reflectance value. The corrected hyperspectral image of grassland vegetation population is shown in Figure 1.


FIGURE 1: Hyperspectral map of the desertified steppe.
Proposition and Application of the ASI Index Model and Classification Rules
The vegetation of the desertified steppe is mainly composed of degradation-indicator grass species A. frigida Willd. and S. breviflora Grisb. and their companion species, which were relatively few and unevenly distributed. Differences in growth among all the species present leads to difficulties in high-precision identification and classification of the plant species comprising the vegetation cover.
This study is based on differences in spectral characteristics indicated by degradation-indicator grass species in the desertified steppe within the study area. Degradation was analyzed by spectrum zooming calculation, which uses a grass seed-extraction method according to differences in plant height and chlorophyll content of different plant populations in the vegetation community, as reflected by the light reflection and absorption characteristics, which are used to construct the ASI vegetation-index model. The ASI index is calculated using equation 1:

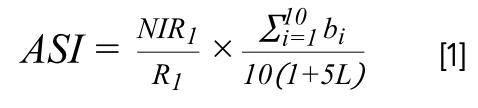

where NIR1 and R1 represent the near-infrared and red-light bands, respectively; bi represents the wavelength of band I; and L is the vegetation regulation coefficient, which is generally considered to be 0–1. Because vegetation was divided into three categories in this study, L was assigned a value of 0.3.
Analysis and Scaling of Spectral Characteristics
The vegetation community is affected by chlorophyll content, and two absorption peaks corresponding to blue and red light and a green light reflection valley in the range of 400–1000 nm were recorded. The spectral curves of S. breviflora Grisb. and companion species show typical vegetation characteristics. In turn, A. frigida Willd. shows a relatively low chlorophyll content; therefore, its spectral reflectance is lower than that of the companion species. The spectral absorption curve of wilted grass and bare soil increased proportionally and slowly, and the reflectance in the range of 550–650 nm was higher than those for the A. frigida Willd., S. breviflora Grisb. and companion species. There was no remarkable spectral absorption band or reflection peak.
The spectral reflectance value of the vegetation community was scaled and the effect of the scaling factor was added to the original spectral curve. The size of the scaling coefficient changes with the number of ground objects used for scaling, as per equation 2:


where Si represents the spectral curve of the image point, and K represents the scaling coefficient, and is equal to 5.
The spectral reflectance curve of vegetation is affected by the dominant species, and the spectral characteristics are reduced in the range of green light, such that the spectral reflectance of non-vegetated areas is higher than that of vegetation communities. At the 107th band, the reflectance of vegetation communities reached the lowest point in the green light range. Therefore, taking this band as the center, the reflectance value was selected for the statistics at 10-band intervals.
Extraction of Non-Vegetated Areas
According to the analysis of reflectance data after spectral scaling, the difference in spectral reflectance between a vegetated area and a non-vegetated area is amplified to 0.41 at the characteristic wavelength of 666.07 nm. Thus, it is necessary to extract the single-band gray image of the characteristic band for threshold segmentation. The feature band extraction operation is shown in Figure 2, and the threshold statistics are shown in Table II.


FIGURE 2: Grayscale image of characteristic band.
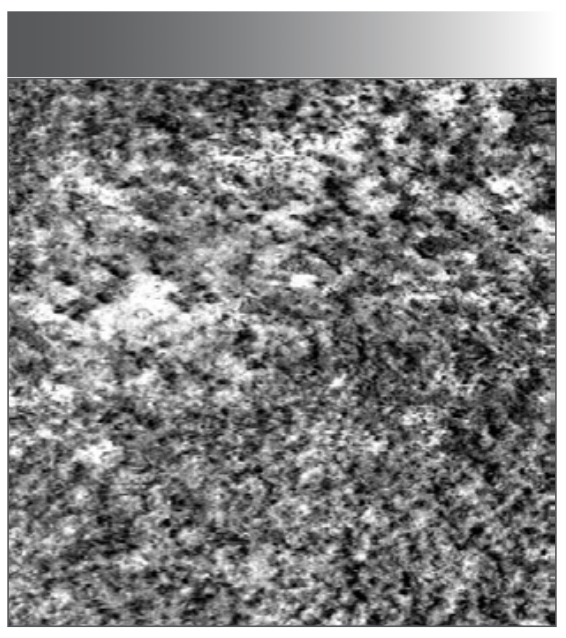


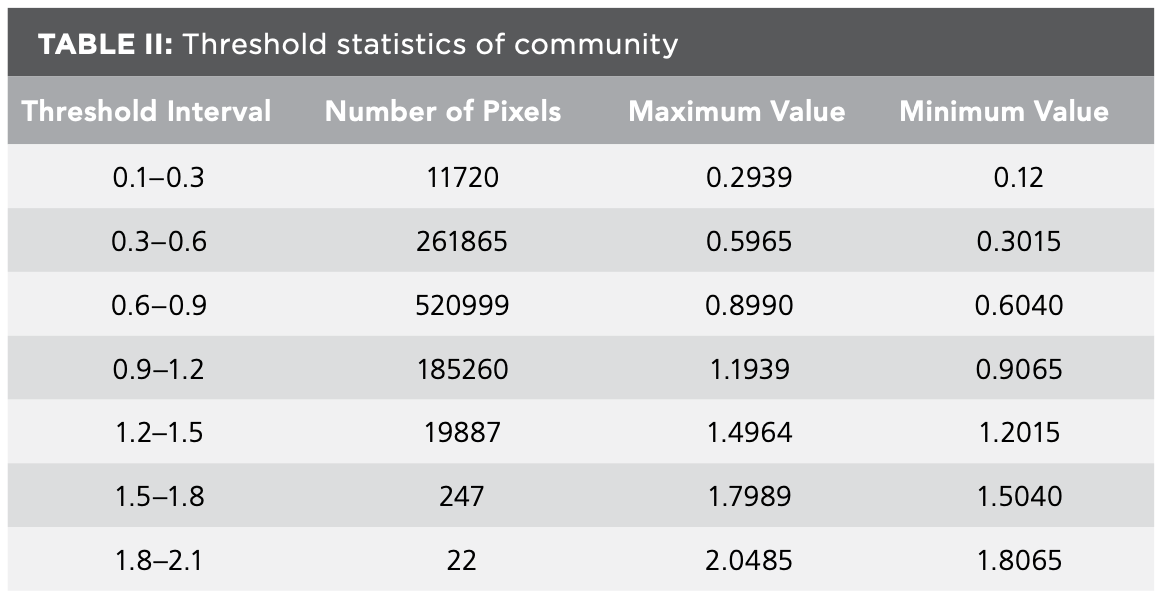
Table II lists the number of pixels in each threshold interval and the maximum pixel value in the interval in the 107th typical band image. The threshold range of the community is 0.12–2.0485. Compared with the pixel values in the gray and original images, the threshold between the vegetated and non-vegetated areas is 1.0048; thus, the threshold range of the vegetated area is 0.12–1.0048, and the threshold range of the non-vegetated area is 1.0048–2.0485.
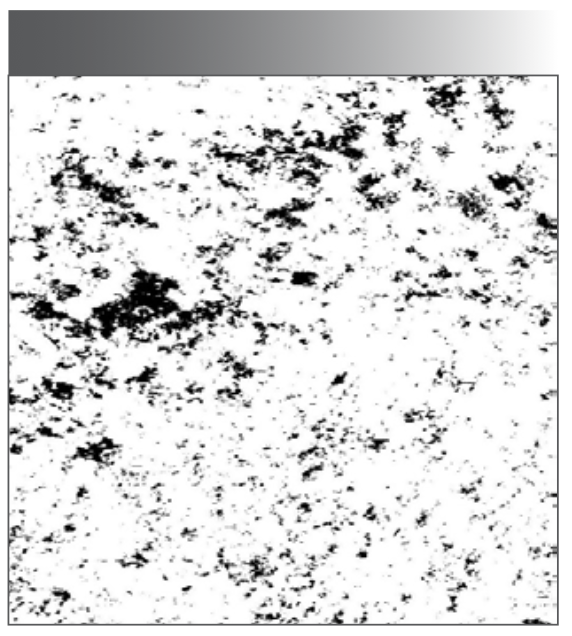
The vegetated area was extracted based on the above threshold division. The hyperspectral remote sensing images of vegetated and non-vegetated areas in the desertified steppe were extracted by masking. The degradation index image is shown in Figure 3, wherein the black portions of the image constitute a non-vegetated area, whereas the white parts constitute a vegetated area.


FIGURE 3: Mask image.
Identification and Classification of Degradation-Indicator Grass Species
After spectral scaling and threshold division, an image of the vegetation is shown as the white areas in Figure 3, where 500 pure pixels corresponding to A. frigida Willd., S. breviflora Grisb., and companion species were selected and used to calculate the average spectral curve shown in Figure 4, in which the black, blue, and red portions represent the spectral reflectance curves of companion species S. breviflora Grisb., and A. frigida Willd., respectively. Comparing the spectral characteristics analysis, we observed that the spectral reflectance of A. frigida Willd. was gentler than those of the other two types of plant communities, while the spectral reflectance of S. breviflora Grisb. and companion species clearly showed absorption and reflection, which are the spectral characteristics of typical vegetation communities. In the range of 520–780 nm, the minimum spectral reflectance of S. breviflora Grisb.and companion species was 666.07 nm, and the reflectance values were 0.1312 and 0.1071, respectively. Maximum spectral reflectance was recorded at 754.56 nm and the reflectance values at this band were 0.3127 and 0.5003, respectively. The spectral reflectance of A. frigida Willd. in the two characteristic bands was 0.1718 and 0.2169. In the wavelength range of 750–820 nm, the reflectivity of companion species remained stable between 1.7215 and 1.848, and that of S. breviflora Grisb. was stable between 1.3665 and 1.575. Meanwhile, the reflectivity curve of companion species was always higher than that of S. breviflora Grisb. in this range. According to the spectral characteristics of the plant populations, the near-infrared band with a wavelength of 746.49 nm and red band with a wavelength of 676.77 nm were selected, and the 10 bands between 743.81 and 768.01 nm were banded into equation 1 for mathematical calculation. The calculated grayscale image is shown in Figure 5.


FIGURE 4: Average spectral curve of vegetation.
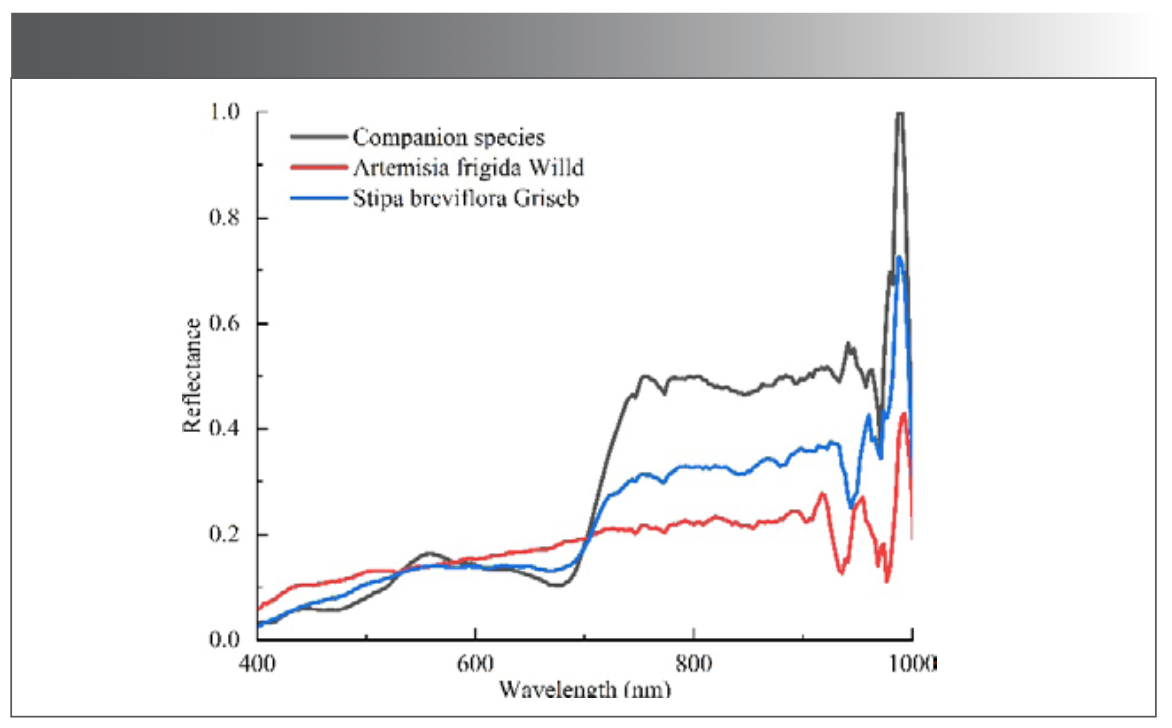

FIGURE 5: Plant population images after ASI operation.
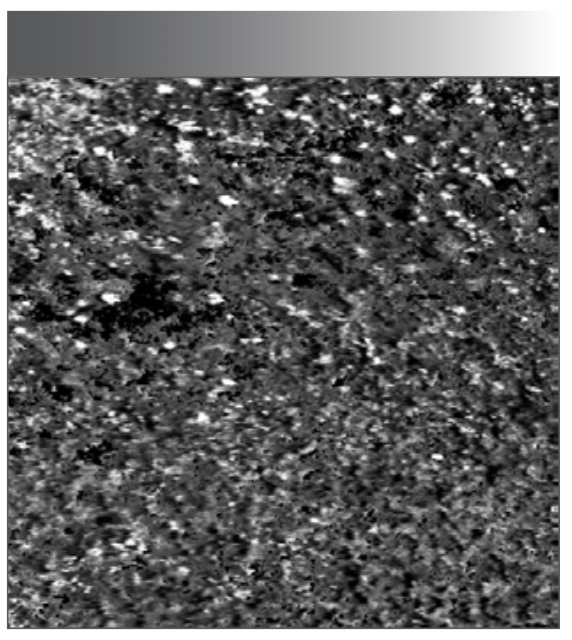
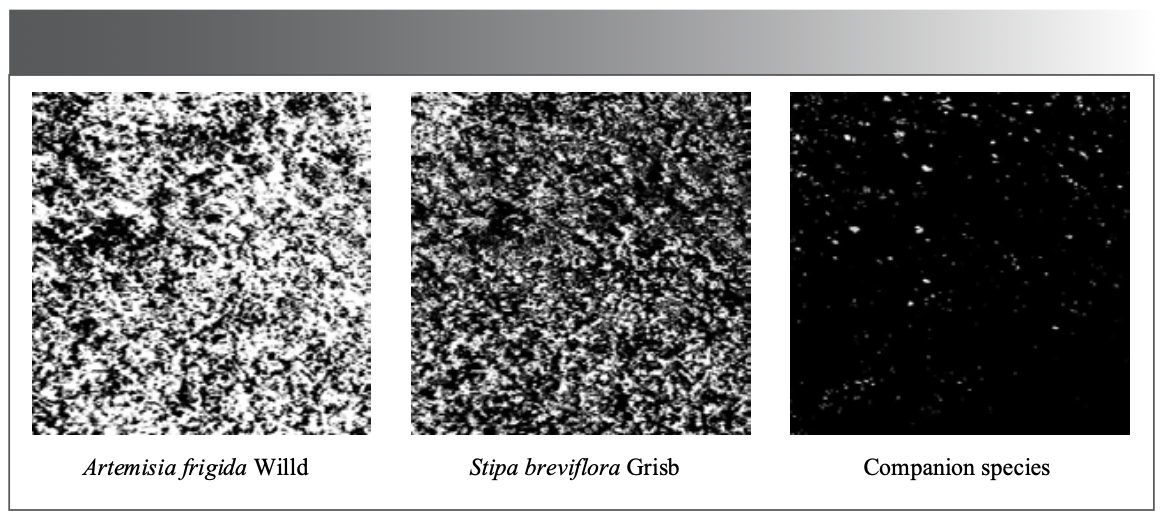
Table III lists the number of pixels and the maximum value of pixels in each threshold interval of each plant population. After calculation, the threshold interval of the vegetation community was 0.0355–2.2748. The threshold dividing boundary between A. frigida Willd. and S. breviflora Grisb. was 0.2824. In turn, the threshold dividing boundary between S. breviflora Grisb. and companion species was 0.5975. Therefore, the threshold intervals of A. frigida Willd. and S. breviflora Grisb. were 0.0355–0.2824 and 0.2824–0.5975, respectively, while the threshold dividing boundary for companion species was 0.5975–2.2748. After determining the threshold division interval of the vegetation community members, a mask image of the three types of plant populations was created, as shown in Figure 6.


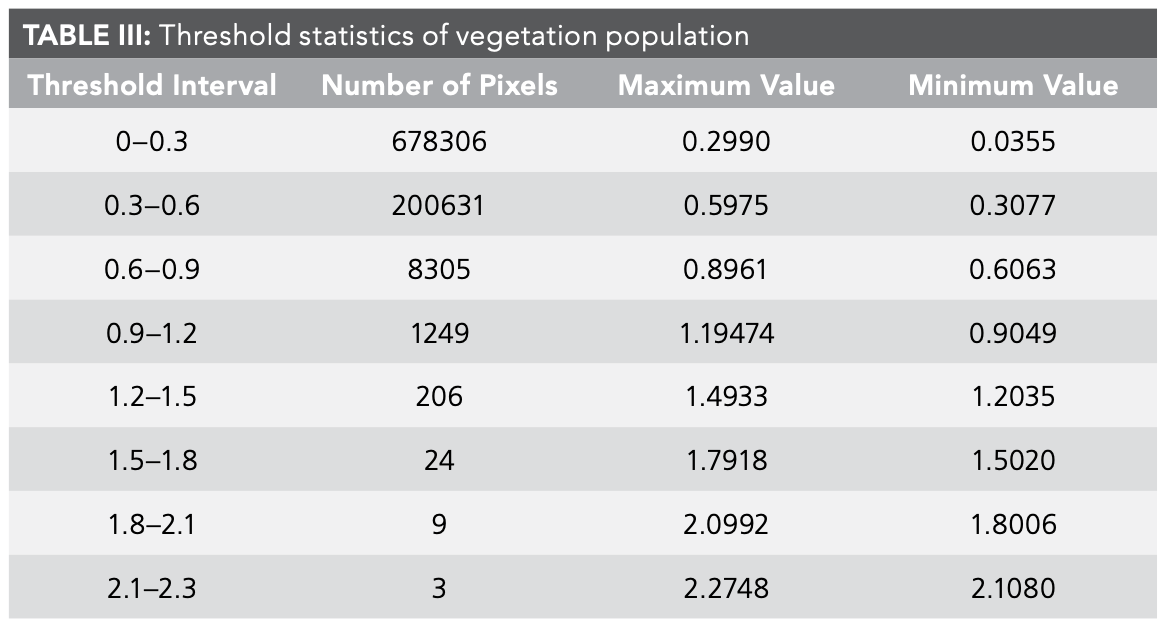


FIGURE 6: Classification of vegetation populations.
Results and Discussion
The kappa coefficient values for evaluation accuracy and overall evaluation accuracy based on the confusion matrix is a multivariate analysis method to test the accuracy of the classification of different species in remote sensing images (23). The kappa coefficient value was calculated using equation 3, and the overall accuracy was calculated using equation 4. The confusion matrix counts the number of measured and predicted pixels; the statistical results are shown in Table IV.

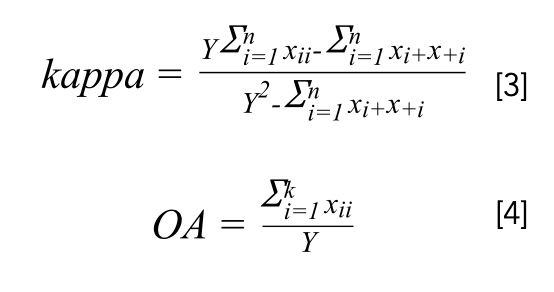

where Y represents the number of pixels of the sample; k represents the number of categories; xii represents the composition of the i-class and the i-class of the reference data in the classification results; and xi+ and x+i represent the sum of the elements of the i-line and the i-column of the confusion matrix.


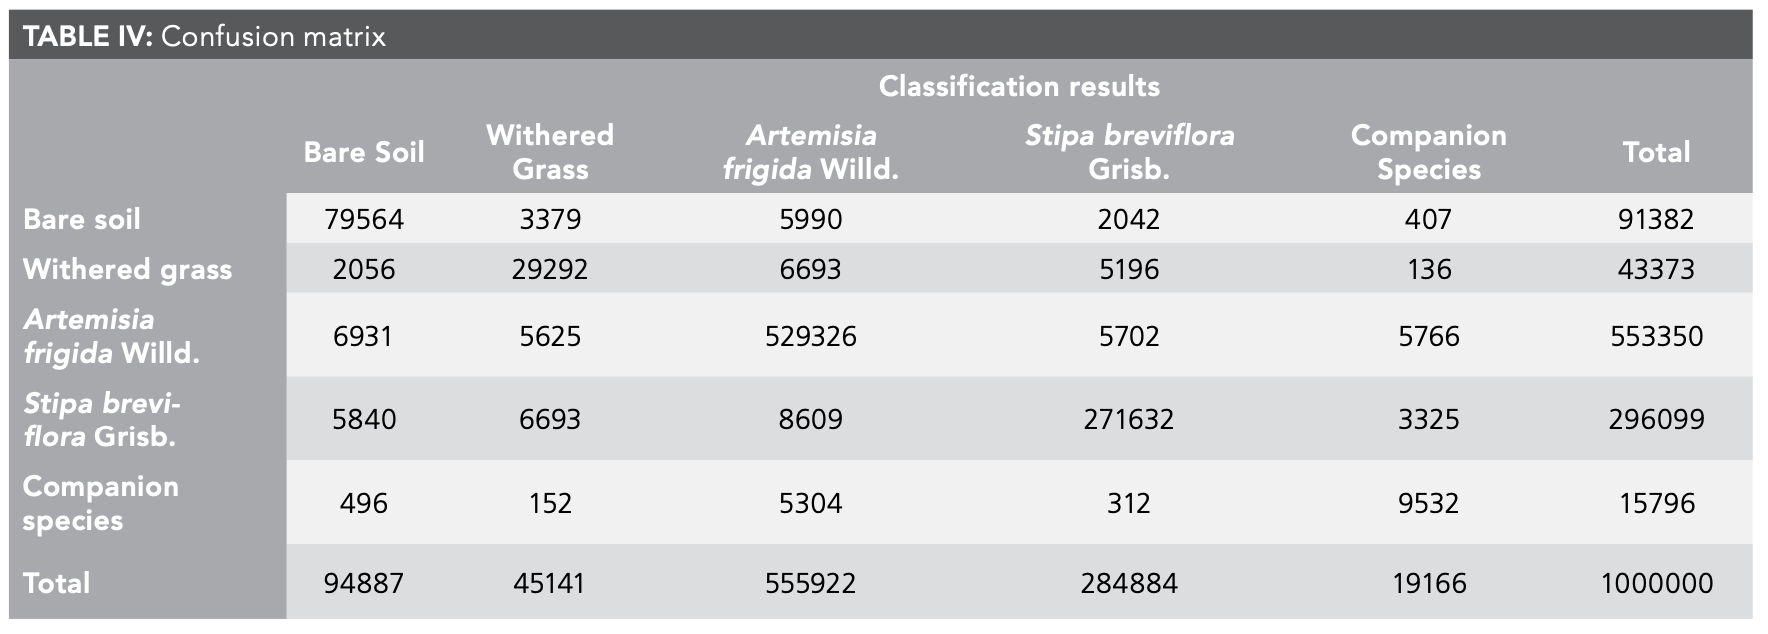
After constructing the confusion matrix, the Kappa coefficient value for the classification results reached 0.865, and the overall classification accuracy reached 91.9%. In the fine classification of plant populations, a certain degree of misclassification of edge pixels cannot be avoided and is closely related to the data radiation calibration and the selection of spectral characteristic bands. Currently, the study of grassland degradation by UAV remote sensing is in its infancy. Identifying ways to speed up data acquisition efficiency and improve data quality demands further research. At the same time, the accuracy of the ASI index needs to be improved, and the establishment of a more efficient and high-precision identification and classification model warrants further research.
Conclusions
In this study, a low-altitude UAV hyperspectral remote sensing system was used successfully to collect hyperspectral images of a desertified steppe under natural light. Taking a desertified steppe as the research object, the identification and classification of degradation-indicator grass species were conducted. Through analysis of the spectral characteristics of the vegetation community, the difference in spectral characteristics among communities was amplified, and the community divisions were made. The ASI index and classification rules were proposed. The characteristics of plant populations and those of UAV hyperspectral remote sensing data were fully utilized to solve the problems of high similarity, weak spectral differences, and difficulty in distinguishing between grassland plant populations. High-precision classification of degradation-indicator species A. frigida Willd. and S. breviflora Grisb. and companion species was conducted. The value of the kappa coefficient was verified to be 0.865, and the overall classification accuracy reached 91.9%. Therefore, this study provided a method for the unequivocal identification of grassland degradation-indicator grass species using a low-altitude UAV hyperspectral remote sensing system. Furthermore, it provided a sound theoretical basis for the subsequent calculation of vegetation coverage rate in desertified steppe, and data support for further identification of vegetation community members in desertified steppe.
Acknowledgments
This study was financially supported by the National Natural Science Foundation of China (No. 31660137).
Author Contributions
All authors contributed to the study conception and design. The first draft of the manuscript was written by Xinchao Gao. Material preparation, data collection, and analysis were performed by Fei Hao, Weiqiang Pi, Xiangbing Zhu, and Tao Zhang. Yanbin Zhang contributed to the editing of the manuscript and improved the illustrations. All authors commented on previous versions of the manuscript. All authors read and approved the final manuscript.
References
(1) Chadaeva, V.; Gorobtsova, O.; Pshegusov, R. et al. Stages of Grassland Degradation in Subalpine Ecosystems of the Central Caucasus, Russia. Chil. J. Agric. Res. 2021, 81 (4), 630–642. DOI: 10.4067/S0718-58392021000400630
(2) Hu, Y. G.; Wuyan. B. Understanding Desertification; Publisher of Renmin University of China, 2014.
(3) Su, K.; Yu, Q.; Yue, D. P.; et al. Simulation of a Forest-Grass Ecological Network in a Typical Desert Oasis Based on Multiple Scenes. Ecol. Modell. 2019, 413. DOI: 10.1016/j.ecolmodel.2019.108834
(4) Li, F.; Chen, W.; Zeng, Y.; Zhao, Q. J.; Wu. B. F. Improving Estimates of Grassland Fractional Vegetation Cover Based on a Pixel Dichotomy Model: A Case Study in Inner Mongolia, China. Remote Sens. 2014, 6 (6), 4705–4722. DOI: 10.3390/rs6064705
(5) Bucha, T.; Papčo, J.; Sačkov, I.; et al. Woody Above-Ground Biomass Estimation on Abandoned Agriculture Land Using Sentinel-1 and Sentinel-2 Data. Remote Sens. 2021, 13 (13), 2488. DOI: 10.3390/rs13132488
(6) Li, F.; Zheng, J. J.; Wang, H.; et al. Mapping Grazing Intensity Using Remote Sensing in the Xilingol Steppe Region, Inner Mongolia, China. Remote Sens. Lett. 2016, 7 (4), 328–337. DOI: 10.1080/2150704X.2015.1137987
(7) Fu, B.; Qi Y. B.; Chang, Q. R. Impacts of Revegetation Management Modes on Soil Properties and Vegetation Ecological Restoration in Degraded Sandy Grassland in Farming-Pastoral Ecotone. Int. J. Agric. Biol. Eng. 2015, 8 (1), 26–34. DOI: 10.3965/j.ijabe.20150801.004
(8) Anderson, K. E.; Glenn, N. F.; Spaete, L. P.; et al. Estimating Vegetation Biomass and Cover Across Large Plots in Shrub and Grass Dominated Drylands Using Terrestrial Lidar and Machine Learning. Ecol. Indic., 2018, 84, 793–802. DOI: 10.1016/j.ecolind.2017.09.034
(9) An, R.; Wang, H. L.; Feng, X. Z.; et al. Monitoring Rangeland Degradation Using a Novel Local NPP Scaling Based Scheme over the “Three-River Headwaters” Region, Hinterland of the Qinghai-Tibetan Plateau. Quatern. Int., 2017, 444, 97–114. DOI: 10.1016/j.quaint.2016.07.050
(10) Azzouzi, S. A.; Vidal-Pantaleoni, A.; Bentounes, H. A. Monitoring Desertification in Biskra, Algeria Using Landsat 8 and Sentinel-1a Images. IEEE Access, 2018, 6, 30844–30854. DOI: 10.1109/ACCESS.2018.2837081
(11) Brabant, C.; Alvarez-Vanhard, E.; Laribi, A.; et al. Comparison of Hyperspectral Techniques for Urban Tree Diversity Classification. Remote Sens. 2019, 11 (11), 1269. DOI: 10.3390/rs11111269
(12) Cao, J. J.; Leng, W. C.; Liu, K.; et al. Object-Based Mangrove Species Classification Using Unmanned Aerial Vehicle Hyperspectral Images and Digital Surface Models. Remote Sens. 2018, 10 (1). DOI: 10.3390/rs10010089
(13) Fritz, S.; See, L.; Bayas, J. C. L.; et al. A Comparison of Global Agricultural Monitoring Systems and Current Gaps. Agric. Syst. 2018, 168, 258–272. DOI: 10.1016/j.agsy.2018.05.010
(14) Lu, B.; He, Y. H. Species Classification Using Unmanned Aerial Vehicle (UAV)-Acquired High Spatial Resolution Imagery in a Heterogeneous Grassland. ISPRS-J. Photogramm. Remote Sens. 2017, 128, 73–85. DOI: 10.1016/j.isprsjprs.2017.03.011
(15) Ma, L.; Li, M. C.; Tong, L. H.; Wang, Y. F.; Cheng, L. “Using Unmanned Aerial Vehicle for Remote Sensing Application.” 2013, 21st International Conference on Geoinformatics, Kaifeng, June 20–22.
(16) Zhou, Y. M.; Jiang, M. J. Comparison of Inversion Method of Maize Leaf Area Index Based on UAV Hyperspectral Remote Sensing. Multimed. Tools Appl. 2020, 79 (23–24), 16385–16401. DOI: 10.1007/s11042-019-7318-9
(17) Vanegas, F.; Bratanov, D.; Powell, K.; Weiss, J.; Gonzalez, F. A Novel Methodology for Improving Plant Pest Surveillance in Vineyards and Crops Using UAV-Based Hyperspectral and Spatial Data. Sensors, 2018, 18 (1), 260. DOI: 10.3390/s18010260
(18) Nevalainen, O.; Honkavaara, E.; Tuominen, S.; et al. Individual Tree Detection and Classification with UAV-Based Photogrammetric Point Clouds and Hyperspectral Imaging. Remote Sens. 2017, 9 (3), 185. DOI: 10.3390/rs9030185
(19) Pi, W. Q.; Bi, Y. G.; Du, J. M.; et al. Classification of Grassland Desertification in China Based on vis-NIR UAV Hyperspectral Remote Sensing. Spectroscopy, 2020, 35 (3), 39–50.
(20) Zhu, X. B.; Bi, Y. G.; Liu, H.; et al. Study on the Identification Method of Rat Holes in Desert Grasslands Based on Hyperspectral Images. Chin. J. Soil Sci. 2020, 51 (2), 263–268. DOI: 10.19336/j.cnki.trtb.2020.02.02
(21) Pi, W. Q.; Du, J. M.; Chen, C.; et al. Identification and Classification of Surface Micrograss on Grassland Based on Hyperspectral SMPI Method. J. Optoelectron, 2018, 29 (11), 1237–1243. DOI: 10.16136/j.joel.2018.11.0032
(22) Li, Q. C.; Li, Y. J.; Wang, D. L.; et al. Comparative Analysis of Soil Aggregates and Organic Carbon Distribution in Grassland and Cultivated Land—A Case Study in Siziwang Banner of Inner Mongolia. Bull. Soil Water Conserv. 2019, 39 (1), 50–54, 60. DOI: 10.13961/j.cnki.stbctb.2019.01.008
(23) Foody, G. M. Explaining the Unsuitability of the Kappa Coefficient in the Assessment and Comparison of the Accuracy of Thematic Maps Obtained by Image Classification. Remote Sens. Environ. 2020, 239. DOI: 10.1016/j.rse.2019.111630
Xinchao Gao, Xiangbing Zhu, Tao Zhang, Yuge Bi, and Yanbin Zhang are with the Mechanical and Electrical Engineering College of Inner Mongolia Agricultural University, in Hohhot, China. Fei Hao is with the School of Mechanical and Electrical Engineering Hohhot Vocational College, in Hohhot, China. Weiqiang Pi is with the School of Mechanical and Electrical Engineering Huzhou Vocational and Technical College, in Huzhou, China. Direct correspondence to Xinchao Gao at xinchao0616@163.com ●


Newsletter
Get essential updates on the latest spectroscopy technologies, regulatory standards, and best practices—subscribe today to Spectroscopy.


Hyperspectral Imaging for Walnut Quality Assessment and Shelf-Life Classification
June 12th 2025Researchers from Hebei University and Hebei University of Engineering have developed a hyperspectral imaging method combined with data fusion and machine learning to accurately and non-destructively assess walnut quality and classify storage periods.

Researchers Use Machine Learning and Hyperspectral Imaging to Pinpoint Best Apple Bagging Techniques
June 12th 2025A new study demonstrates that paper bagging significantly enhances Fuji apple quality and appearance. Hyperspectral imaging combined with machine learning offers a powerful, non-destructive method for evaluating fruit grown under different cultivation conditions.


