Key Points to Remember When Using Internal Standards for Sample Analysis by ICP-OES
Using internal standards is a common technique to correct for variations in sample matrices and the affect this has on analyte intensities. There are several basic criteria to be considered when using internal standards: selection of appropriate internal standards, the concentration added to the solutions analyzed, setting up in the correct view (axial vs. radial), how to introduce the internal standard to the solutions to be analyzed, and evaluating the resulting data. Each of these topics are considered and suggestions presented.
In the analysis by plasma techniques, the percentage of each solution analyzed that reaches the plasma can vary due to differences in sample matrices, particularly when compared to simple standards. When this occurs, sample results can be incorrect. Compensating for this problem can be done by matrix matching by preparing calibration solutions in the same type of matrix as the samples; by using the method of standard additions for calibration; or by using internal standards as part of the method. Note that matrix matching and method of additions may not always be practical.
Internal standards are elements that are added to all analytical solutions. Their intensities are monitored during analysis. As intensities fluctuate in each solution, most instrument software can correct the readings of the analytes to be determined and report percent recoveries of the internal standards. The use of internal standards has become an integral part of most methods for analysis by plasma techniques for obtaining accurate data. While this has become a common correction technique, the analyst must be aware of several key points to consider when using internal standards.
Selection of the Internal Standards
When selecting elements to be used as internal standards, there are a few basic rules. First, internal standards are elements that don’t need to be determined. Second, they have to be elements that won’t be found in any measurable concentration in any of the samples. Third, be sure the internal standards won’t spectrally interfere with the elements to be determined, or that the other constituents of the samples won’t spectrally interfere with the internal standards. Fourth, internal standards should never be elements that are common environmental contaminants, even if these elements are not in any of your samples. Both yttrium (Y) and scandium (Sc) are chosen for many applications following the above criteria, though they may not be the correct choices for all types of analyses. While choosing internal standards for most types of samples is generally not difficult, for the analysis of some types of samples, selection can be challenging, and may require more rigorous method development.
Internal Standard Concentration
The actual concentration of the internal standard should be based on the intensity produced by the internal standard. There should be enough intensity from the internal standard that precision of the replicates is optimum (better than 2% relative standard deviation [RSD] in calibration solutions). Poor precision should not play a major role in the correction of the analyte readings. The correction itself is a linear function, so the maximum intensity of the internal standard must be in the linear range for the wavelength chosen.
Setting up the Internal Standard in the Correct “View”
Since many inductively coupled plasma–optical emission spectroscopy (ICP–OES) devices have dual viewing capabilities, it is important to note that the internal standards must be in the same “view” as the analytes to be determined. If the analyte is viewed axially (down the plasma), the internal standard must be in that view also. If the analytes are viewed radially (across the plasma), so must the internal standard be viewed. This might require the use of multiple internal standards if the method has some elements in the axial view and some in the radial view.
Introduction of the Internal Standard
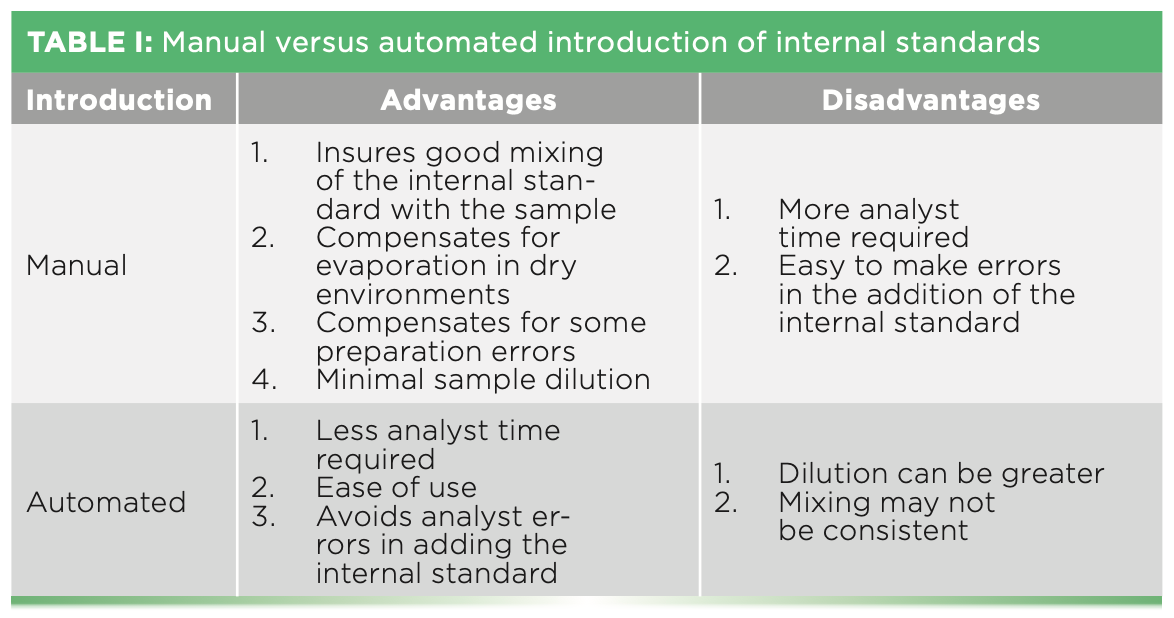
How the internal standard will be added to each solution is of key importance. Concentrations of the internal standards must be the same in all analytical solutions in order for the correction to be accurate. Addition can be made manually by the analyst or automated using either another channel on a peristaltic pump or a valve system to introduce the internal standard to the analytical solutions. Both addition techniques have advantages and disadvantages, as shown in Table I. Whichever way is chosen, evaluation of the resulting data is essential.


Evaluation of the Data
There are three areas to consider when evaluating data:
- While variations of internal standard recoveries from solution to solution is normal, samples with excessively low or high recoveries should always be investigated before reporting data. Excessive changes of the internal standard intensities may indicate that it was not added correctly to that solution, whether the addition is done manually (due to pipetting or analyst errors) or automated (due to improper mixing). If the recovery in a sample is very high, this may also indicate the internal standard was in the original sample. Some regulatory agencies suggest internal standard recoveries of samples should be within 20% as compared to calibration solutions. While perhaps a good rule of thumb, the actual recovery acceptability can be analysis-specific. Once established, if the internal standard recovery is out of the expected range, it is always a good idea to view the spectral data first to determine if a spectral interference has occurred.
- Paying close attention to the precision of internal standard replicates is critical and can be more important that the actual recovery. RSDs of the internal standard replicates greater than 3% should be further investigated as this can cause incorrect analyte results. Poor precision on the internal standard replicates can indicate poor mixing, so this is particularly important when using automated mixing.
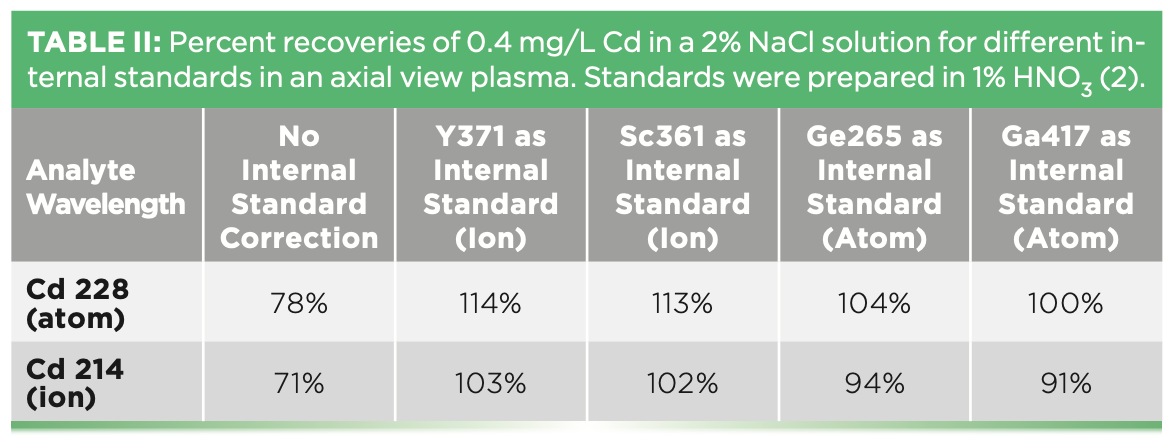
- Concentrations greater than 1% of easily ionized elements in samples can reduce the ion population and enhance the atom population of analytes to be determined when compared to the calibration solutions. This can lead to incorrect results for some elements, depending on the analyte wavelengths chosen and the internal standards used. This effect is more pronounced in the axial view. One remedy for this is to reduce the sample matrix by diluting the sample, thus reducing the concentration of the easily ionized elements. This is only appropriate if the concentrations of the analytes are still sufficient to be reportable after dilution. Another approach includes optimizing the instrumental parameters (gas flows and sample introduction parameters) (1). A third is to add an ionization buffer to all solutions, which adds an excess of an easily ionized element to all analytical solutions, including standards. A fourth approach is to use internal standards that mimic the wavelengths for the elements of interest. If ion wavelengths are used for the elements, use an ion wavelength for the internal standard. If the wavelength for the analyte is an atom wavelength, use an internal standard with an atom wavelength. Table II shows some comparative data for cadmium (Cd) at two wavelengths, one atom and one ion, in a 2% sodium chloride (NaCl) solution. Four different internal standards were investigated: Y371 and Sc361, both ion wavelengths, and Ge265 and Ga417, both atom wavelengths. When no internal standard correction is made, Cd recoveries are very low for both wavelengths. For Cd228, an atom wavelength, germanium (Ge) and gallium (Ga) provide the most accurate recoveries. For Cd214, an ion wavelength, Y and Sc provide the most accurate recoveries. It may be necessary to use multiple internal standards when the sample matrix has more than 1% total dissolved solids in order to obtain the most accurate results.


Conclusion
Using internal standards for analysis by ICP-OES is an essential part of good method development for most types of samples, but the analyst must be aware of several points in order to insure the reporting of accurate data.
References
(1) Mermet, J. M. Use of Magnesium as a Test Element for Inductively Coupled Plasma Atomic Emission Spectrometry Diagnostics. Anal. Chim. Acta 1991, 250, 85–94. DOI: 10.1016/0003-2670(91)85064-Y
(2) Bradshaw, D. K. Identification and Correction of Interferences in Practical ICP-OES. Short course, Winter Plasma Conference 2022.
Deborah Bradshaw is an analytical chemist who has been working the field of atomic spectroscopy for over 35 years. For the past 20 years, she has been working as a consultant in the field of atomic spectroscopy, conducting training classes and giving technical support for atomic absorption (AA) spectroscopy, inductively coupled plasma–optical emission spectroscopy (ICP–OES), and inductively coupled plasma–mass spectrometry (ICP–MS). Direct correspondence to: bradshawdk@cs.com ●


Newsletter
Get essential updates on the latest spectroscopy technologies, regulatory standards, and best practices—subscribe today to Spectroscopy.


The Role of ICP-OES in Analyzing the Metal Content in Pet Food
June 19th 2025Because the United Arab Emirates is seeing an increase in pet ownership, the quality of both dry and wet pet food is undergoing greater scrutiny to ensure its safety and efficacy. Lucy Semerjian, who works as a Chair and Associate Professor in the Department of Environmental Health Science at the University of Sharjah in Sharjah, United Arab Emirates, recently explored this topic in a recent paper
Pet Food in the United Arab Emirates: An Interview with Lucy Semerjian
June 18th 2025A recent study conducted in the Journal of Food Composition and Analysis examined the concentrations of ten metals in 52 commercially available wet and dry cat food samples, assessing their compliance with U.S. and European pet food safety standards. The lead author of this study, Lucy Semerjian, recently sat down with Spectroscopy to discuss the findings of her study.

New Study Finds Elevated Metal Levels in Some Cat Foods Sold in Sharjah
May 27th 2025A new study published in the Journal of Food Composition and Analysis by researchers at the University of Sharjah reveals that while most cat foods sold in Sharjah meet international safety standards, some contain elevated metal levels, prompting calls for stricter regulation and quality control to protect pet health.

FT-IR Microscopy, Part 2: Mid-IR Sampling with DRIFTS, IRRAS, and ATR
February 14th 2025Fourier transform infrared (FT-IR) microscopy using reflection methods (diffuse reflection, reflection/reflection-absorption, or attenuated total reflectance) typically requires less sample preparation than transmission. However, optimal results will depend upon the sample and, in particular, the sample surface.


