|Articles|May 1, 2016
- Spectroscopy-05-01-2016
- Volume 31
- Issue 5
Review of New Spectroscopic Instrumentation 2016
Author(s)Howard Mark, Mike Bradley
Our annual review of products introduced at Pittcon or during the previous year, broken down by the following categories: accessories, atomic spectroscopy, components, imaging, mass spectrometry, mid-IR, NIR, NMR, Raman, software, UV-vis, and X-ray.
Advertisement
Our annual review of new spectroscopy products introduced at Pittcon or during the previous year.
Here we present our annual review of new spectroscopy instruments, components, and accessories, including our assessment of what these new products reveal about instrumentation trends.
In the past, our annual review was restricted to products introduced at the Pittsburgh Conference (Pittcon). A few years ago, however, we began including products introduced independently of Pittcon, reflecting the fact that vendors are increasingly launching their products at a variety of conferences and trade shows and sometimes without any connection to an event. Thus, we are reviewing products released at Pittcon (the vast majority that appear here) as well as other products launched in the last 12 months.
For many reasons, Pittcon attendance has been decreasing in recent years. The attendance in 2016 was down more than 10%, with 12,841 official attendees (7374 conferees, 5082 exhibitors, and 385 other registrants) versus 14,272 in 2015. The exposition remains strong, with 846 exhibiting companies occupying 1538 booths (
The review that follows is organized alphabetically (with the exception of accessories and components, both of which appear at the end) and categorized by wavelength region or type of spectroscopy (that is, mid-infrared [mid-IR], X-ray, Raman, and so forth). This structure allows readers to compare instruments from different manufacturers, but it also sometimes classes handhelds with high-end research tools. The categories used to classify the products are
- Atomic spectroscopy
- Imaging
- Mass spectrometry (MS)
- Mid-IR spectroscopy
- Near-infrared (NIR) spectroscopy
- Nuclear magnetic resonance (NMR)
- Raman spectroscopy
- Software
- UV–visible spectroscopy
- X-ray
- Accessories
- Components
Some of these categories (such as imaging) did not appear in last year’s review, while others that appeared last year (fluorescence) are missing this year, reflecting the ebb and flow of product development emphasis. In our taxonomy, “accessories” and “components” are inherently very general categories. The dividing line is this: “Accessories” (such as a sampling device) are used with an instrument, whereas “components” (such as a laser source or detector) are part of an instrument. The “software” category is focused on software developed independently from instruments, rather than software built to drive a particular instrument.
The Broad Trends
Instrumentation is evolving to cover an ever wider array of scientific problems, with a lot of activity at two extremes: At one end, the position of high-end instrumentation remains solid-witness the increasing resolution of mass spectrometers. On the other end, routine and field analyses are increasingly being taken over by handheld or portable devices.
This latter trend was the topic of two sessions at Pittcon, one on portable spectrometers and another on spectrometers driven by cell phones-and even cell phones as spectrometers. Fourier transform infrared (FT-IR), Raman, laser-induced breakdown spectroscopy (LIBS), and even NMR and MS systems are finding their way into the smaller footprints. In this approach, the standard attached computer is being replaced by “smart” devices, where the sensing, control, and analysis (that is, what is the answer?) are contained within the sensor.
The resulting stand-alone devices are far less limited than one would expect. However, these devices are not competitive with their larger, benchtop cousins in terms of sensitivity, signal-to-noise ratio, analytical performance, or other specifications. For instance, the small-footprint NMR devices are not yet capable of two-dimensional (2D) NMR. A major driving force, noted in last year’s review, involves the “analyzer” class of devices, where a specific customer need is met by a dedicated device; whereas benchtop units typically strive for flexibility, the portables are drilling down to an analytical need. It is noteworthy that while many of these devices started with small start-up companies, many are now part of mainstream analytical companies (such as Ahura and PicoSpin at Thermo Fisher Scientific, SensIR at Smiths Detection, and A2 at Agilent Technologies).
Instruments are also evolving to detect components in even smaller sampling sizes. Microliter sampling is now easy (Thermo Fisher Scientific) and both Raman and IR have been coupled with atomic force microscopes. Commercial fluorescence microscopes offer single-molecule detection (SMD) capabilities, and recent work in academic circles promises a broader range of SMD tools within the next few years.
Some devices, such as diamond attenuated total reflection (ATR) accessories for FT-IR and handheld Raman instruments, were launched in 2016 by multiple vendors. Obviously, all identified the same market need. Whether the market will provide a sustainable customer base for so many different vendors with generally the same offerings is not yet clear.
The Products
Each section of the review includes a brief discussion of interesting new products in the category and any salient trends. The corresponding table lists all the products in the category, in alphabetical order, and summarizes unique features. As noted earlier, the accessories and components sections are not listed alphabetically this year; instead they appear at the end.
As in the past, it is inevitable that some categories include products that might arguably be classified elsewhere, especially in regards to accessories, components, and software. Even some hyphenated techniques, such as inductively coupled plasma–mass spectrometry (ICP-MS) could be listed in either location. In such cases, the authors respected the classification given by the manufacturer.
“Imaging” represents a unique challenge. All imaging instruments use some underlying technology to create the images. There were enough products identified as “imaging” to warrant a separate category this year, but some imaging instruments (such as Raman imaging instruments) will be found under the corresponding technology; readers will need to check both categories. Readers also can search by company name in Table I to see under which categories a given company’s products are listed. A few products based on multiple technologies are listed in more than one category.
Atomic Spectroscopy
At a high level, the key evolution within atomic spectroscopy (Table II) appears to involve the incorporation of new technologies-such as light-emitting diodes (LEDs) into the same core instrument design. As another example of the incorporation of new technologies, Agilent’s ICP-OES system uses a dichroic spectral combiner to run samples faster.
CLICK TABLE TO ENLARGE
IF TABLE IS STILL TOO SMALL, CLICK ONCE MORE AND IT WILL ENLARGE FURTHER
Looking at the other specific offerings this year, we see that four companies are offering LIBS instruments. Elemission’s instrument can analyze rocks of any form and size, either clean or with dirt, water, and so forth, at 100 spectra/s. The instrument from LTB Lasertechnik Berlin GmbH has very high spectral resolution (50,000 over the range 250–900 nm). B&W Tek has launched a handheld LIBS instrument. A new product from rap.ID combines LIBS with optical microscopy.
Horiba is showing two novel technologies. Its innovative glow-discharge instrument measures layer thickness and crater depth. The company also has a nondispersive analyzer for carbon and sulfur. Shimadzu has an ICP-MS instrument with reduced gas consumption. Teledyne Leeman Labs provides an ICP-OES instrument for environmental applications. Agilent’s ICP-MS system includes optimization tools to simplify method development and operation.
Imaging
In previous years, a paucity of imaging products prevented our including this section in our review. Activity in 2016 enables us to reinstate this section (Table III).
CLICK TABLE TO ENLARGE
IF TABLE IS STILL TOO SMALL, CLICK ONCE MORE AND IT WILL ENLARGE FURTHER
The term imaging can be applied to many fields, including visible image collection, spectroscopy, and NMR. The result is a hypercube of data, often including spatial relationships. Visible imaging, especially for use in unmanned aerial vehicles (UAVs), now commonly known as drones, was specifically mentioned (by Headwall Photonics and BaySpec). This is a first step, we think, because the combination of handheld technology, imaging technology, and UAV operations should lead to increasingly sophisticated, low-cost, environmental monitoring tools. Aircraft do this already, but now tools are coming on-line for cost-effective UAV mounting. Wastewater effluent tracking and deforestation are two other exciting applications for this combined technology.
Andor showed an ultrafast platform for nanosecond time-resolved imaging and spectroscopy, using a unique combination of frame rates from 40 up to 4000 fps with better than 2-ns gating. Bayspec provides push-broom and snapshot models of high-performance mobile systems. Headwall Photonics has a unit designed for image collection from airborne platforms.
Middleton showed a combined hyperspectral and fluorescence imager. Optical Support presented a near-IR fluorescence system. Bruker BioSpin manufactures a magnetic resonance imaging (MRI) device with a 3-T magnet.
Mass Spectrometry
We received very few submissions for the MS category (Table IV), although MS is a popular and highly competitive market space. The likely explanation is that the major instrument companies that manufacture these complicated and expensive instruments primarily launch them at the Annual Conference on Mass Spectrometry and Allied Topics (ASMS) or other mass spectrometry conferences and did not submit forms for us to consider them for this review.
CLICK TABLE TO ENLARGE
IF TABLE IS STILL TOO SMALL, CLICK ONCE MORE AND IT WILL ENLARGE FURTHER
Thus, we have two products to include in this category this year. In connection with portability of instruments, Bayspec has a mass spectrometer that can be carried by one person. Cerno Bioscience provides a mass spectrometer with sub-part-per-million mass accuracy.
Mid-IR
Most of the new FT-IR products (Table V) match the theme we identified involving tools for specific types of analysis. Some new products were highly application-specific: Biotools launched a protein structure analyzer, optimized for that application. Block Engineering combines a mid-IR laser spectrometer with photoacoustics for a sensitive multigas analyzer. Bruker Optik has a gas analyzer for monitoring smokestacks, auto exhaust, and more. Gasera also has a photoacoustic gas analyzer for trace gas monitoring. Others involved general purpose FT-IR devices designed to be incorporated into process control or other specific applications: Keit manufactures a rugged, no-moving-parts spectrometer for direct insertion into production equipment. Thermo Fisher Scientific provides a gas analyzer to fit into a standard 19-in. rack. PerkinElmer manufactures an instrument designed for scientists in academia, pharmaceuticals, and more.
CLICK TABLE TO ENLARGE
IF TABLE IS STILL TOO SMALL, CLICK ONCE MORE AND IT WILL ENLARGE FURTHER
Agilent provides a mobile device with minimum weight (5 lb) and other characteristics to enhance the user experience.
With the horsepower race (signal-to-noise ratio) in mid-IR having reached limits beyond what most normal applications require, the main developments in this area appear to be related to usability and software tools. Usability improvements included a sample compartment microscope (Czitek) and new accessories (Harrick, Specac). Software is discussed in a separate section below, but we note here that the instrument control interfaces for many vendors are changing, driven by both customer expectations (the cell phone experience) and software platform obsolescence.
NIR
NIR Trends
The general trend in NIR instrumentation (Table VI), which started slowly a good while back and has been growing steadily since, is for manufacturers to provide instruments precalibrated for specific commodities or ingredients that their customers want to measure. This would remove one of the biggest impediments to selling NIR instrumentation: the need for development of a calibration around new products and analyses. Specific analyzers allow users to perform additional analyses, often with lower total costs and much faster implementation. Increasingly, the value is driven less by hardware-which is often already good enough-than by the sets of calibration models that the manufacturer can supply to the user. Sometimes these new calibration models are offered in conjunction with extra algorithmic capabilities, but often they are simply adjunct to the algorithms already available.
CLICK TABLE TO ENLARGE
IF TABLE IS STILL TOO SMALL, CLICK ONCE MORE AND IT WILL ENLARGE FURTHER
CLICK TABLE TO ENLARGE
IF TABLE IS STILL TOO SMALL, CLICK ONCE MORE AND IT WILL ENLARGE FURTHER
Driven by this analyzer market, NIR products have been evolving quickly toward smaller sizes. This is most obvious from the number of handhelds appearing each year, with slightly different value propositions and performance, but with the same end goal of supplying a simple tool for a targeted analysis. Benchtop instruments are also coming down in size and cost. We are currently seeing components like broadband LED sources and specialized detectors driving this trend, and the increase in specialized detectors and sources we note in the components section will accelerate this move into even more specialized niches.
New NIR Products
ABB offers in-line monitoring and control of continuous processes. B&W Tek’s instrument has a capability of combining NIR with UV–vis measurements. Galaxy Scientific improves the analytical results of its portable instrument by having permanently aligned optics. Viavi has an ultracompact instrument made for maximum portability. Ocean Optics offers high performance at a low price using uncooled InGaAs array detectors that can also measure and report transmission, absorbance, reflectance, color, radiometer, solar measurement fluorescence, Raman spectroscopy, and radiometery. Spectral Evolution also has a field-portable radiometer with no moving optical parts.
Several manufacturers launched tools for dedicated applications this year. Real-Time Analyzers offers a tool that can determine fuel quality as well as chemical and physical properties of multiple diesel, gasoline, jet fuel, and so forth, using transmission. Thermo Fisher Scientific addresses routine analysis with transmission and reflection measurement capabilities. Shimadzu offers functional NIR (fNIR) for blood oxygen and other medically important analyses.
Several offerings in this category were aimed at original equipment manufacturers (OEMs). Stellarnet has an instrument for OEMs and sensing applications. Texas Instruments also addresses OEMs with the TI DLP technology that uses single-element InGaAs detectors. Si-Ware offers the most compact and lowest-cost FT-IR system available. Tiger Optics measures various gaseous components to parts-per-billion levels.
NMR and ESR
As seen last year, there are only a few vendors working with NMR (Table VII), and the key innovations are primarily aimed at the benchtop instrument market. The high-end market largely belongs to one major vendor (Bruker), but several companies (such as Bruker, Magritek, and Thermo Fisher Scientific) delivered small-frame instruments based on permanent magnets, now that advances in materials have reached the point where permanent magnets of adequate strength and uniformity are possible. The original evolution of this, exemplified by the PicoSpin products (now Thermo Fisher Scientific), involved moderately performing instruments designed to give only the simplest of answers. Competition is now driving improved specifications and higher field magnets with more sensitivity. Most vendors this year introduced a reaction monitoring application, where the specificity of NMR is harnessed to provide insights into reacting mixtures and industrial processes.
The long-range evolution of NMR will be limited only by the field strength of the magnets and the stability of the fields generated. Pulse sequences and two-dimensional transforms are already implemented on high-field devices, so improved magnets could bring these techniques onto the benchtop in the not too distant future.
Bruker’s Biospin offers benchtop systems with novel solutions (including a dedicated food analyzer) and dedicated software. Magritek also has a benchtop instrument without cryogens or needing to spin the sample. An instrument from Thermo Fisher Scientific requires only a 40-µL sample, and the instrument can be hand-carried.
Raman
We would argue, based on what we have seen preparing this review, that no other product line has shown a greater number and variety of tools coming into the market than Raman spectroscopy (Table VIII). There are two broad classes of tools: the large, benchtop instruments (such as those products launched by BaySpec, Renishaw, Thermo Fisher Scientific, and WITec) and the handhelds (such as those launched by BaySpec, BioTools, Metrohm, and Thermo Fisher Scientific).
CLICK TABLE TO ENLARGE
IF TABLE IS STILL TOO SMALL, CLICK ONCE MORE AND IT WILL ENLARGE FURTHER
The benchtop instruments stress spatial resolution (sub-1-µm), polarization, and high-speed imaging enabled by electron multiplying charge coupled devices (EMCCDs). These instruments are aimed at the materials sciences and research markets.
Meanwhile, the handheld market is being driven by the availability of small, lower-power consumption lasers, miniature monochromators, and polychromators and detectors (see the component section). Here the commercial role is materials identification, where vendors speak of penetration through glass and plastic containers, insensitivity to water (one bane of infrared), and answers consisting of identification rather than just spectra.
In both cases, a major competitive edge is claimed based on software. The ability to collect the data is similar-the manufacturers are all using similar components-so the differentiation comes in the user experience. Researchers who like to tinker can find open tool sets while a user seeking a simple answer (to a question such as, “Is the sample safe or dangerous?”) can get it. There is much debate over which laser works best, or whether a front-illuminated EMCCD is better than a rear-illuminated one, but most users will see the software and automation as key decision points.
Raman will continue to change rapidly, we feel, as it becomes embedded in both industrial processes and hyphenated research tools, such as rheometry–Raman. This trend toward ongoing change will be driven by further developments in the components and software tools driving them.
Articles in this issue
about 10 years ago
Distinguishing Structural Isomers: Mono- and Disubstituted Benzene Ringsabout 10 years ago
Ensuring Product Quality with Process Raman and FT-IR Spectroscopyabout 10 years ago
Vol 31 No 5 Spectroscopy May 2016 Regular Issue PDFAdvertisement
Related Content
Advertisement


Advertisement
Advertisement
Trending on Spectroscopy Online
1
The State of Spectroscopy Careers
2
Exploring Mars' Lost-Water Narrative Using Raman Spectroscopy and X-ray Fluorescence
3
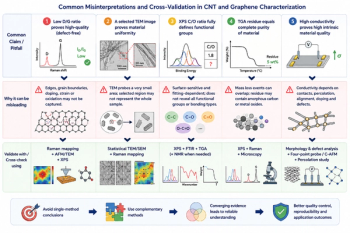
From Single-Technique Analysis to Multimodal Characterization: Recent Advances and Future Perspectives for Carbon Nanotubes and Graphene
4
Is Produced Water a Source of Lithium?
5