- Spectroscopy-10-01-2020
- Volume 35
- Issue 10
Whisky Analysis with Raman Spectroscopy in the Near-Infrared Spectral Range: Comparison of 785– and 1064–nm Excitation
We compare the advantages and disadvantages of each laser wavelength.
Raman spectroscopy in the near-infrared spectral range is commonly used in many application areas, including in the analysis of beverages, such as whisky. For this purpose, lasers with 785 or 1064 nm wavelength are very popular. In the studies presented here, we compare the two wavelengths in the context of whisky analysis and authentication. Our results reveal that both excitation wavelengths have benefits and drawbacks. For example, 1064 nm is capable of performing through-container measurements even in green glass bottles, which is not possible with 785 nm. On the other hand, the moderate fluorescence signal generated with 785 nm makes it possible to determine a variety of additional parameters including the type of cask in which the whisky was matured.
Raman spectroscopy is gaining ever increasing attention in the analysis of food products and especially of beverages such as spirits. Its capability to analyze samples through the wall of glass and polymer bottles is a particularly interesting feature (1–3). When valuable spirits (such as single malt Scotch whisky that was aged in casks for decades) need to be authenticated, analysis using methods that require sampling are not the first choice, because opening the bottle would mean a significant loss in value. Therefore, many techniques such as gas chromatography (GC), mass spectrometry (MS), Fourier-transform infrared (FT-IR) spectroscopy, X-ray fluorescence, and the recently developed nanoplasmonic tongue cannot be used despite their demonstrated capability for whisky authentication (4–11). As a result, Raman spectroscopy is a suitable alternative in this context.
The laser wavelength (λ) used in a Raman experiment is a crucial parameter, because it has a manifold impact. The Raman scattering cross section depends on λ-4, which means that a shorter wavelength results in a higher signal intensity. Moreover, this is further enhanced by the excellent quantum efficiency of commercially available detectors in the visible spectral range. On the other hand, owing to the higher photon energy, a shorter wavelength increases the probability certain species in the sample that will photodissociate and generate laser-induced fluorescence that could completely mask the desired Raman signal (12). Moreover, if the measurement needs to be done though the original sample container, the transmission properties of the bottle need to be considered as well. Figure 1a displays the UV-vis transmission spectrum of a typical whisky sample. It exhibits a strong and broad absorption band in the UV with a wing that lasts up to about 700 nm. The figure also shows the wavelengths of the typical lasers used in Raman spectroscopy instruments. It becomes clear that excitation at wavelengths shorter than ~700 nm results in significant levels of fluorescence as electronic transitions in certain molecules are excited resonantly. As will be shown later, even with a 785-nm laser the spectrum will contain moderate fluorescence signals. Figure 1a also shows a non-negligible absorption around 1064 nm, which is a common Raman wavelength as well. However, this absorption is not associated with electronic excitation. Instead, this band originates from vibrational overtone and combination bands (13) and hence its excitation does not result in laser-induced fluorescence signals.
Published data suggest that even an excitation wavelength of 830 nm results in noticeable fluorescence signatures (1). From the absorption spectrum in Figure 1a and the above discussion, a schematic energy level diagram can be developed, as shown in Figure 1b. The figure shows that wavelengths shorter than ~850 nm yield electronic excitation and subsequent fluorescence emission from the vibrational ground state of the excited electronic state. Photons at longer wavelengths (such as 1064 nm) cannot excite the molecules in the sample electronically; because of this, they cannot fluoresce. A detailed theoretical and mathematical account of the underlying scattering and fluorescence phenomena can be found in the literature (14,15).
There have been a number of Raman studies of whisky samples using a variety of laser wavelengths, mainly in the near-infrared spectral range. Because whisky commonly contains natural or artificial colorants (caramel color), the interference from fluorescence emission obscures the inherently weak Raman signal when lasers in the visible or ultraviolet are used. Because of this, an 830-nm diode laser was used for spatially offset Raman spectroscopy (SORS) in whisky bottles (1). They achieved high sensitivity detection of minor species, allowing the authentication of the whisky. The common 785-nm excitation was employed by Backhaus (16) and Kiefer and Cromwell (2). This work showed that data analysis by chemometrics and machine learning tools enable whisky classification. Vaskova’s team demonstrated methanol detection in whisky using 785-nm lasers while Goodacre’s team used 1064–nm lasers (3,17,18). However, a systematic comparison of different near-infrared Raman schemes to identify the most versatile approach for practical and potentially industrial whisky analysis has not been performed.
Experimental
This article aims to discuss the benefits and drawbacks of using Raman spectroscopy at different near-infrared excitation wavelengths. We applied Raman spectroscopy with 785– and 1064–nm excitation to 83 different whisky samples (mainly Scotch single malt whiskies, two German single malts, three Irish whiskies, one American whisky, and four blended Scotch whiskies). The measurements were carried out through the glass walls of the container bottles (see Figure 2) using Raman devices from Avantes (785 nm) and Anton Paar (785 and 1064 nm), both equipped with fiber probes. For each sample, 10 spectra were recorded. The details of the data analysis have been outlined in our previous work (2). In brief, principal component analysis (PCA) was used to classify the samples and partial least squares regression (PLSR) was employed for the quantitative analysis. The methods were implemented in Matlab using the functions “princomp“ and “plsregress.”
Results and Discussion
The first aspect investigated was the ability to perform the measurements through the container wall. Whiskies (as well as other beverages) are typically contained in glass bottles made of clear, green, or brown glass. Colored glass results from adding metal oxides such as iron oxide (pure and in combination with others) during the production process, and the metal ions yield a characteristic optical absorption spectrum. Similar to the phenomena discussed in the introduction (see Figure 1b), colored glass can fluoresce upon optical excitation. Previous experiments (1,3) have shown that 785 and 830 nm, respectively, excite significant levels of fluorescence inside green and brown glass. Moreover, due to the strong absorption inside the glass, not much of the laser light will reach the actual sample. Therefore, these wavelengths are not suitable for through-container analysis when a spirit is contained in colored glass bottles. On the other hand, 1064–nm radiation as well as the corresponding Raman signal is transmitted through green glass. Hence, 1064–nm Raman spectroscopy has wider applicability in this respect.
We note that basically all the sharp signatures in the Raman spectra of the whiskies (see Figure 3 for an example) can be assigned to the vibrational modes of ethanol. The assignment of the main peaks is summarized in Table I using a previous study (19) as a benchmark. The peak positions agree well within the limited spectral resolution of the instruments. The ethanol signatures can be used to quantify the amount of alcohol in the samples.
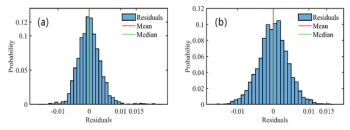
The second aspect studied was the capability to classify the samples. In previous work (2), it has been shown that PCA is suitable to determine the cask type a whisky was aged in. This can be a key in the authentication of whisky. An important feature in this classification, however, was the presence of moderate but characteristic fluorescence signals in the data. These fluorescence signals are not present in the Raman spectra recorded with the 1064–nm laser, as shown in Figure 3. As a consequence, feeding the 1064–nm spectra into the PCA algorithm did not result in a classification of the casks. The scores plots obtained from the data acquired with 785 and 1064 nm are displayed in Figures 4a and 4b, respectively. Note that only those data points associated with whiskies that could clearly be assigned to one cask type are shown. Whiskies that were matured in multiple casks (such as sherry and port) are not included for clarity. The plot in Figure 4a reveals that the excitation at 785 nm facilitates the distinction of the different cask types. On the other hand, the score plot of the Raman spectra acquired with the 1064–nm laser mainly provides information about the ethanol content. We note that the higher principal components in the 1064–nm data set were not meaningful because they essentially represent noise.
The potential to do a quantitative analysis was tested, examining the alcohol content. For this purpose, PLSR was used. Figure 5 shows the PLSR model employed to two components and resulted in strong accuracy for all data sets. The plot shows that the results obtained from the 1064–nm data set are slightly more accurate, because the scattering of the data points is reduced. The presence of the fluorescence background in the 785-nm spectra may be the reason for the observed behavior. Its impact can certainly be minimized by employing a baseline correction prior to the PLSR analysis. This was not done here because we wanted to keep the method as simple as possible and hence the raw data were evaluated.
In addition, previous experiments (3) have shown that 1064 nm excitation is well suited for detecting methanol in whisky. In addition to the points described above, the ability to determine the presence of methanol and artificial colorants was tested in terms of caramel color. The results of the entire comparison are summarized in Table II. The individual aspects have been graded with a plus (+) and minus (–) to allow a straightforward qualitative assessment for decision-making in a data or instrument procurement process
Conclusion
In conclusion, a detailed comparison of Raman spectroscopy with near-infrared lasers at 785 and 1064 nm revealed the particular advantages and disadvantages of detecting methanol in various whiskies. Both approaches demonstrate that they are capable of quantitative measurements such as for the determination of the ethanol or methanol content. Moreover, both can be applied through the wall of clear glass bottles. The 1064–nm wavelength can also measure through green glass, which is not possible with 785 nm. In the case of brown glass, both methods failed. The spectra recorded with 785 nm contain a moderate level of fluorescence signals, which turn out to carry important additional information. These signatures enhance the capability of Raman spectroscopy for authentication and a wider qualitative analysis, for example with respect to determining the cask type and the presence of artificial colorants. Overall, the combination of Raman and fluorescence signals can draw a detailed picture of a whisky and can help to identify adulterated or counterfeit products. For example, producing fake whisky may yield a fluid with very similar properties in terms of alcohol content, color, and taste using artificial colors and flavors. However, because the spectra are sensitive to the cask type and the aging period, they are very difficult to produce artificially. Therefore, Raman spectroscopy in the near-infrared is a powerful tool for the analysis of whisky. The increasing number of handheld, easy-to-use instruments on the market makes it likely that it will become the standard in the whisky industry in the
foreseeable future.
Acknowledgments
The authors would like to thank Avantes BV (Apeldoorn, The Netherlands) and Anton Paar Germany GmbH (Ostfildern-Scharnhausen, Germany) for the instrument loans.
References
- D.I. Ellis, R. Eccles, Y. Xu, J. Griffen, H. Muhamadali, P. Matousek, I. Goodall, and R. Goodacre, Sci. Rep. 7, 12082 (2017).
https://doi.org/10.1038/s41598-017-12263-0 . - J. Kiefer and A.L. Cromwell, Anal. Methods 9, 511–518 (2017).
- D.I. Ellis, H. Muhamadali, Y. Xu, R. Eccles, I. Goodall, and R. Goodacre, Analyst 144, 324–330 (2019).
- C.N. Rhodes, K. Heaton, I. Goodall, and P.A. Brereton, Food Chemistry 114, 697–701 (2009).
- A. Wanikawa, K. Hosoi, T. Kato, and K. Nakagawa, Flavour Fragr. J. 17, 207–211 (2002).
- R.I. Aylott and W.M. MacKenzie, J. Inst. Brew. 116, 215–229 (2010).
- J.S. Garcia, B.G. Vaz, Y.E. Corilo, C.F. Ramires, S.A. Saraiva, G.B. Sanvido, E.M. Schmidt, D.R. J. Maia, R.G. Cosso, J.J. Zacca, and M.N. Eberlin, Food Res. Int. 51, 98–106 (2013).
- A.C. McIntyre, M.L. Bilyk, A. Nordon, G. Colquhoun, and D. Littlejohn, Anal. Chim. Acta. 690, 228–233 (2011).
- P. Wisniewska, T. Dymerski, W. Wardencki, and J. Namiesnik, J. Sci. 95, 2159–2166 (2015).
- C.A. Shand, R. Wendler, L. Dawson, K. Yates, and H. Stephenson, Anal. Chim. Acta. 976, 14–24 (2017).
- G. Macias, J.R. Sperling, W.J. Peveler, G.A. Burley, S.L. Neale, and A.W. Clark, Nanoscale 11, 15216–15223 (2019).
- D. Wei, S. Chen, and Q. Liu, Appl. Spectr. Rev. 50, 387–406 (2015).
- J. Kiefer, N. Ebel, E. Schlücker, and A. Leipertz, Anal. Methods 2, 123–128 (2010).
- C.N. Banwell and E.M. McCash, Fundamentals of Molecular Spectroscopy, 4th ed. (McGraw Hill, London, 1994).
- H. Haken and H.C. Wolf, Molecular Physics and Elements of Quantum Chemistry (Springer, Heidelberg, 1995).
- A. Backhaus, P.C. Ashok, B.B. Praveen, K. Dholakia, and U. Seiffert, “Classifying scotch whisky from near-infrared Raman spectra with a radial basis function network with relevance learning,” presentation at the 20th European Symposium on Artificial Neural Networks, Computational Intelligence and Machine Learning, ESANN 2012, (2012), 411–416.
- H. Vašková and M. Tomeček, MATEC Web of Conferences 210, 02035 (2018).
- H. Vašková, Int. J. Biol. Biomed. Eng. 8, 27–34 (2014).
- J. Kiefer, S. Wagenfeld, and D. Kerle, Spectrochim. Acta A. 189, 57–65 (2018).
- K. Noack, J. Kiefer, and A. Leipertz, Chem. Phys. Chem. 11, 630–637 (2010).
Johannes Kiefer and Lynda Kiefer are with the University of Bremen in Bremen, Germany. Direct correspondence to:
Articles in this issue
Newsletter
Get essential updates on the latest spectroscopy technologies, regulatory standards, and best practices—subscribe today to Spectroscopy.


![Figure 3: Plots of lg[(F0-F)/F] vs. lg[Q] of ZNF191(243-368) by DNA.](https://cdn.sanity.io/images/0vv8moc6/spectroscopy/a1aa032a5c8b165ac1a84e997ece7c4311d5322d-620x432.png?w=350&fit=crop&auto=format)

