Publication
Article
Spectroscopy
Exploring the Potential of the Yb(III) (HE)4 Complex for Oncotherapy Using UV-vis Spectroscopy
Author(s):
In pH 7.4, the UV-vis spectra showed that ytterbium (III) could react with the hematoxylin (HE) compound to form a binary complex, and that the complex also could interact with herring sperm DNA. Through analysis of the molar ratio, hematoxylin to ytterbium is 4:1, and the Yb(HE)4 complex to DNA is 10:1. Meanwhile, by means of the thermodynamic study, the enthalpy driving force of the reaction of the Yb(III)(HE)4 complex with DNA is obtained. In fluorescence spectroscopy, the nontoxic 4S Green Plus nucleic acid dye was used as a probe to prove the mode of the Yb(III)(HE)4 complex interaction with DNA. In addition, the interaction between the Yb(III)(HE)4 complex and DNA was further determined by using the Scatchard method, which indicated that there is electrostatic interaction between Yb(III)(HE)4 and DNA, including intercalation. Therefore, it is expected that this rare earth complex may have good anti-tumor properties.
Cancer has been regarded as the leading threat to human health, causing one in eight deaths around the world (1,2). Because changes in oncogenes and tumor suppressor genes are events at the level of nucleic acid molecules, nucleic acid detection is extremely important in the diagnosis and treatment of cancer (3). With the development of life sciences, researchers have discovered that changes in oncogenes and tumor suppressor genes are events that occur at the nucleic acid molecular level. Therefore, the study of the structure and function of DNA is of great importance in the diagnosis and treatment of some cancers (4–6). The molecular structure of DNA, as well as its characteristics, are closely related to environmental factors, such as temperature and pH (7). When the environment changes, the sequence of DNA base pairs and the interaction between hydrogen bonds and the interaction force between the phosphate groups will change accordingly, including a change in the interaction between the complex molecules and the DNA.
Figure 1 shows the molecular structure of hematoxylin. Hematoxylin (HE) is a natural dye extracted from the dried branches of the tree, Haematoxylum campechianum, and is mixed with ether. HE is one of the most bioactive flavonoids in existence and possesses strong coordinating qualities (8). It is well known that flavonoids have a variety of biological effects in numerous mammalian cell systems such as antiviral, anti-allergic, anti-platelet, anti-inflammatory, and anti-tumor activities, and possibly even protective effects against chronic diseases (9,10). Because of the existence of a planar ring system, many polycyclic aromatic hydrocarbons and their derivatives can intercalate into DNA, thereby disrupting the normal function of cellular DNA, and some even exhibit anticancer activity. Studies in recent years have shown that HE has a significant inhibitory effect on gastric cancer (11). Therefore, the study of the binding between the HE complex and DNA is very useful for exploring the pharmacology of this complex and provides guidance for the design of new and more effective anticancer drugs.


FIGURE 1: Molecular structure of hematoxylin.

Rare earth metal elements have been called the vitamins of industry and have become a key resource for development in various countries. In recent years, rare earth elements have attracted more research attention because of their important pharmacological effects, especially the role of rare earth complexes in anticancer activity (12). Rare earth metals combine with small molecules to form complexes, which help reduce the toxicity of the earth metals and allows for further research on anticancer drugs (13).
In general, the majority of current assays used to study the binding of DNA to other complexes are mainly dependent on fluorescence spectroscopy (14), ultraviolet (UV) spectrophotometry (15), electrophoresis (16), liquid chromatography–mass spectrometry (LC–MS) (17), and electrochemical methods (18). Because the methods of ultraviolet–visible (UV-vis) spectroscopy and fluorescence spectroscopy are sensitive, fast, and simple, they are considered to be effective methods (19). In this work, the interaction between the Yb(III)(HE)4 complex and DNA was investigated systematically by UV-vis absorption, fluorescence spectroscopy, electrochemical methods, and viscosity methods, which provided an experimental basis for studying the thermodynamics relationship and the action mode between the Yb-complex and DNA. The study of these reaction mechanisms will provide some theoretical guidance for the development of efficient, safe, and stable anticancer drugs.
Experimental
Chemicals and Materials
Herring sperm DNA, YbCl3 ·6H2O, and acridine orange (AO) were obtained from the Sigma-Aldrich Corporation. HE was purchased from Regal Biology Technology Co, Ltd. 4S Green Plus nucleic acid was obtained from Sangon Biotechnology Co. Ltd. All other chemicals were of analytical grade and used without further purification. An ultra-pure Milli-Q water system was used as the water source.
Instrumentation
The absorption spectra were recorded using a U-3900H spectrophotometer (Hitachi Co. Ltd.)., and the fluorescence spectra were recorded by employing a F-7000 fluorescence photometer (Hitachi Co. Ltd.). Cyclic voltammetric measurements were conducted using a CHI 760E electrochemical system (CHI Co. Ltd.). Viscosity measurements were performed using a Cone and plate viscometer DVII +Pro (Brookfield Co. Ltd.). The measurement of the pH values was carried out with a FE20K pH-meter (Mettler-Toledo Co. Ltd.). In fluorescence, both excitation and emission bandwidths were set at 10 nm, λex= 490 nm.
The UV Spectrometric Absorption Spectra
In a series of 10 mL colorimetric tubes, a certain molar concentration of HE, Yb(III), DNA, HE-Yb(III), HE-DNA, Yb(III)-DNA, and Yb(III)-HE-DNA solution was added, respectively. The volume of the seven samples was set to 10 mL with PBS buffer solution (pH = 7.40), and solutions were adjusted, mixed, and allowed to stand for 10 min to measure the UV absorption spectrum of each sample.
The ratio of YB(III) to HE and the ratio of YB-HE complex to hsDNA were determined using spectrophotometric titration. The concentration of the fixed substrate also gradually increases the concentration of the ligand substance. Each injection volume is 10 μL, the volume effect is very small and can be ignored.
The Fluorescence Spectra
To a series of 10 mL colorimetric tubes, certain molar volume of 4S Green Plus or HE-Yb(III) solution was added, and solutions were diluted to the 10 mL mark with pH 7.40 PBS buffer solution. Then, 4S Green Plus (2.5 × 10⁻⁵ mol/L, 3.5 mL) solution in a 1 cm pathlength cuvette was titrated by adding successively 10 μL of hsDNA, and the volume effect was so small that it could be ignored. After each addition, the fluorescence was recorded. The same process as above was carried out to the 4S Green Plus and DNA sample, which was added with 10 μL of HE-Yb (III) solution in succession. The excitation wavelength of 4S Green Plus is 490 nm, the scanning range is 450–700 nm, the voltage is 400 V, and the slit width was set to 10 nm.
Electrochemical Method
The required working electrode is pretreated. The working electrode is polished with Al2O3 powder, and then it washed with anhydrous ethanol and ultrapure water for 2–3 times, respectively. Preparing a certain concentration of HE-Yb(III) solution with a difference concentration of DNA, the cyclic voltammetry curve is obtained by an electrochemical workstation, the scanning range is -0.5–0.5 V, and the scanning speed is 0.05 V/s.
Viscosity Measurements
Viscosity measurements were performed using a viscometer, which was immersed in a thermostated water bath. Different amounts of Yb(III)(HE)4 complex were added into the viscometer while keeping the concentration of DNA constant. The flow times of the samples were repeatedly measured three times with an accuracy of ± 0.20 s by a digital stopwatch. The value of relative viscosity (ƞ/ƞ0) was plotted against Yb(III)(HE)4 complex, where ƞ and ƞ0 are the viscosity of DNA in the presence and absence of the complex, respectively.
Results and Discussion
UV-vis Spectroscopic Characteristics
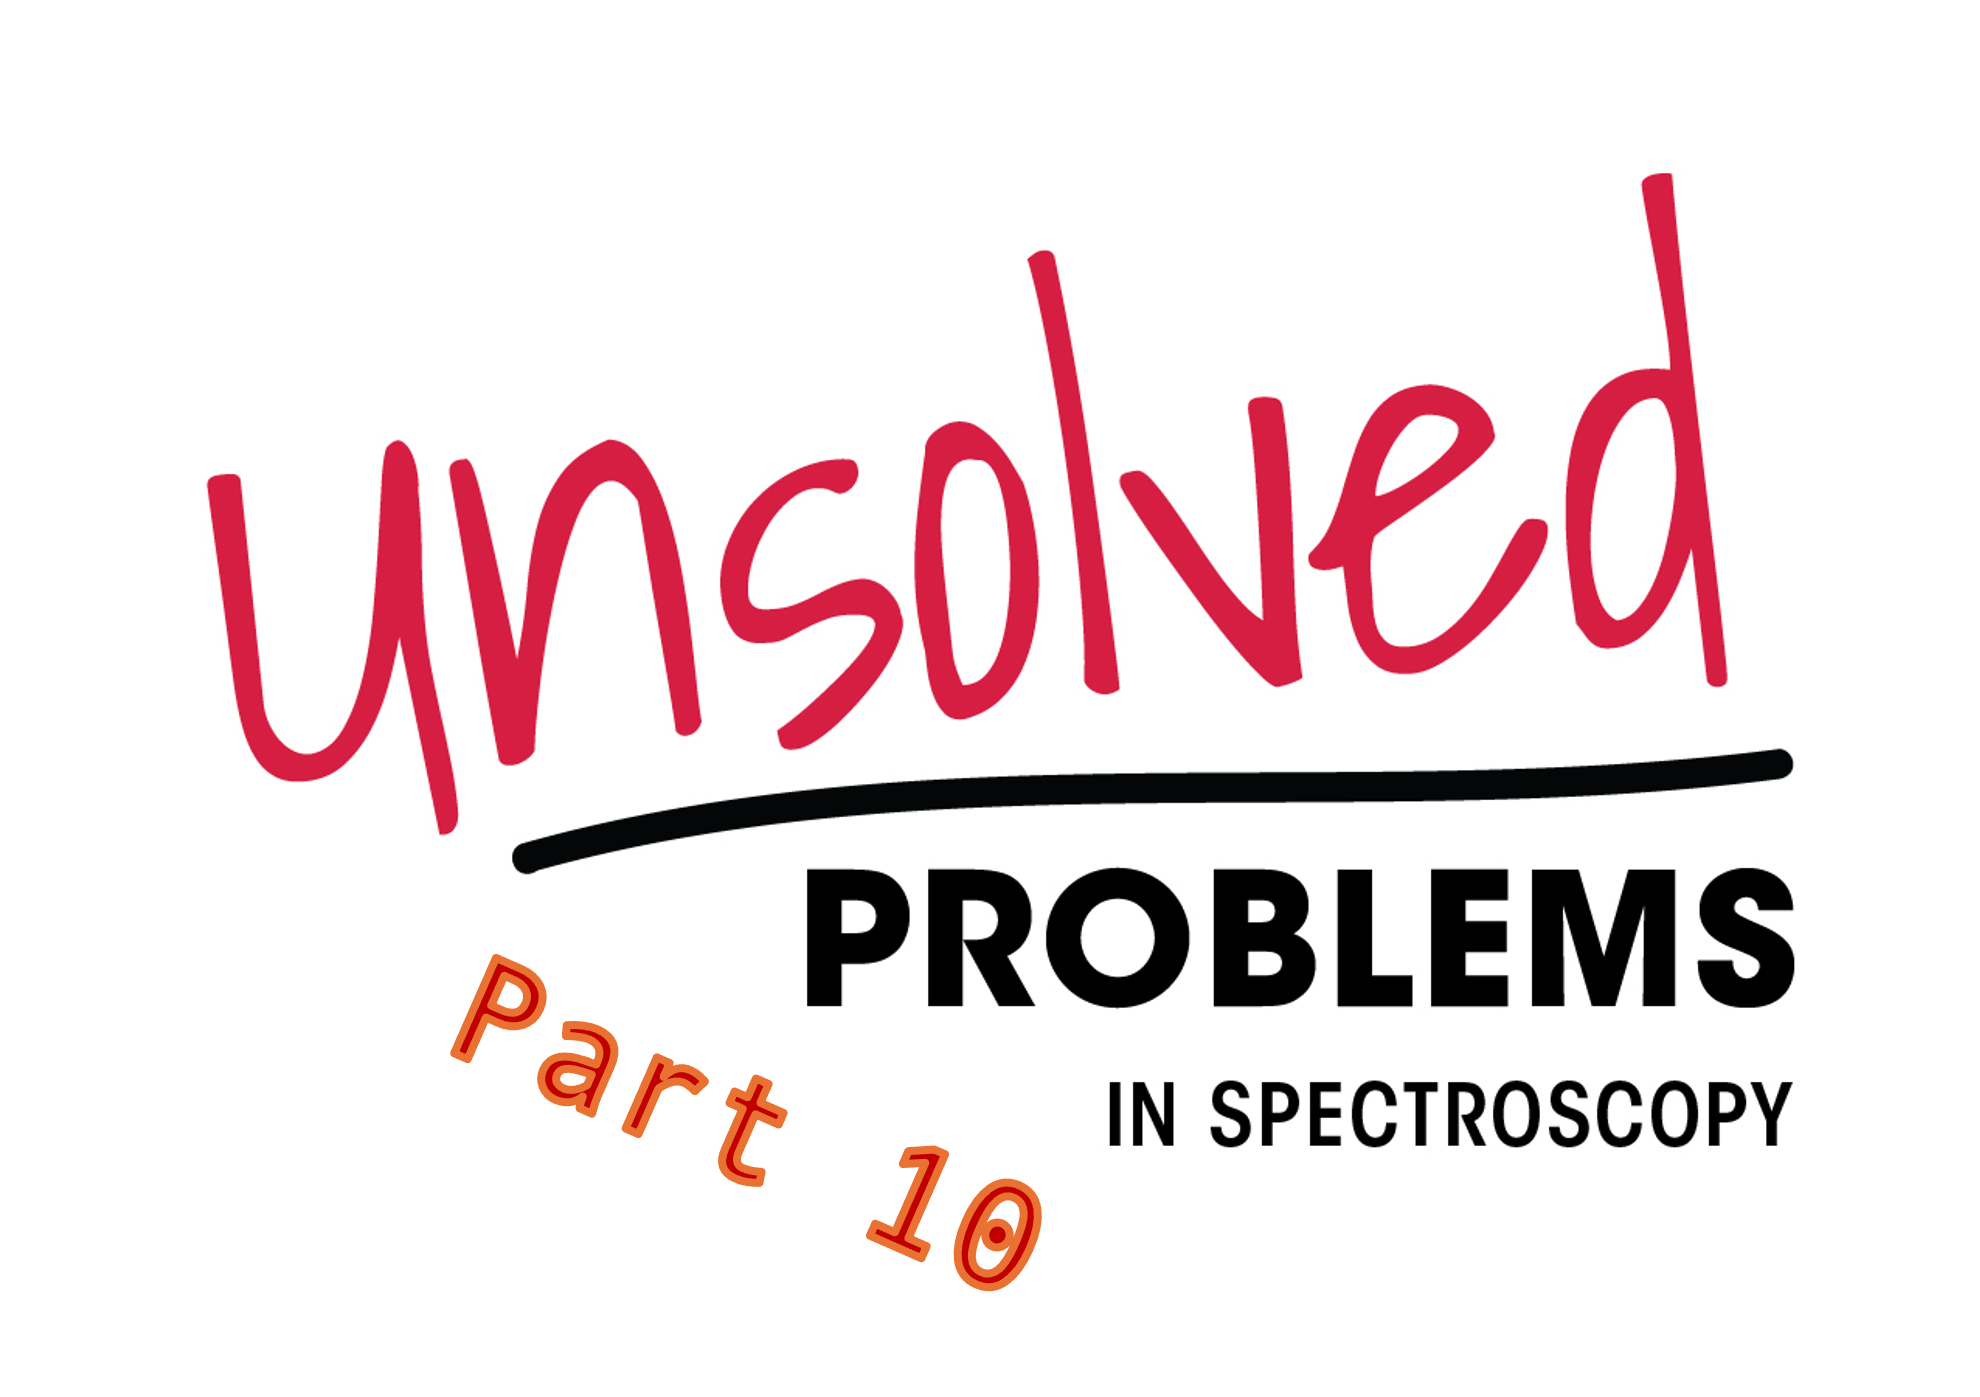
The UV-vis absorption spectra of Yb(III), HE, DNA, and its mixture were measured in the wavelength range of 350 to 800 nm at room temperature. Figure 2 exhibited that the samples in the absence of HE can only cause negligible response in the specified wavelength range (curve e, f, and g), and when only HE is present in the sample (curve c), a significant absorption peak can be observed. Upon adding DNA to the sample containing HE (curve d), a significant signal reduction occurs because of the combination of DNA and HE. However, adding Yb(III) to the HE sample markedly increases the absorption intensity of HE at 558 nm (curve b), and we observe that curve b has a 3 nm blue shift compared to curve d, which indicated the formation of a complex between Yb(III) and HE. After mixing Yb(III)-HE complex and DNA, the UV absorption intensity increases as shown in curve a, while the weak UV absorption of the DNA alone is shown in curve f, which fully indicates that the Yb(III)-HE complex reacts with DNA.

.")
FIGURE 2: Absorption spectra of the samples; CHE = 2.5 x 10⁻⁵ mol/L; CYb3+ = 2 x 10⁻⁴ mol/L (10 μL per scan, 1~20: 0~190 μL).
Determination of the Binding Ratio of HE and Yb(III)
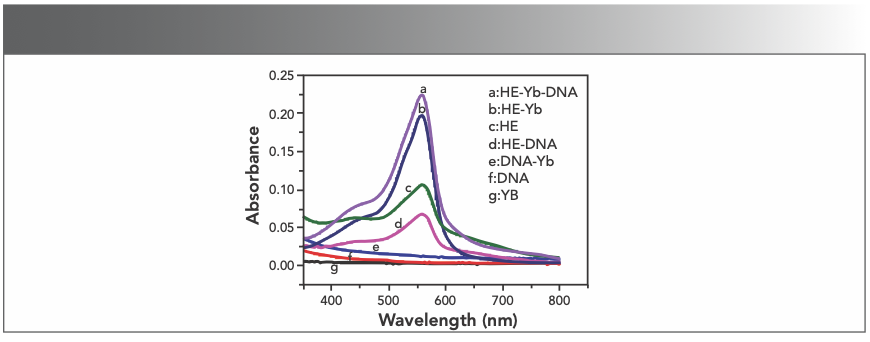
Absorption spectra were obtained by titrating the HE solution with the Yb(III) solution. The results presented in Figure 3a indicate that the peak absorption intensity at 558 nm of the solution gradually increases with the successively microscale addition of rare earth Yb(III) ions, which indicates that HE reacts with Yb(III) to form a new complex, verified because the absorbance of only the Yb(III) ions solution was nonexistent at about 558 nm.
To obtain the stoichiometry of the compound, we used the mole ratio method. As shown in Figure 3b, it could be concluded that the molar ratio of HE to Yb(III) is 4:1. According to the Beer-Lambert law: A = εbc. The ε value of the Yb(III)(HE)4 complex is 3.49 x 10⁴ L/mol·cm.

 Absorption spectra of HE in different concentrations of Yb(III); (b) mole ratio plots of Yb(III) HE4; CHE = 2.5 × 10⁻⁵ mol/L (3.5 mL); CYb3+ = 2 × 10⁻⁴ mol/L (10 μL per scan, 1~20: 0~190 μL).")
FIGURE 3: (a) Absorption spectra of HE in different concentrations of Yb(III); (b) mole ratio plots of Yb(III) HE4; CHE = 2.5 × 10⁻⁵ mol/L (3.5 mL); CYb3+ = 2 × 10⁻⁴ mol/L (10 μL per scan, 1~20: 0~190 μL).
Absorption Spectra of Yb(III)(HE) and hsDNA
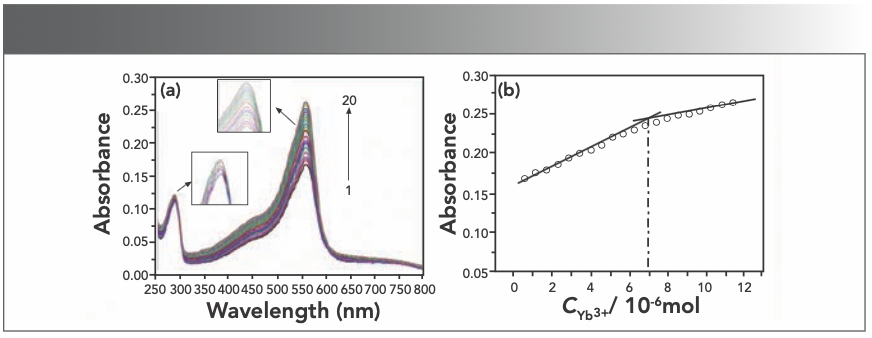
UV-vis spectroscopy is an effective and convenient method to study the interaction between small molecules and nucleic acid. The interaction of Yb(III)(HE)4 complex with hsDNA has been studied with UV spectroscopy to investigate the possible binding mode and calculate the binding constants. Each time 10 μL of 2 × 10⁻⁵ M hsDNA was added to the Yb(III)(HE)4 complex solution, the UV-vis spectrum of the solution was recorded. As shown in Figure 4a, the absorption intensity of Yb(III)(HE)4-DNA solution gradually increases with an increase of the amount of DNA. This result indicates that Yb(III)(HE)4 can bind and react with hsDNA.

 Absorption spectra of Yb(III)(HE)4 in different concentrations of DNA; (b) mole ratio plots of Yb(III) HE4–DNA; CYb(III) HE4 = 6.2 × 10⁻⁶ mol/L CDNA = 2 × 10⁻⁵ mol/L 1~21:0~200 μL.")
FIGURE 4: (a) Absorption spectra of Yb(III)(HE)4 in different concentrations of DNA; (b) mole ratio plots of Yb(III) HE4–DNA; CYb(III) HE4 = 6.2 × 10⁻⁶ mol/L CDNA = 2 × 10⁻⁵ mol/L 1~21:0~200 μL.
The intensity of the absorption peak was used to determine the binding ratio at 558 nm. As seen from Figure 4b, the mole ratio of Yb(III)(HE)4 complex to DNA is 10:1. According to the Beer-Lambert law: A = εbc (b = 1 cm), The molar absorption coefficient ε of Yb(III)(HE)4–DNA is 2.73 × 10⁵ L/mol·cm.
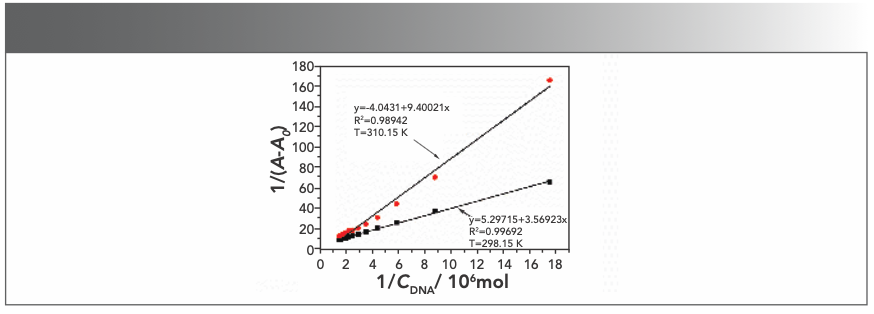
Thermodynamics Study by the Double-Reciprocal Method
To investigate the thermodynamic result of the interaction between the Yb(III)(HE)4 complex and DNA, ultraviolet-visible spectroscopy was generally used. The UV absorption spectrum of the Yb(III)(HE)4 complex was determined when the hsDNA solution was successively added at the temperatures of 298.15 K and 310.15 K, respectively. The following double-reciprocal equation was employed (20):


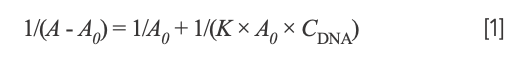
where A0 and A are the absorbance of the Yb(III)(HE)4 complex in the absence and presence of DNA, respectively. K is the binding constant between Yb(III)(HE)4 complex and DNA, CDNA is the concentration of DNA. Thus, the double reciprocal plot of 1/(A-A0) and 1/CDNA was obtained (Figure 5), then K was obtained from the ratio of the intercept to the slope. The values of K at two temperatures (298.15 K, 310.15 K) were demonstrated: Kθ310.15K = 4.30 × 10⁵ L·/mol; Kθ298.15K = 1.48 × 10⁶ L·/mol.

(HE)4 DNA system; CYb(III)(HE)4= 6.2 × 10⁻⁶ mol/L; CDNA = 2 × 10⁻⁵ mol/L (10 μL per scan).")
FIGURE 5: Double reciprocal plot of Yb(III)(HE)4 DNA system; CYb(III)(HE)4= 6.2 × 10⁻⁶ mol/L; CDNA = 2 × 10⁻⁵ mol/L (10 μL per scan).
If temperature changes slightly, the enthalpy change (ΔrHm) could be considered to be a constant. Then, the value of ΔrHmθ and entropy change (ΔrSmθ) can be determined from the van’t Hoff equation:

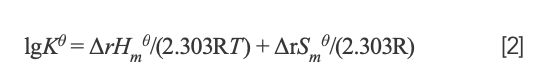

where K and R represent the binding constant and gas constant, respectively. By calculation, ΔrHmθ = -7.52 × 10⁴ J/mol and ΔrSmθ = -134.70 J/mol·K. The free energy change (ΔrGmθ) was estimated from the following relationship:

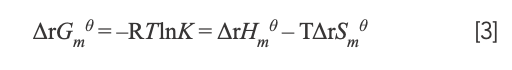

with the value of ΔrGmθ being ΔrGmθ298.15K = –3.52 × 10⁴ J/mol; ΔrGmθ310.15K = -3.34 × 10⁴ J/mol; and ΔrGmθ < 0. Therefore, the interaction between Yb(III)(HE)4 and DNA could occur spontaneously. Because ΔrSmθ < 0 and ΔrHmθ < 0—it was speculated that the reaction was an enthalpy-driven reaction.
Fluorescent Probes to Explore Interaction of Yb(III)(HE)4 and DNA
Nowadays, fluorescent probe technology can be used for studying the interaction between nucleic acids and complexes. After the interaction of small molecules and DNA, the fluorescence spectrum will show energy transfer. From this phenomenon, a lot of useful information can be obtained (21). Among these, 4S Green Plus nucleic acid dye is a nontoxic and noncarcinogenic substance. The interaction between 4S Green Plus and DNA is embedded in the DNA sequence. The dye plays an important role in studying the interaction mode between functional molecules and DNA. When the nucleic acid dye is mixed with hsDNA, the fluorescence spectrum can be recorded. Figure 6a shows that the fluorescence intensity at 520 nm also increased after the hsDNA solution was added to 4S Green Plus, which indicated that the nucleic acid probes had inserted into the hsDNA.
 Emission spectra of 4S Green Plus in different concentration of hsDNA; CDNA = 2 × 10⁻⁵ mol/L (10 μL per scan) 1~18:0~170 μL; (b) emission spectra of DNA–4S Green Plus admixture in different concentration of Yb(III) HE4 complex; CYb(III)HE4= 1× 10⁻⁵ mol/L 1~17:0~160 μL.")
FIGURE 6: (a) Emission spectra of 4S Green Plus in different concentration of hsDNA; CDNA = 2 × 10⁻⁵ mol/L (10 μL per scan) 1~18:0~170 μL; (b) emission spectra of DNA–4S Green Plus admixture in different concentration of Yb(III) HE4 complex; CYb(III)HE4= 1× 10⁻⁵ mol/L 1~17:0~160 μL.

Although DNA has a natural fluorescence, the intensity is so weak that it is limited to study the interaction between drug molecules and DNA. We usually use fluorescent probes to explore its mechanism. There are mature nucleic acid probes that were used to carry out the research, such as ethidium bromide, gold view, and syber green I. These probes are nonspecific probes that intercalate deoxyribonucleic acid molecules. If the Yb(III)(HE)4 complex has the same binding mode with DNA as well as 4S Green Plus-DNA, then there is a competitive mode between 4S Green Plus and the Yb(III)(HE)4 complex with DNA, and as a result, the intensity of the fluorescence spectrum would be reduced. The decrease of fluorescence intensity in Figure 6b indicated that the Yb(III)(HE)4 complex could squeeze off 4S Green Plus form DNA. This result indicates that the binding mode between the Yb(III) (HE)4 complex and hsDNA is intercalation.
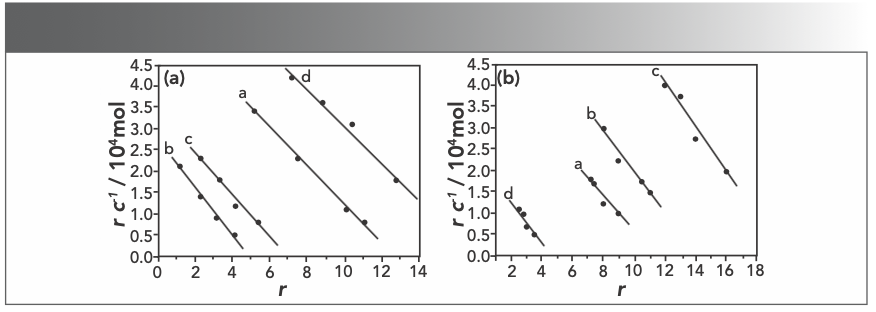
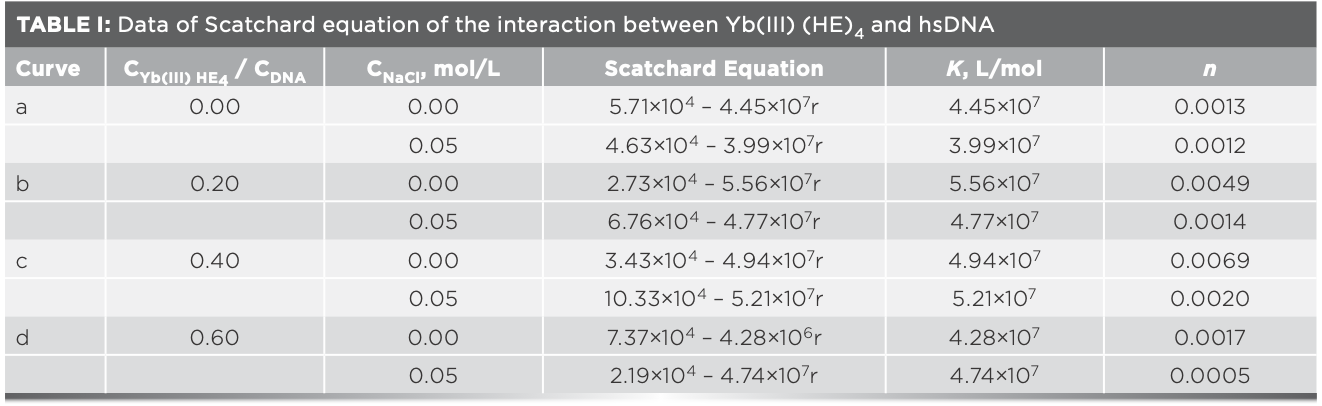
Scatchard Method
Studying the binding mode between Yb(III)(HE)4 complex and hsDNA is crucial for understanding the mechanism of action of drug molecules. Thus, an acridine orange (AO) probe was used to study the interaction of Yb(III)(HE)4 complex and DNA according to the Scatchard equation (22). The Scatchard equation expresses the binding of AO–DNA in the presence of a Yb(III)(HE)4 complex:

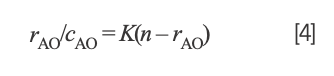

where rAO refers to the molecular amount of bound AO to total nucleotide concentration, cAO is the concentrations of free AO, n is the number of binding sites of DNA, and K is the intrinsic binding constant of AO–DNA.
There are different concentrations of the Yb(III)(HE)4 complex (Rt = Yb(III)(HE)4/ cDNA; Rt = 0, 0.2, 0.4, 0.6, respectively). When a drug binds to DNA by intercalation mode, the K value in the Scatchard plot would change but the n value would not. When a drug binds to DNA by non-intercalation mode, the n value would decrease but the K value would not change, when a drug binds to DNA by both intercalation and non-intercalation mode, both K and n value would change (23).
Figure 7a and 7b display Scatchard plot charts that show the absence of sodium chloride (NaCl) and the presence of NaCl. According to the Scatchard equation, the values of n and K were listed in Table I. The strong electrolyte sodium chloride (cNaCl = 5.00 × 10⁻³ mol/L) was used in Scatchard studies to test if there was electrostatic binding between Yb(III)(HE)4 complex and DNA (24). As seen in Figures 7a and 7b, the values of both n and K changed when increasing Rt value. It suggests that the interaction sites of Yb(III)(HE)4 and AO are not identical, when a binding mode mixed between DNA and the complex. As shown in Table I, the values of n in the present of NaCl are basically lower than those in the absence of NaCl, it suggests that there are also electrostatic binding mode between the Yb(III)(HE)4 and hsDNA.

HE4–DNA system in different concentrations of AO (a) without NaCl or (b) with NaCl; CDNA = 2 × 10⁻⁶ mol/L; CAO = 4 × 10⁻⁵ mol/L (10 μL); Rt = CYb(III) HE4 / CDNA; Rt = a: 0.0, b: 0.2, c: 0.4, d: 0.6.")
FIGURE 7: Scatchard plots of Yb(III)HE4–DNA system in different concentrations of AO (a) without NaCl or (b) with NaCl; CDNA = 2 × 10⁻⁶ mol/L; CAO = 4 × 10⁻⁵ mol/L (10 μL); Rt = CYb(III) HE4 / CDNA; Rt = a: 0.0, b: 0.2, c: 0.4, d: 0.6.


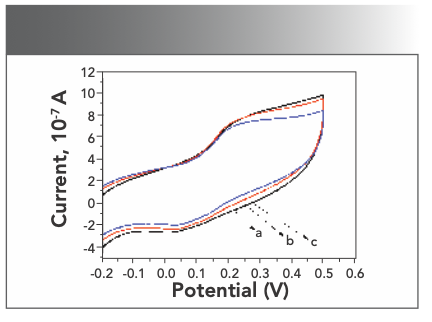
Electrochemical Method
Electrochemical method can also provide good information in studying the interaction between DNA and other molecules. The internal base pairs of denatured DNA can undergo significant redox reactions and enhance electrical signal (25). When cyclic voltammetry was used to study the mode of action of pharmaceutical molecule and DNA, it was considered that the positive shift of the peak potential was the intercalation binding, while the negative shift of the peak potential was the electrostatic combination (26). Scanning Yb(III)(HE)4 complex solution in the presence of different concentrations of DNA with a working electrode (gold electrode) at a scan rate of 0.05 V/s in the range of −0.5V to + 0.5 V. Figure 8 shows the whole peak moved up and the current increased. This experiment result proved that the Yb(III)(HE)4 complex binded to DNA by an intercalation form.

HE4; CYb(III)- HE4= 6.2 × 10⁻⁶ mol/L a: CDNA = 0 mol/L, b: 2 × 10⁻⁷ mol/L, c: 6 × 10⁻⁷ mol/L.")
FIGURE 8: Effects of cyclic voltammograms of DNA on Yb(III)HE4; CYb(III)- HE4= 6.2 × 10⁻⁶ mol/L a: CDNA = 0 mol/L, b: 2 × 10⁻⁷ mol/L, c: 6 × 10⁻⁷ mol/L.
Viscosity Method
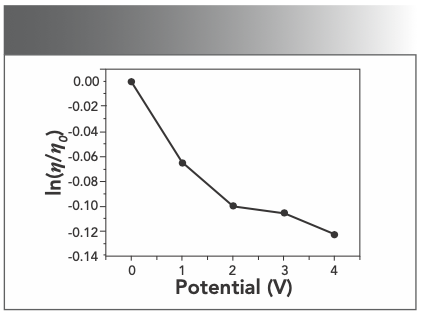
Optical photophysical probe is necessary but not a sufficient condition for the judgment of binding mode, whereas hydrodynamic measurements is sensitive to the length change (27,28), it is regarded as the most critical tests of a binding model in solution. Thus, to further clarify the interaction between Yb(III)(HE)4 complex and DNA, viscosity measurements were performed. A classical intercalation model is known to cause a significant increase in the viscosity of the DNA solution because of the length of the DNA helix being increased. In contrast, a partial or non-classical intercalation mode could bend the DNA helix and reduce its effective length. Hence, non-intercalation binding causes no obvious increase in the viscosity of a DNA solution (29). As illustrated in Figure 9, the relative viscosity of DNA steadily decreases with the addition of Yb(III)(HE)4 complex. The reason is related to Yb(III)(HE)4 being partially inserted into the DNA base pairs and the DNA secondary structure was changed, which decreased its effective length. Such behavior further suggested that an intercalation binding should be the interaction mode of the Yb(III)(HE)4 complex with hsDNA.


FIGURE 9: Variation of the relative viscosity of DNA; CDNA = 2 × 10⁻⁶ mol/L.
Conclusion
The interaction between Yb(III)(HE)4 complex and hsDNA has been studied by spectral analysis, cyclic voltammetry, and the viscosity method. The findings demonstrated that the binding mode between Yb(III)(HE)4 complex and DNA are intercalation binding and electrostatic binding. And the complexation ratio of HE and Yb(III) was determined to be 4:1 by the molar ratio method. The complexation ratio between the Yb(III)(HE)4 complex and DNA was 10:1. The main driving force between Yb(III)(HE)4 complex and DNA is enthalpy driven. These data provided important biophysical information related to the structure–activity relationship, which helps understand the nature of the complex binding to DNA and provides references for the development of new anticancer drugs.
Acknowledgments
This work was supported by National Natural Science Foundation of China (NSFC) (Grant No: 21565015 and 21663014), the Foundation of Jiangxi Educational Committee (GJJ150363), the State Key Laboratory of Chemical Biosensing & Chemometrics (Z2015022), and Key Laboratory of Functional Small organic molecule (KLFS-KF-201916).
References
(1) F. Bray, J. Ferlay, I. Soerjomataram, R.L. Siegel, L.A. Torre, and A. Jemal, CA: Cancer J. Clin. 68, 394–424 (2018).
(2) J. Salami and C.M. Crews, Science 355, 1163 (2017).
(3) J. Nesvet, G. Rizzi, and S.X. Wang, Biosens. Bioelectron. 124–125, 136–142 (2019).
(4) J. Czapla-Masztafiak, J.J. Nogueira, E. Lipiec, W.M. Kwiatek, B.R. Wood, G.B. Deacon, Y. Kayser, D.L.A. Fernandes, M.V Pavliuk, J. Szlachetko, L. González, and J. Sá, J. Phys. Chem. Lett. 8, 805–811 (2017).
(5) S. Lin, L. Lu, T.-S. Kang, J.-L. Mergny, C.-H. Leung, and D.-L. Ma, Anal. Chem. 88, 10290–10295 (2016).
(6) H. Li, Y. Tang, S. Lei, Z. You, T. Yang, and S. Wang, J. Appl. Spectrosc. 85, 791–799 (2018).
(7) T. Lindahl, Nature 362, 709–715 (1993).
(8) N. Nasirizadeh and H.R. Zare, Talanta 80, 656–663 (2009).
(9) J. Kang, L. Zhuo, X. Lu, H. Liu, M. Zhang, and H. Wu, J. Inorg. Biochem. 98, 79–86 (2004).
(10) H.R. Zare and N. Nasirizadeh, Sens. Actuators B Chem. 143, 666–672 (2010).
(11) A. Kamal, K. Sreekanth, P. Praveen Kumar, N. Shankaraiah, G. Balakishan, M. Janaki Ramaiah, S.N.C.V.L. Pushpavalli, P. Ray, and M.P. Bhadra, Eur. J. Med. Chem. 45, 2173–2181 (2010).
(12) K. Zheng, Z. Liu, Y. Jiang, P. Guo, H. Li, C. Zeng, S.W. Ng, and S. Zhong, Dalton Trans. 47, 17432–17440 (2018).
(13) K. Zheng, Z. Liu, Y. Huang, F. Chen, C. Zeng, S. Zhong, and S.W. Ng, Sens. Actuators B Chem. 257, 705–713 (2018).
(14) H. Zhao, Y. Zhao, X. Si, J. Li, Y. Duan, W. Jiang, C. Liu, J. You, Z. Li, and Q. Shen, Spectroscopy 35, 44–50 (2020)
(15) A. Mazzoli, A. Spalletti, B. Carlotti, C. Emiliani, C.G. Fortuna, L. Urbanelli, L. Tarpani, and R. Germani, J. Phys. Chem. B. 119, 1483–1495 (2015).
(16) F. Araya, G. Huchet, I. McGroarty, G.G. Skellern, and R.D. Waigh, Methods 42, 141–149 (2007).
(17)J. Guo, P.W. Villalta, and R.J. Turesky, Spectroscopy 33, 8–16 (2020).
(18) Y. Matsumoto, N. Terui, and S. Tanaka, Environ. Sci. Technol. 40, 4240–4244 (2006).
(19) J. Zhu, L. Chen, Y. Dong, J. Li, and X. Liu, Spectrochim. Acta Part A Mol. Biomol. Spectrosc. 124, 78–83 (2014).
(20) H. Ojha, B.M. Murari, S. Anand, M.I. Hassan, F. Ahmad, and N.K. Chaudhury, Chem. Pharm. Bull. 57, 481–486 (2009).
(21) S. Bi, C. Qiao, D. Song, Y. Tian, D. Gao, Y. Sun, and H. Zhang, Sens. Actuators B Chem. 119, 199–208 (2006).
(22) Y.-J. Hu, Y. Liu, and X.-H. Xiao, Biomacromolecules 10, 517–521 (2009).
(23) J.-B. Lepecq and C. Paoletti, J. Mol. Biol. 27, 87–106 (1967).
(24) S. Tabassum, S. Parveen, and F. Arjmand, Acta Biomater 1, 677–689 (2005).
(25) Y. Xie, S. Wang, Z. Zhang, and D. Pang, J. Phys. Chem. B. 112, 9864–9868 (2008).
(26) M.T. Carter, M. Rodriguez, and A.J. Bard, J. Am. Chem. Soc. 111, 8901–8911 (1989).
(27) M. Monteserín, H.D. Burrows, A.J.M. Valente, R. Mallavia, R.E. Di Paolo, A.L. Maçanita, and M.J. Tapia, J. Phys. Chem. B. 113, 1294–1302 (2009).
(28) S. Pan, D. Ahirwal, D.A. Nguyen, T. Sridhar, P. Sunthar, and J.R. Prakash, Macromolecules 47, 7548–7560 (2014).
(29) Z. Zhang and X. Dong, BioMetals 22, 283–288 (2009).
Mingbin Liu, Suqin Wang, Jiamei Pu, Zhuzhi Zhang, Weihua Zhao, Lin Cao, and Hongbo Li are with the Key Laboratory of Functional Small Organic Molecules in the College of Chemistry and Chemical Engineering at Jiangxi Normal University in Nanchang, China. Direct correspondence to: lihongbo112@126.com.


 (HE)4 Complex for Oncotherapy Using UV-vis Spectroscopy")


Newsletter
Get essential updates on the latest spectroscopy technologies, regulatory standards, and best practices—subscribe today to Spectroscopy.