Article
Special Issues
Spectroscopy Supplements
A Reproducible Online 2D Reversed Phase-Reversed Phase High-Low pH Method for Qualitative and Quantitative Proteomics
The authors present a novel method for analyzing and characterizing complex proteomic samples using multidimensional liquid chromatography with an emphasis on the reproducibility of results generated in different laboratories.
As proteomic analyses move from biomarker discovery toward clinical applications, reproducibility and robustness become increasingly important. Here we present a novel method for analyzing and characterizing complex proteomic samples utilizing multidimensional liquid chromatography, with an emphasis on the reproducibility of results generated in different laboratories.
A major goal in proteomics today is to improve reproducibility, in terms of technical replication on the same instrument as well as duplication of results between laboratories. To identify proteins at lower concentrations in a proteome, multidimensional separations have been used previously at both the protein and the peptide level. Two-dimensional (2D) chromatography of peptides traditionally has been performed with strong cation exchange followed by reversed phase (1) due to the orthogonal nature of the separation mechanisms of these techniques. The major disadvantage of this approach is that peptides often are split across first dimension fractions, because strong cation exchange generally is not a high-resolution separation technique for peptides.
Changing the pH of the mobile phase has been shown to change the selectivity of a peptide separation (2). A reversed phase–reversed phase method has been developed that utilizes pH 10 in the first dimension followed by pH 2.4 in the second dimension with online dilution of the eluent from the first dimension before trapping onto the second-dimension column. In this work, this method was used in two separate laboratories to analyze the same sample to test the reproducibility of identifying and quantifying proteins with this system.
Experimental
A nanoACQUITY UPLC system (Waters, Milford, Massachusetts) with 2D technology was employed to perform separations in this study. The first dimension column was a 5 cm x 300 µm column packed with 5-µm X Bridge C18 (Waters), with a 2 µL/min flow rate. The mobile phase for the first dimension was made up of 20 mM ammonium formate (pH 10) in water (A) and acetonitrile (B). A 20 mm x 180 µm column packed with 5-µm Symmetry C18 (Waters) was used to trap peptides between the two dimensions. Fractions were eluted in steps from the first dimension and were mixed in a 1:10 ratio with 20 µL/min, 0.1% formic acid in water before the trap column. This effectively reduced the pH and organic concentration of the first-dimension analytes, promoting their retention on the trap column. The mobile phase for the second dimension was made up of 0.1% formic acid in water (A) and 0.1% formic acid in acetonitrile (B). A 150 mm x 75 µm analytical column packed with 1.7-µm bridged-ethyl hybrid (BEH) C18 (Waters) was used as the second-dimension column with a 90-min 5–40% B gradient at 300 nL/min.
A Synapt HDMS system (Waters) was used to detect peptides as they were eluted from the second-dimension nanoLC column. Electrospray ionization was performed with an uncoated pulled fused-silica emitter (New Objective, Woburn, Massachusetts) using a potential of 3.0 kV applied. Alternating scans were used to detect precursor ions and then fragment ions. The masses of the precursor and fragment ions were detected with 0.8-s MS and MSE scans. Mass spectrometry data were analyzed with ProteinLynx Global Server (PLGS) software version 2.3 (Waters) with IdentityE Informatics.
Results and Discussion
The results from the analysis of a tryptically digested whole cell lysate of E. coli by high–low pH reversed phase–reversed phase can be seen in Figure 1. Five discontinuous steps of increasing organic concentration (11.1, 14.5, 17.4, 20.8, and 45%) were used in the first dimension. As shown in the figure, there was a slight shift toward later retention time with each increasing step. However, a small increase in acetonitrile percentage in the first dimension (3% between the second and third steps) yielded peptides that were eluted throughout a 60-min retention window in the second dimension, illustrating the orthogonality of the two dimensions. The acetonitrile steps in the first dimension were optimized such that each second-dimension fraction contained an equal amount of peptides. The loading of the 2D experiment was five times that of a typical 1D experiment (2.5 µg versus 0.5 µg) to ensure that each second-dimension separation was optimally loaded, thus identifying the highest number of proteins.

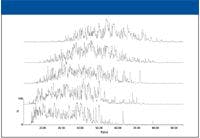
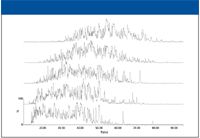
Figure 1: Chromatograms showing the separation of E. coli with 2D reversed phaseâreversed phase. First-dimension fractions increase from bottom to top.
While peptides were eluted from the second-dimension column, alternating scans of low and elevated collision energy were used to detect precursor and fragment ion masses, respectively. This method of mass spectral data acquisition simultaneously measures the peptide precursor masses for label-free quantitation and the fragment ions across the chromatographic profile of each peak for identification. Data from each fraction were merged back into one analysis before identification and quantitation to ensure that all of the peptides from the same protein were identified and quantified at one time. Due to the high resolution of reversed-phase separation of peptides, very few peptides were found to have split between fractions (less than 15%). However, for those peptides that did split, a summing algorithm was used during the merge process. To accomplish this, any precursor mass within ±7 ppm and ±0.5 min in retention time that was found in consecutive fractions was considered identical and their area and fragment ions were combined.
After the data were merged, proteins were identified by an algorithm that combines accurate precursor and product ion matches (10 and 20 ppm, respectively) with 12 physiochemical properties to score identifications and minimize false positive matches. For each database search, a randomized version of the E. coli database was appended onto the database and a 4% false positive rate was set at the protein level. After this, the additional requirement that the proteins were required to replicate in two out of three injections decreased the error in the protein identifications further.
From a 1D analysis of E. coli, 365 proteins were identified in two of three replicate injections (data not shown). Almost all of these proteins were identified in the 2D experiment, where 690 proteins were identified in two of three replicates. The number of peptides increased dramatically between the 1D experiment (2874 peptides) and the 2D experiment (7961 peptides). The five fraction E. coli experiment was repeated in two laboratories, on different instruments and by different operators, to test the reproducibility of the 2D system. The results of this experiment can be seen in Figure 2. In laboratory 1, 690 proteins were identified in two of three replicate injections, while in laboratory 2, the number was 595 proteins. The Venn intersection shows that over 90% (538) of these proteins were identified in both laboratories.

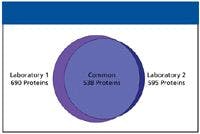
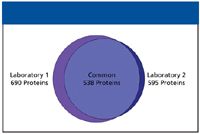
Figure 2: Venn diagram illustrating the reproducibility of protein identifications between two laboratories.
The absolute amount of a protein can be measured by comparing its three best ionizing peptides to that of an internal standard (3). Using this method, the tryptic digest of alcohol dehydrogenase was spiked into the E. coli sample at 50 fmol. The site-to-site reproducibility for the absolute quantitation measurement can be seen in Figure 3. Each point on the graph represents an identified protein that was quantified in both laboratories. The average relative standard deviation for the absolute quantitation measurement was 19% in laboratories 1 and 2. The most abundant proteins in laboratory 1 were also the most abundant proteins in laboratory 2. More importantly, a linear relationship can be seen for the proteins, with more scatter being observed at the lowest level of abundance, as was expected.

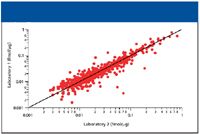
Figure 3: Graph showing the absolute quantitation of E. coli proteins between two laboratories.
Conclusion
This study shows that proteins can be identified reproducibly and quantified between two laboratories. The peptides belonging to the identified proteins were identified reproducibly in the same fractions, at the same retention times, and with the same fragment ions in this study. Reproducible retention times, along with the knowledge of the most abundant peptides to a protein, the most abundant fragments to the peptides, as well as any possible interferences, are vital pieces of information that are key in building methods for validating proteomic discoveries. This method could easily be used to bridge between the typical discovery and validation workflows for proteomic samples.
Acknowledgment
The authors wish to thank Dr. Chris Hughes for work in the comparisons between laboratories.
Martha Stapels and Keith Fadgen are with Waters Corporation, Milford, Massachusetts.
References
(1) D.A. Wolters, M.P. Washburn, and J.R. Yates, Anal. Chem. 73, 5683–5690 (2001).
(2) M. Gilar, P. Olivova, A.E. Daly, and J.C. Gebler, J. Sep. Sci. 28, 1694–1703 (2005).
(3) J.C. Silva, M.V. Gorenstein, G.Z. Li, J.P. Vissers, and S.J. Geromanos, Mol. Cell. Proteomics 5, 144–156 (2006).


Newsletter
Get essential updates on the latest spectroscopy technologies, regulatory standards, and best practices—subscribe today to Spectroscopy.