Analyzing the Protein Secondary Structure in Tissue Specimens
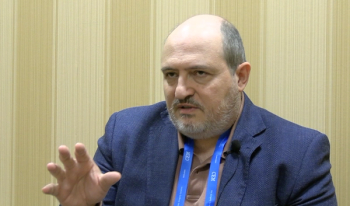
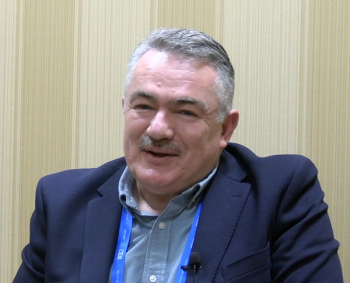
In the first part of this three-part interview, Ayanjeet Ghosh of the University of Alabama and Rohit Bhargava of the University of Illinois Urbana-Champaign discuss their interest in using discrete frequency infrared (IR) imaging to analyze protein secondary structures.
Recently, a study published in Applied Spectroscopy presented a two-step regressive neural network model that enhances discrete frequency infrared (IR) imaging for biomedical applications, particularly in analyzing protein secondary structures in tissue specimens relevant to neurodegenerative disease research (1). This new model was designed to address limitations of traditional methods, such as principal component analysis (PCA), by using only seven wavenumbers to interpolate high-resolution spectra and predict structural component areas under the curve (AUCs), achieving faster analysis and faster data acquisition (1).
Two of the authors of this study, Ayanjeet Ghosh, who is an associate professor in the Department of Chemistry and Biochemistry at the University of Alabama, and Rohit Bhargava, who is a professor in the Department of Bioengineering at the University of Illinois, Urbana-Champaign, recently sat down with Spectroscopy to discuss their findings (2,3).
In the first part of this three-part interview, Ghosh and Bhargava discuss their interest in using discrete frequency infrared (IR) imaging to analyze protein secondary structures.
What inspired your team to explore discrete frequency infrared (IR) imaging as a tool for analyzing protein secondary structure in tissue specimens?
Misfolding and aggregation of specific proteins is at the core of the molecular pathology of a vast number of disorders, particularly neurodegenerative diseases like Alzheimer’s disease, which involves aggregation of proteins and peptides such as amyloid beta and tau into amyloids. It is now known that different disease states or pathologies can involve amyloid aggregates with different molecular arrangements. Understanding the structure of these aggregates is key towards developing therapeutic strategies for these disorders.
However, a key challenge is the lack of suitable techniques that can probe the protein structures directly in their native environments, such as tissues. IR spectroscopy is a technique widely employed for characterizing protein structure. IR imaging, which integrates the capabilities of conventional IR spectroscopy with microscopy, naturally emerges as an ideal tool to extend protein structural studies to ex vivo specimens.
However, acquiring a full IR spectrum for each pixel in large tissue specimens is time-consuming, and only a small spectral window, corresponding to the amide-I band, is usually used for structural analysis. Discrete frequency IR (DFIR) imaging offers a faster, targeted acquisition of the spectral data necessary for structural interpretation.
How precisely does discrete frequency IR imaging differ from traditional multiple frequency IR imaging?
Traditional Fourier transform infrared (FT-IR)-based imaging approaches acquire a full IR spectrum, typically ranging from ~600–3800 cm-1 for every pixel of the image. However, a significant portion of this spectrum often does not contain any vibrational band of interest. Furthermore, there are spectral redundancies as well, essentially multiple bands that report on the abundance of the same chemical entity. This leads to a significantly long acquisition time for hyperspectral data and large file sizes, most of which does not offer any new chemical insight.
In DFIR, we employ a quantum cascade laser that can be tuned to any specific wavenumber of interest in the IR fingerprint region, which usually has absorptions from all chemical moieties of interest, from proteins. Therefore, the spatial abundance of specific chemical components across the specimen can be rapidly mapped by acquiring images at only key wavenumbers corresponding to absorptions of these components, reducing the acquisition time significantly and enabling measurement of larger specimens.
However, the DFIR approach has one limitation. Quantification of protein secondary structures from IR spectra is usually achieved through deconvolution or fitting of the amide I band, which requires a full spectrum in this spectral region. Although DFIR is faster, discrete frequency data is not sufficient alone for deconvolution. In this work, we have used ML to help us bridge that gap.
Can you elaborate on the limitations of conventional spectral fitting techniques like Gaussian band fitting when applied to hyperspectral images of tissue samples?
The gold standard in spectral deconvolution of IR spectra, particularly for quantifying protein secondary structures in band fitting with different line shapes: Gaussian, Lorentzian, or Voigt, which is convolution of the two. However, fitting is slow—scaling to whole-tissue data (millions of spectra) is impractical. It is also susceptible to noise and baseline variations, which can be particularly relevant for biological specimens and are typically much higher than that observed in bulk IR spectroscopy. Further, the low optical throughput of microscopes per pixel is smaller than that of bulk spectrometers, resulting in relatively lower signal-to-noise (S/N) ratio and presenting further challenges. As a result, spectra would require additional pre-processing steps prior to band fitting, making the data analysis routines more tedious and complex. Most importantly, it requires hyperspectral data. For proteins, we would need to acquire the full amide-I spectrum, which in turn increases the experimental time, and essentially defeats the purpose of acquiring discrete frequency data.
References
- Edmonds, H.; Mukherjee, S. S.; Holcombe, B.; et al. Quantification of Protein Secondary Structures from Discrete Frequency Infrared Images Using Machine Learning. Appl. Spectrosc. 2025, ASAP. DOI:
10.1177/00037028251325553 - The University of Alabama, Ayanjeet Ghosh. UA.edu. Available at:
https://chemistry.ua.edu/people/dr-ayanjeet-ghosh/ (accessed 2025-05-01). - University of Illinois, Urbana-Champaign, Rohit Bhargava. Illinois.edu. Available at:
https://bioengineering.illinois.edu/people/rxb (accessed 2025-05-01).
Newsletter
Get essential updates on the latest spectroscopy technologies, regulatory standards, and best practices—subscribe today to Spectroscopy.


