Article
Special Issues
Spectroscopy Supplements
Comparison of Extracts from Dry and Alcohol-Steamed Root of Polygonatum kingianum (Huang Jing) by Sub-2-µm–LC–TOF-MS
Author(s):
Most plants used in traditional Chinese medicine must be processed before their medicinal usage; hence the effective ingredients may differ from those in the freshly harvested plant extracts. In this work, we present a fast and generic approach using sub-2-?m liquid chromatography–time-of-flight–mass spectrometry (sub-2-?m-LC–TOF-MS) coupled with multivariate statistical data analysis to systematically profile ingredient changes between fresh and processed samples of huang jing.
Traditional Chinese medicine (TCM) uses naturally occurring resources such as plants and animals to treat diseases. Most TCM-derived plants must be processed prior to their medicinal usage; hence the effective ingredients may differ from those in the freshly harvested plant extracts. In this work, we present a fast and generic approach using sub-2-µm liquid chromatography–time-of-flight–mass spectrometry (sub-2-µm-LC–TOF-MS) coupled with multivariate statistical data analysis to systematically profile the ingredient changes between the fresh and processed samples. We believe this approach will ultimately facilitate the progress of migrating from a TCM system to a modern Chinese medicine (MCM) system. The application example described here studies different extracts from Polygonatum kingianum, a plant otherwise known in China as huang jing. For this study, we examined the differences in ingredient composition of huang jing before and after processing so that the leading chemical markers could be profiled and identified.
Traditional Chinese medicine (TCM) is based on naturally occurring resources such as plants, animals, and minerals for the treatment of diseases. Recently, scientists have begun paying more attention to better understand the working mechanisms of TCM (1–4). There is hope that a comprehensive understanding of TCM mechanisms will eventually lead to new and effective remedies with known mechanisms to support the transition to a modern Chinese medicine (MCM) system.
The very first step in this process is a comprehensive ingredient analysis of TCM samples. It is well known that the ingredient analysis for TCM sample is challenging for several reasons. First, identical species of plants may contain different ingredients depending on plant location, harvest time, and method of harvest. Second, identical plants may have different final ingredients even if harvested at the same time but stored under different conditions. Third, extracts of ingredients from processed TCM plants can differ from the extracts obtained from freshly harvested plant materials. Ultimately, it is the ingredients from the processed plant extracts that will be actively providing the physiological effects.
For years, TCM scientists have been trying to gain a better understanding of the ingredient changes before and after processing (5). This task is difficult because plants typically contain hundreds of ingredients at a variety of concentration levels that may belong to many different chemical classes. The most effective way to comprehensively understand what has happened to plant ingredients before and after processing at the compound level is to use a systematic sample profiling strategy.
Key factors that are crucial for effective sample profiling are the sample preparation procedure, the data acquisition protocol, and the data processing and interpretation strategy. A detailed discussion of sample preparation procedure is beyond the scope of this paper. It is important to note, however, that when analyzing samples for comparison purposes, all groups of samples must be prepared with an identical protocol and the protocol used must result in samples that accurately represent their medicinal form.
The data acquisition protocol is part of the instrumental analysis protocol. For complex sample analysis, the most effective technique is liquid chromatography (LC) coupled with mass spectrometry (MS). LC based on the use of sub-2-µm chromatographic particles offers the best combination of separation resolution, sensitivity, and speed (6). Separation resolution is the key for complex sample profiling because a compound can be identified only if it is sufficiently separated from the others. Enhanced separation resolution will ensure better sample profiling quality with high confidence. For compound identification, a time-of-flight (TOF) mass spectrometer is the best option because it offers the ability to detect analytes with exact mass measurement so that the elemental composition can be determined.
The hybrid quadrupole-TOF-MS system is a popular choice for the MS detection. With the quadrupole physically positioned in front of the TOF flight tube, a data-acquisition filtering ability is enabled to allow different types of experiments to be carried out with cleaner data. One effective analytical strategy for complex samples is TOF–MS analysis (7). With this approach, the mass spectrometer collects data in two separate scan functions, one that uses low collision energy and the other that uses high collision energy. As a result, upon finishing one LC injection, both MS full scan and MS–MS fragment information is obtained so that not only positive identification of the analytes of interest is accomplished but also structural elucidation becomes possible as well.
Postacquisition data processing is also critical for effective sample profiling. Because of the complexity of samples, the most effective way to compare two groups of samples for comprehensive understanding of their ingredient differences is by using a multivariate statistical analysis (MVSA) method such as principal component analysis (PCA). The MVSA approach has been widely used in metabonomics–metabolomics applications in recent years (8,9). But its principle and applicability for TCM sample profiling is only at the early stage (10).
For this work, we propose to use the sub-2-µm-LC–TOF-MS–MSVA workflow (11) to systematically profile and compare the ingredient differences for extracts obtained from the fresh and alcohol-steamed roots of the plant Polygonatum kingianum, also known as huang jing.
P. kingianum roots are used as a tonic remedy for lung troubles and ringworm (12). Traditionally, fresh huang jing root is cut into thin slices after harvest for storage. Before medicinal use, these slices are soaked in alcohol and then steamed to the point where all the slices turn black in color. Figure 1 shows the huang jing root before and after processing. Over the years, many attempts have been made to gain an understanding of the ingredient changes induced by the processing (13,14). However, for lack of a systematic approach, only a handful of ingredients have been observed, and it remains unclear whether those identified ingredients are the major contributors of sample differences.


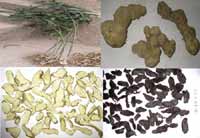
Figure 1: Huang jing samples before and after the processing procedure: fresh whole herb (upper left); rhizome (root) of the fresh herb (upper right); slices of the fresh rhizome (bottom left); and slices steamed in alcohol for 15 h (bottom right).
In this study, the fresh huang jing root extract was compared with the processed huang jing root using the sub-2-µm-LC–TOF-MS–MSVA approach. The goal was to determine the major changes of these two groups of samples, gain a better understanding of the chemical mechanism for sample processing, identify key chemical and biological markers from the processed huang jing sample, and eventually help us to understand the physiological significance of sample processing for TCM.
Experimental Conditions
Reagent and Materials: Acetonitrile and methanol (Optima grade) were purchased from Fisher Scientific (Fair Lawn, New Jersey). Formic acid was purchased from Sigma Aldrich (St. Louis, Missouri). Deionized water purified with an Elix ultrapure water system from Millipore Corporation (Bedford, Massachusetts) was used throughout the project. Leucine enkephalin was purchased from Sigma Aldrich (St. Louis, Missouri).
P. kingianum was collected from Fenggang county of Guizhou province, China, in December 2006, and was identified as rhizomes of Polygonatum kingianum Coll. et Hemsl. by Li-juan Zhang, professor of traditional Chinese medicine at Tianjin University (Tianjin, China).
Sample Pretreatment
The Fresh Huang Jing Root: The fresh huang jing root was cut into thin slices and dried at 50 °C for 48 h, then cooled to room temperature and sealed for storage.
Alcohol-Steamed Huang Jing Root: Fresh huang jing roots were soaked in rice wine (root/wine ratio 5:1) until the wine was fully absorbed. These wine-absorbed roots were steamed for 15 h, then kept in a container with closed lid for another 8 h. These roots were then cut to thin slices before being baked at 50 °C for 48 h. The samples were then cooled to room temperature and sealed for storage.
Huang Jing Root Extraction: The same extraction procedure was applied to both fresh and processed huang jing root slices.
First, 30 g of the huang jing root slices was weighed out, 200 mL of 35% acetone was added, and the root–acetone solution was sonicated for 20 min. This same procedure was repeated two more times, so that total of 600 mL of 35% acetone extraction solution was obtained. The supernatant was filtered and loaded onto a macroporous resin SP825 (Mitsubishi Chemical, Tokyo, Japan) column packed by hand in the laboratory. Each sample was eluted, stepwise, with the following solvents: water (3 column volumes [cv]), 10% acetone (3 cv), 80% acetone (3 cv), and methanol (3 cv). The fraction obtained from the 80% acetone elution was evaporated until it was dry and reconstituted to 10 mL with 80% acetone.
Sub-2-µm-LC Conditions: The LC separation was performed on a Waters Acquity UPLC system (Waters Corporation, Milford, Massachusetts), which was equipped with a binary solvent delivery manager, a sample manager, and a column heater.
The column used was a 100 mm × 2.1 mm, 1.8-µm Waters Acquity HSS T3 C18 column at 40 °C with a flow rate of 0.6 mL/min. The mobile phases were water with 0.1% formic acid (mobile phase A) and acetonitrile (mobile phase B). The analytes were eluted from the column with a linear gradient of 5–95% B in 25 min, stepped to 100% B and held for 2 min before returning to the initial conditions. The total run time was 30 min. The strong wash solution was 1:1:1:1 (acetonitrile–methanol–isopropanol–water) with 0.1% formic acid. The weak wash solution was mobile phase A.
MS Conditions: The mass spectrometer used was a Waters Synapt HDMS system (Waters Corporation). Data acquisition was controlled by MassLynx 4.1 software. The ionization mode was negative electrospray. The data acquisition range was 100–1200 Da. Leucine enkephalin (200 pg/µL) was used as the lock mass (m/z 556.2771). The source temperature was 120 °C, and the desolvation gas temperature was 450 °C. The capillary voltage was 3.0 kV, and the cone voltage was 25 V.
To collect data in TOF–MS mode, the mass spectrometer acquired data in two separate scan functions and was rapidly switched between the two scan functions. The first scan was set at low collision energies (the trap collision cell at 5 eV, and the transfer collision cell at 4 eV), and the second scan was set at high collision energies (the trap collision cell was ramping from 30 to 60 eV, and the transfer cell was set at 15 eV). The scan time for each function was set at 0.15 s.
Data Processing: Data processing included MSVA performed by MarkerLynx XS software (Waters Corporation), a MassLynx application manager. The structural elucidation was performed by MassFragment, a software tool provided by MassLynx.
Results and Discussion
The Beijing Institute of Radiation Medicine (Beijing, China) has been studying ingredient changes between freshly harvested and alcohol-steamed huang jing. The approach used (before the application of the sub-2-µm-LC–TOF-MS method) was high performance liquid chromatography–evaporative light scattering detection (HPLC–ELSD). Figure 2 shows a comparison of the chromatograms obtained using HPLC–ELSD (Figure 2a) and sub-2-µm-LC–TOF-MS (Figure 2b). The HPLC peaks were eluted in 100 min whereas the sub-2-µm-LC peaks were eluted in 20 min with significant enhancement in peak capacities. The sub-2-µm-LC–MS method clearly showed much better sensitivity, with many more samples detected compared with ELSD.


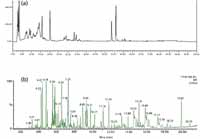
Figure 2: Comparison of chromatograms of extract from fresh (unprocessed) root slices of huang jing, obtained using (a) HPLCâELSD and (b) sub-2-µm-LCâTOF-MS. For the sub-2-µm-LCâTOF-MS method, the base peak ion chromatogram was obtained using a low collision energy scan.
Figure 3 shows a comparison of the base peak ion chromatograms obtained for fresh and alcohol-steamed huang jing extract. The chromatograms shown in Figure 3 were obtained from the low energy scan. A general trend about these two samples could be observed at this stage. The alcohol-steamed sample clearly displayed more peaks with higher intensities later in the chromatogram (especially after a retention time of 10 min), and showed an obvious decrease for early peaks both in the number of peaks and the peak intensities. Given the fact that the separation was performed on a reversed-phase column, this trend indicated that the fresh extract contained more polar ingredients and the alcohol-steamed extract contained more ingredients with less polarity.


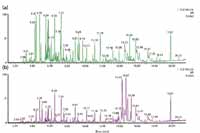
Figure 3: Comparison of base peak ion chromatograms of extracts of (a) fresh huang jing root and (b) alcohol-steamed huang jing root. Both chromatograms shown here were obtained using a low collision energy scan.
Given the complexity of the samples, however, the best approach to determine the chemical differences between the two samples is to use multivariate statistical analysis. MVSA is most effective when it is used to highlight group differences. There are different software packages commercially available for that purpose. However, one prerequisite for using MVSA is that the data must be in 2-D format. Statistical software packages are unable to process 3-D data as obtained from an LC–MS analysis (time, m/z, and intensity). In other words, the 3-D dataset must be reduced to a 2-D matrix before it can be analyzed by MVSA.
To accomplish this, MarkerLynx XS software converts the LC–MS data into exact mass retention time (EMRT) pairs. Each EMRT pair is designated as a marker that counts as one dimension of the data. The second dimension of the data matrix is the relative intensity of each marker. This 2-D matrix can be automatically imported into EZ info (part of MarkerLynx XS) for automatic multivariate statistical analysis.
After it is imported into the EZ info, the data is processed first by PCA. A minimally supervised statistical model, orthogonal partial lease squares–data analysis (OPLS-DA), can then be applied for orthogonal data analysis. Figure 4 shows the scatter plot (S-plot) obtained by this method based on OPLS-DA for the fresh extract and the alcohol-steamed extract. In the S-plot, each point represents an EMRT pair. The x-axis shows the variable contributions. The farther away a data point is from the origin, the more that data point contributes to the variance from the sample. The y-axis shows the sample correlations within the same sample group. The farther away an EMRT pair is from the value 0, the better the correlation is among the injections. As a result, the EMRT pairs on both ends of the S-shaped curve represent the ions having the most significant effect for sample grouping.

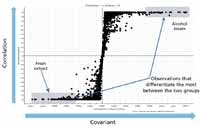
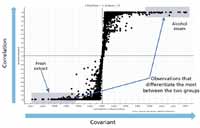
Figure 4: Scatter plot of fresh and alcohol-steamed huang jing root extract obtained using an orthogonal partial least squaresâdata analysis (OPLS-DA).
For example, in Figure 4, the EMRT pairs close to the upper-right corner of the S-plot are the leading contributing markers from the alcohol-steamed extract with high confidence. The EMRT pairs close to the lower left corner of the S-plot are the leading contributing markers from the fresh extract with high confidence. The leading contributing EMRT pairs can be selectively captured so that a list of top contributing markers for each sample group can be generated either as bar chart or as a list.
Figure 5 shows the list of the top 10 EMRT pairs obtained from the S-plot for both sample groups. This list can also be imported back into the MarkerLynx XS browser result table for elemental composition searches as well as database searches. The top 10 EMRT pairs high in content from the alcohol steam are represented in the top half of the table in Figure 5, whereas the top 10 EMRT pairs high in content from the fresh extract are represented in the bottom half of the table. Along with the retention times, the exact masses and the change (fold) are also listed. The exact mass listed for each of the components is the basis for obtaining the elemental compositions. The elemental composition can then be used to query existing databases to find possible chemical structures. The database search can be performed with either an open public database (for example, ChemSpider) or internal homebuilt database.

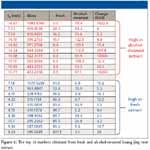
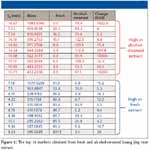
Figure 5: The top 10 markers obtained from fresh and alcohol-steamed huang jing root extract.
To demonstrate the utility of this workflow, we picked the m/z 913.4451, 7.54-min EMRT pair as an example. The elemental composition of this marker was found to be C45H70O19. The result was obtained in negative ionization mode indicating that the elemental composition for the uncharged molecule should be C45H70O19. The elemental composition was used to search an inhouse database with two possible results obtained as shown in Figure 6. To confirm which structure it is, we needed to take a look at the fragment ions. The key differentiator between the two structures are the agilycone with the Figure 6a structure showing m/z 429.2 and Figure 6b with m/z 427.2, both in positive ion electrospray. These would translate to m/z values into 427.2 and 425.2 in negative ion mode respectively.

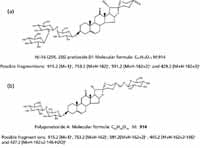

Figure 6: Possible structure of m/z 913 obtained from an in-house database.
Figure 7 shows a comparison of the fragment ions obtained from high collision energy scan for this marker. 6a shows the high collision energy spectrum of the marker obtained from the alcohol-steamed root extract, and Figure 6b shows the high collision energy spectrum of the matching standard. Figure 8 shows the positive ion high collision energy spectrum for the m/z 913, 7.54-min marker from the alcohol-steamed root extract. It clearly shows that the aglycone for the m/z 913, 7.54-min marker was m/z 429.3 in the positive ionization mode. This indicated that the target ingredient is possibly the same structure as Figure 6a. To further confirm this hypothesis, the structure of Figure 6a was created and saved as a Mol. file so that the structural elucidation was performed for this compound using the MassFragment software (Figures 7 and 8). This added confirmation step assured us that the m/z 913, 7.54-min marker was the pratioside D1.

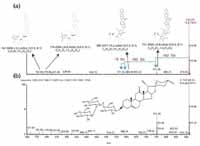
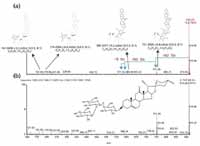
Figure 7: ESI-MS fragment spectra of m/z 913 from (a) alcohol-steamed huang jing extract and (b) a previously obtained standard. These fragment spectra were obtained from a high collision energy scan.
The top 10 markers from alcohol extract and the fresh extract both contained a few markers with even m/z values, which means that their corresponding uncharged molecules had molecular weights with odd numbers. Previous efforts to differentiate these two groups of samples were all focused on saponins. However, saponins only contain C, H, and O as elements, which can only result in compounds with molecular masses with even numbers. The existence of compounds with an odd number of molecular masses indicated that apart from the saponins, other classes of compounds are also important contributors to the differences between the fresh and alcohol-steamed extracts. A separate research project was set up for future studies based on our findings from this study.

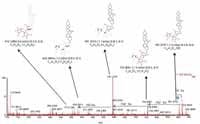
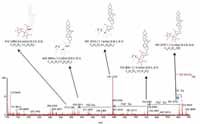
Figure 8: ESIâMS fragment spectrum of m/z 913 of alcohol-steamed huang jing root extract in ESI+ mode.
Conclusions
We have used a generic sub-2-µm-LC–TOF-MS sample profiling approach to compare ingredient differences for traditional Chinese medicine samples before and after processing. We used Polygonatum kingianum root extract as the application example. A multivariate statistical approach allowed the top contribution markers from each sample group to be quickly identified so that the database could be searched for chemical identification, with findings easily confirmed by the use for MS data coupled with MassFragment software. This approach is generic, simple, and fast. The separation took <30 min and the data processing took minutes to complete. As a result, leading chemical markers that caused the group differentiation were quickly identified. Such identification will help focus research on the key ingredients in extracts used in traditional Chinese medicine, and ultimately help understand their mechanisms of action.
Kate Yu, Ph.D., is a Principal Scientist in Metabolic Profiling Business Operations and Alan Millar, Ph.D., is Director of Metabolic Profiling Business Operations, both with Waters Corporation in Milford, Massachusetts. Baiping Ma is Professor of Herbal Chemistry Laboratory, Beijing Institute of Radiation Medicine, in Beijing, China. and HeShui Yu, Liping Kang, Jie Zhang, and Yue Gao are all with the Beijing Institute of Radiation Medicine.
References
(1) Y. Wang, J.L. Hao, and Y.J. Qiao, Systems Biology Platform for Mecha- nism Clarification of TCM, GCIS, 2009 WRI Global Congress on Intel- ligent Systems 3, 382–389 (2009).
(2) Y.Z. Liang, L.Z. Yi, and Q.S. Xu, Sci.China Ser. B-Chem. 51(8), 718–728 (2008).
(3) X. Chen, H. Zhou, Y.B. Liu, J.F. Wang, H. Li, and C.Y. Ung, Br. J. Pharm. 149, 1092–1103 (2006).
(4) A. Harvey, Drug Disc. Today 13(19- 20), 894-901 (2008).
(5) Y.F. Li, L. Liu, and Y.Y. Chen, Chro- matographia 65, 749–755 (2007).
(6) J. Mazzeo, U. Neue, M. Kele, and R. Plumb, Anal. Chem. 77(23), 460A– 467A (2005).
(7) K. Bateman, J. Castro-Perez, M. Wrona, J. Shockcor, K. Yu, R. Oballa, and D. Nicoll-Griffith, Rapid Comm. Mass Spec. 21, 1485–1496 (2007).
(8) H. Gika, E. Macpherson, G. Theodo- ridis, and I. Wilson, J. Chromatogr. B. 871, 299–305 (2007).
(9) W. Griffiths and Y Wang, Chem. Soc. Rev. 38, 1882–1896 (2009).
(10) L.R. Sun, S.X. Wang, and X. Li, Chinese J Medicinal Chem. 7(2), 129 (1997).
(11) K. Yu, M. Xin, J. Castro-Perez, X. Fu, Y. Chen, H.Z. Guo, J. Shockcor, and B. Murphy, Current Trends in Mass Spectrometry, supplement to LCGC North America, 36–43 (October 2009).
(12) C.R. Yang, Y. Zhang, D. Wang, and Y. Zhang, J. Acta Botanica Yunnanica 29(5), 591–600 (2007).
(13) J. Zhang, B.P. Ma, L.P. Kang, H.S. Yu, Y. Yang, X.Z. Yan, and F.T. Dong, Chem. Pharm. Bull. 54(7), 931–935 (2006).
(14) L.R. Sun, and X. Li, Chinese Tradi- tional and Herbal Drugs 32(7), 586–588 (2001).


Newsletter
Get essential updates on the latest spectroscopy technologies, regulatory standards, and best practices—subscribe today to Spectroscopy.