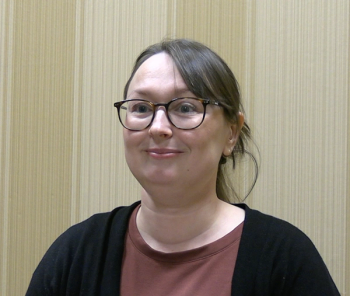
Defining LWIR and SWIR: An Interview with Pooja Sheevam
In this interview segment, Pooja Sheevam elaborates on what LWIR and SWIR are and what advantages they both offer when analyzing Hawaiian geology.
Prior to joining the New Mexico Bureau of Geology and Mineral Resources as a research associate, Pooja Sheevam was a PhD Candidate at the University of Nevada, Reno, where she worked with infrared (IR) spectroscopy and its applications to study the mineralogy of the Hawaiian drill core (1,2).
In Part I of our video interview with Sheevam, she discusses why her team used both longwave infrared (LWIR) and shortwave infrared (SWIR) spectroscopy to analyze the PTA-2 drill core, which was collected from a drill site in the Pohakuloa Training Area on Hawaii, and how the two techniques complemented each other in the study (3). In Part II, Sheevam discusses LWIR and SWIR more in depth, talking about the advantages that each technique brought to the study.
Will Wetzel: How do you define LWIR and SWIR in terms of measured wavelength regions, instrumentation, sampling methods, and advantages?
Pooja Sheevam: In our study, we employed visible to near-infrared (NIR) to SWIR, and then we also did mid- to LWIR spectroscopy. What we consider the visible for SWIR typically covers the wavelength range approximately 0.3–2.5 microns, while our mid- to LWIR, which we just characterize in my paper as LWIR, spans from roughly 2.5 or three microns to about 20 microns.
So again, our initial survey of the drill core was 0.3–20 microns. When you're a geologist looking at the recovered core, whether they're cuttings or continuous old cores, you employ logging methods. These traditionally involve someone going down and looking at fractures, permeability, porosity, mineral types, and alteration types. We included in that logging the shortwave point spectroscopy using a field portable spectrometer. We used one from Spectral Evolution for identifying hydrated minerals and alteration minerals, such as those clays, so phyllosilicate sulfates, carbonates, zeolites, things like that, that can happen in a range of alteration temperatures.
The cool thing about doing this initially was that we got a very good idea about the alteration types, and therefore, some constraint on the environment of formation. So, in geology, if you detect specific minerals, they can only form in certain temperature and pH ranges and precipitate out. And so, by seeing those, you can automatically get an idea the alteration environment. And some people, what they do is that they don't even know that they have to send things to a laboratory and wait for a couple weeks for the data to come back, whereas we were able to do that on-site. We took some samples back, and we did some long wave analysis, where we initially just crushed the samples and kind of packed them into a little plate and used a benchtop Fourier transform IR (FT-IR) spectrometer that is owned by Thermo Fisher Scientific, and we got output. It's almost like point spectroscopy, but it is a mixed spectra of whatever rocks minerals that were crushed into that mixture.
However, both techniques in those initial surveys were nondestructive and required very minimal sample preparation. We also had a great advantage to help track not only the alteration phases but also get very specific minerals and members in the primary phases as well. So, we got a very good full picture of just the minerals that were in the rock, and then subsequently, based on interpolating that data and understanding how geology works, we were able to get some sort of thermal and fluid history without consuming too many materials.
References
- Sheevam, P.; Calvin, W. M. Comprehensive Characterization and Geochemical Alteration Pathways of Drill Core From the Humu'ula Groundwater Research Project, Hawaii, USA: I. Pohakuloa Training Area. J. Vol. Geo. Res. 2025, 462, 108311. DOI:
10.1016/j.jvolgeores.2025.108311 - Wetzel, W. Using Spectroscopy to Understand Hawaii’s Hidden Geology. Spectroscopy. Available at:
https://www.spectroscopyonline.com/view/using-spectroscopy-to-understand-hawaii-s-hidden-geology (accessed 2025-05-27). - Wetzel, W. Analyzing Hawaii’s PTA-2 Drill Core With LWIR and SWIR Spectroscopy. Spectroscopy. Available at:
https://www.spectroscopyonline.com/view/analyzing-hawaii-s-pta-2-drill-core-with-lwir-and-swir-spectroscopy (accessed 2025-05-29).
Newsletter
Get essential updates on the latest spectroscopy technologies, regulatory standards, and best practices—subscribe today to Spectroscopy.


