Exploring Mars with Light: S. Michael Angel on the SuperCam Instrument
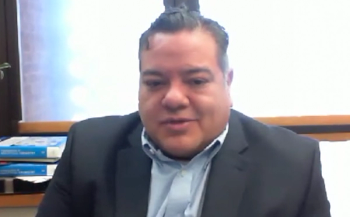
In this interview, S. Michael Angel, a consultant on the SuperCam team, explains how the instrument analyzes Martian rocks and what it reveals about Mars’ geology and potential for past life.
S. Michael Angel, a leading expert in laser-based spectroscopy, was involved as a consultant with the technical team that designed and developed the rover instrument SuperCam, one of the most advanced instruments aboard NASA’s Perseverance Mars rover. SuperCam combines multiple technologies—including laser-induced breakdown spectroscopy (LIBS), Raman spectroscopy, and infrared (IR) spectroscopy—to explore the Martian surface remotely.
In this interview, Angel shares insights into the challenges and breakthroughs involved in merging these technologies, how SuperCam decodes Martian rocks from a distance, and what we’re learning about the Red Planet's geology, mineralogy, and potential for past life. These questions explore the science behind the instrument and the exciting discoveries it enables.
What were the biggest challenges in combining two different laser techniques—LIBS and Raman spectroscopy—into one instrument?
The Raman spectrometer on the SuperCam has shown great utility for a variety of measurements on Mars (1–3). For combining LIBS and Raman into a single instrument, some interesting technical challenges were overcome. The Raman spectrum provides molecular structural information, whereas LIBS is an atomic spectroscopy, giving elemental composition, but no direct molecular information. The two techniques together are highly complementary, and together they provide a very powerful tool for determining the chemical structure of Martian samples. For example, a Raman spectrum might indicate that a rock contains sulfate, but it can’t easily discriminate the attached metal cation. For the same sample, the LIBS spectrum might indicate the presence of high levels of sulfur and calcium, but it gives no information on the molecular structure. The Raman and LIBS spectra taken together can show that the sample contains CaSO4. The spectral signals for each technique are also conveniently located in the UV, visible, and near infrared, allowing the use of similar CCD detectors, and both Raman and LIBS spectra can be used to measure remote samples by focusing the laser on the sample and collecting the light using telescopic optics.
Raman with LIBS sounds like an ideal combination. But there are issues related to how the spectral signals are generated and collected. Raman spectra are best measured using low laser irradiance to avoid photo-induced sample degradation, a major problem with this method. The Raman signal is proportional to the average power of the laser, and the total induced signal is independent of laser flux, thus, CW lasers are most commonly used for Raman studies, which can provide high average power and low peak power at the same time. Raman lasers are typically visible-wavelength, blue or green, because Raman cross sections scale as the inverse fourth power of scattering wavelength. When pulsed lasers must be used, sample degradation can be minimized by using a large laser spot on the sample. This is easy for remote Raman because the laser naturally diverges over distance anyway.
The LIBS signal is generated by thermal excitation of atoms that are created by photo-ablation, followed by photo-degradation and atomization of the sample using a high peak-power pulsed laser. With LIBS, the measured area of the sample is intentionally destroyed, creating a hot plasma that is made of excited atoms and ions, which emit at characteristic wavelengths. To achieve the conditions to create a LIBS plasma, the pulsed laser, typically a Q-switched near-infrared laser, must be focused to a small spot on the remote sample. For LIBS, laser peak power is more important than wavelength, and Q-switched Nd: YAG or glass lasers are very practical for this purpose.
A laser optimized for LIBS would give no Raman signal, while one optimized for Raman would give no LIBS signal. For SuperCam, the obvious solution is two laser beams. This is provided by using a pulsed 1064 nm wavelength laser that is suitable for LIBS and is frequency doubled to 532 nm for Raman. The beams are optically separated and sent to the mast optics, where the beams are focused as needed and directed to the remote sample. The pulsed 532 nm laser is not ideal for Raman, but by controlling the beam profile and remote spot size, sample degradation is minimized.
The spectrometers for LIBS and Raman are quite different too, mainly in the range of wavelengths needed for each, especially the short wavelengths. A few spectrometers were used, one for the Raman range and others for the LIBS range, and the collected light was split accordingly and sent to the appropriate spectrometer.
How does SuperCam tell the difference between Raman signals and background glow (fluorescence) when analyzing rocks?
The Raman CCD detector is gated. Long-lived luminescence, like phosphorescence, can be discriminated against by time gating. Short-lived fluorescence cannot be time-gated but usually stands out because it is broadband compared to Raman bands. Although SuperCam can detect fluorescence, SHERLOC, a UV Raman instrument on the rover, is more highly optimized for this measurement.
How does time-resolved luminescence (TRL)—a glow that fades over time—help detect rare elements or signs of life?
Certain types of organic molecules, such as polycyclic aromatic hydrocarbons (PAHs), are biosignatures that may signify past life. Short-lived fluorescence detection is useful in detecting and identifying such molecules in trace amounts. Most mineral luminescence is long-lived, so short-lived fluorescence measurements discriminate organic and inorganic signatures.
How far away can SuperCam accurately measure with its lasers, and what limits those distances?
The range of both instruments is up to about 7 meters, though this is not a hard number, and most measurements are made much closer. The range is partly constrained by design. But in general Raman range is limited by the weak Raman signal and high levels of background interference from scattered light in the collection fiber. LIBS is usually limited by the ability to tightly focus the laser at a distance.
What was the most exciting or fulfilling part of working on this project?
I retired a few years ago from the project, but my best memories are working some of the first surface ops and seeing first-hand the data from SuperCam as it came down from the Mars orbiter satellite. Seeing the first Raman spectrum come down from Mars in real time is a special memory. It has also been very fulfilling to see an idea I first published with a colleague and student in a paper in 1992, a simple CW remote Raman instrument to remotely measure toxic materials, and later extended to LIBS measurements with Shiv Sharma, professor at the University of Hawaii, end up being used in the search for life on another planet.
References
(1) Wiens, R. C.; Maurice, S.; Robinson, S. H.; et al. The SuperCam Instrument Suite on the NASA Mars 2020 Rover: Body Unit and Combined System Tests. Space Sci. Rev. 2021, 217 (4), 1–87. DOI:
(2) Lopez-Reyes, G.; Manrique, J. A.; Clave, E.; Ollila, A. M.; Beyssac, O.; Pilleri, P.; Bernard, S.; Dehouck, E.; Veneranda, M.; Sharma, S. K.; Nachon, M. SuperCam Raman Activities at Jezero Crater, Mars: Observational Strategies, Data Processing, and Mineral Detections During the First 1000 Sols. Authorea Preprints 2025. DOI:
(3) Hausrath, E. M.; Sullivan, R.; Goreva, Y.; Zorzano, M. P.; Vaughan, A.; Cousin, A.; Siljeström, S.; Sharma, S.; Shumway, A. O.; Kizovski, T.; Vanbommel, S. J. Collection and In Situ Analyses of Regolith Samples by the Mars 2020 Rover: Implications for Their Formation and Alteration History. J. Geophys. Res. Planets 2025, 130 (2), e2023JE008046. DOI:
About the Interviewee
Dr. S. Michael Angel, Carolina Trustee Emeritus / Fred M. Weissman Palmetto Chair in Chemical Ecology, Department of Chemistry and Biochemistry, The University of South Carolina, Columbia, SC. Professor Angel retired three years ago from USC/Columbia where he was a Carolina Trustee Professor and Fred M. Weissman Palmetto Chair in Chemical Ecology. He was a member of the Mars 2020 SuperCam science team as a Scientific Research Collaborator until he retired. Dr. Angel is a Lifetime Honorary Member of the Society for Applied Spectroscopy (SAS) and a SAS Fellow. He has received numerous research awards, including the 2022 SC Governor’s Award for Excellence in Scientific Research (2022), SAS Lester W. Strock Award (2019), two SAS William F. Megger’s Awards (2018 and 2012), NASLIBS/SAS Award (2018), and others. Since retiring, Mike spends most of his time pursuing astrophotography, playing guitar, and surf fishing.
About the Interviewer
Jerome Workman, Jr. serves on the Editorial Advisory Board of Spectroscopy and is the Executive Editor for LCGC and Spectroscopy. He is the co-host of the Analytically Speaking podcast and has published multiple reference text volumes, including the three-volume Academic Press Handbook of Organic Compounds, the five-volume The Concise Handbook of Analytical Spectroscopy, the 2nd edition of Practical Guide and Spectral Atlas for Interpretive Near-Infrared Spectroscopy, the 2nd edition of Chemometrics in Spectroscopy, and the 4th edition of The Handbook of Near-Infrared Analysis. Author contact: JWorkman@MJHlifesciences.com ●
Newsletter
Get essential updates on the latest spectroscopy technologies, regulatory standards, and best practices—subscribe today to Spectroscopy.


