Article
Special Issues
Spectroscopy Supplements
High-Throughput Screening of Abused Steroids in Urine Using Direct TOF-MS and LC–High-Resolution TOF-MS with Comprehensive Ion Fragmentation
A proof-of-concept application for detecting abused steroids in urine samples collected from an antidoping surveillance program
A high-throughput screening and confirmation workflow for the analysis of steroids and metabolites in urine was tested. Two urine extracts were analyzed per minute by flow injection electrospray-ionization ultrahigh-resolution time-of-flight mass spectrometry (TOF-MS). Confirmation by liquid chromatography (LC) with high-resolution TOF-MS with comprehensive ion fragmentation achieved sub-nanogram-per-milliliter sensitivity and yielded rich, repeatable fragment spectra that allowed confident analyte verification. Ultrahigh-resolution TOF-MS was chosen for screening, as this technique can easily resolve well over 10,000 chemically attributable signals in a single measurement of 1 s or less. LC with high-resolution TOF-MS was chosen for confirmation because it provides chromatographic and structural selectivity orthogonal to the screening technique.
Workflows for monitoring abused chemical substances often use a high-throughput screening technique followed by an orthogonal technique to confirm positive results. This screening-confirmation strategy maximizes sample throughput while minimizing the chance of false positive results. These workflows typically use two independent technologies: immunoassay, planar chromatography, or a similarly low-cost option for screening; and gas chromatography–mass spectrometry (GC–MS) or liquid chromatography–mass spectrometry (LC–MS) for confirmation.
However, if a hyphenated chromatography–mass spectrometry system that is necessary for confirmation is purchased, maximum return on this investment could be achieved by using the same instrument for the initial high-throughput screening. Here, we describe a proof-of-concept application for detecting abused steroids in urine samples collected from an antidoping surveillance program. Urine samples were extracted and screened using direct flow injection electrospray ionization (ESI) ultrahigh-resolution time-of-flight mass spectrometry (TOF-MS). Two analyses per minute were recorded without advanced programming of the autosampler.
Using exactly the same equipment, positive results were confirmed by liquid chromatography–high resolution time-of-flight mass spectrometry (LC–high resolution TOF-MS). A short LC column took the place of a union between the autosampler and the ESI source, and the electrospray solvent became the mobile phase. Spectra deconvolved from comprehensive collision-induced dissociation allowed analyte confirmation and enabled post hoc analyte-specific and class-specific searches of the data.
Theory
Screening with Flow-Injection Ultrahigh-Resolution MS
High resolution MS can most likely resolve signals from more analytes in a single measurement than any other rapid direct analysis technique. Nevertheless, using this technique alone to screen for target formulas demands high performance of the mass spectrometer. Isobaric interferences present risks for false positive and also false negative results. Ultrahigh resolving power, approaching 100,000 measured at 50% peak height (FWHM), is the minimum requirement for practical implementation.
Isobaric interference is not limited to monoisotopic peaks with the same nominal mass-to-charge ratio (m/z), but an isotope of one formula may obscure the monoisotopic peak of another formula. Consider the formula exchange N vs. 13CH. Such isobaric signals would differ by about 8 mDa. An instrument with 50,000 resolving power could not distinguish these signals if they were present in a 1:1 ratio near m/z 500. However, an instrument with 90,000 resolving power is expected to resolve both of these signals even if one is 10 times more abundant than the other. Expected profile spectra generated using a Gaussian peak model are shown in Figure 1.

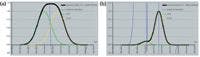
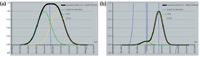
Figure 1: Resolution of isobars modeled near m/z 500: (a) An instrument operating at 52,000 resolving power would be unable to resolve the illustrated isobars present in a 1:1 ratio; (b) an instrument operating at 88,000 resolving power would be able to resolve the same isobars present in a 1:10 ratio.
Confirmation by LC–MS with Comprehensive Collision-Induced Dissociation
Unambiguous formula assignment achieved by high-resolution MS is not sufficient for confident identification; orthogonal information is required to discriminate amongst isomers and unresolved isobars. Chromatographic separation and collision-induced dissociation (CID) provide complementary structural selectivity to enable such discrimination. However, isolation of a single nominal m/z before CID diminishes two of the touted advantages associated with high resolution MS: the ability to mine data post hoc for analytes of interest and the ability to leverage accurate isotope abundance in formula generation. Comprehensive CID, in which all coeluted ions are simultaneously fragmented and analyzed, maintains the advantage of retrospective analysis and takes full advantage of a high-resolution mass analyzer.
Comprehensive CID must be accompanied by accurate spectral deconvolution that correctly reports product and precursor signals to be useful. Deconvolution algorithms have been developed that are capable of this; examples are shown with the results.
Post Hoc Signal-of-Interest Extraction
Selected reaction monitoring experiments performed with essentially 100% duty cycle are the benchmark for sensitive target analysis, but have no capability for retrospective data analysis. Furthermore, Thurman and Ferrer (1) discussed the concept of a crossover point between multiple reaction monitoring (MRM) experiments and high-resolution experiments. In an MRM experiment, each independently monitored reaction within a time segment dilutes sensitivity in a linear fashion. At some point, high resolution measurements become more sensitive than multiple reaction monitoring experiments.
Comprehensive CID retains full capability of post hoc data interrogation and allows some strategies for signal enhancement that are not available in an isolated ion CID experiment. For example, signals from different adduct species or fragments may be combined mathematically to enhance the signal. If noise is homogenous and random, adding a second m/z to an extracted ion chromatogram will theoretically improve the signal-to-noise ratio (S/N) as long as the second m/z has at least 41% abundance with respect to the first. Although the assumption of homogenous, random noise is not valid in high-resolution MS, this still provides some guidance for selecting signals to co-add.
Experimental
Materials
Methandrostenolone, stanozolol, 3-hydroxystanosolol, and 3-hydroxystanozolol-d3 (deuterated internal standard) were obtained from Cerilliant (Round Rock, Texas). Clostebol, 6β-hydroxyboldenone, and oxandrolone were obtained from Alltech (Deerfield, Illinois). LC–MS-grade water and methanol were obtained from Honeywell Burdick & Jackson (Morristown, New Jersey). LC–MS-grade formic acid and ammonia were obtained from Sigma-Aldrich (St. Louis, Missouri). Polyethylene glycol was obtained from Alfa Aesar (Ward Hill, Massachusetts). Urine samples were obtained from an antidoping surveillance program. The samples were blinded; no sample history was received, and no identification other than a sample number was given.
Sample Preparation
Samples were prepared using conventional procedures of hydrolysis followed by solid-phase extraction. Details have been given by Guice (2).
Flow-Injection Ultrahigh-Resolution MS
An Agilent 1290 series pump and autosampler were used for flow injection sampling (Agilent Technologies, Santa Clara, California).
The injection volume was 3 μL and the flow rate was 300 μL/min; the injection solvent consisted of a volume of 10% mobile-phase A and 90% mobile-phase B as described in the section discussing LC procedures.
Detection was achieved using a LECO Citius LC-HRT high-resolution TOF-MS system with an ESI source operated in positive-ion mode (LECO Corporation, St. Joseph, Michigan). The MS system was operated in ultrahigh-resolution mode, which yielded a mass resolving power of about 100,000 measured at FWHM. Spectral data were acquired from m/z 160 to m/z 600 at a rate of one spectrum every 0.3 s. The m/z axis was externally calibrated with a dilute (0.01%) solution of polyethylene glycol in methanol before analysis of the samples.
Consecutive duplicate injections of each sample were made. An injection was made approximately every 30 s, allowing sufficient time for flushing of the injection system between injections.
LC–MS with Comprehensive CID
An Agilent 1290 series pump, autosampler, and thermostated column compartment were used. A 50 mm × 2.1 mm, 2.2-μm dp Restek Ultra II C18 column was used (Restek Corporation, Bellefonte, Pennsylvania). Mobile-phase A was an aqueous solution of 26 mM formic acid and 1 mM ammonia that was prepared by adding 1 mL formic acid and 0.1 mL 25% aqueous ammonia to 1 L of water. Mobile-phase B was methanol. The flow rate was 360 μL/min. The mobile-phase composition was 10% B at time zero, followed by a linear gradient to 40% B at 0.25 min, and a linear gradient to 100% B at 6.25 min. 100% B was held isocratically for 1.5 min before re-equilibration at 10% B for 1.25 min. The injection volume was 5 μL and the column temperature was 40 °C.
Detection was achieved using a LECO Citius LC-HRT high-resolution TOF-MS system with an ESI source operated in positive-ion mode. The mass spectrometer was operated in high-resolution mode, which yielded a mass resolving power of about 50,000 measured at FWHM. Spectral data were acquired from m/z 75 to m/z 525. For one sequence of injections, MS with CID was performed at two alternating collision offsets: 10 V and 50 V. In a second sequence of injections, the alternating collision offsets were 15 V and 75 V. One spectrum at low collision offset and one spectrum at high collision offset were acquired every 0.3 s. During the first 20 s of the isocratic 100% methanol segment of the gradient, a dilute (0.01%) solution of polyethylene glycol in methanol was coinfused with the eluent, using a time-programmable syringe pump that is integrated with the mass spectrometer. This facilitated postacquisition recalibration of the m/z axis for each sample. Calibrant solution was not coinfused while any peaks of interest were being eluted, and background signals from the calibrant ions were reduced to negligible levels by the time the 100% methanol isocratic wash and gradient re-equilibration were complete.
Data Processing
All data was acquired and processed using LECO ChromaTOF-HRT software. Expected profile spectra shown in the theory section were generated in Microsoft Excel using a Gaussian model.
Results and Discussion
Screening with Flow-Injection Ultrahigh-Resolution MS
Screening indicated the possible presence of exogenous steroids in several samples. Figure 2a shows extracted ion traces for testosterone, THG, stanozolol, and hydroxylated metabolites of the latter two steroids. THG was designed specifically to evade detection by targeted analytical methods, and was used as an illicit ergogenic aid for several years before antidoping authorities discovered it. However, untargeted, direct, ultrahigh-resolution MS analysis indicates the presence of THG and a hydroxylated metabolite in at least one pair of replicate injections. Hydroxylated stanozolol and some unmetabolized stanozolol also are clearly seen in another pair of replicate injections.

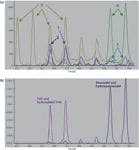
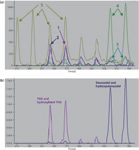
Figure 2: A segment of the ultrahigh resolution screening analysis: (a) extracted ion traces: 1 = THG, 2 = hydroxylated THG, 3 = stanozolol, 4 = hydroxylated stanozolol, 5 = testosterone;. (b) multiple signal correlation traces: greater than zero only if signals for an unmetabolized steroid and its hydroxylated metabolite correlate within a flow-injection peak.
There are several advantages to this screening approach. Direct analysis combines all isomeric hydroxylated metabolites into one signal, enhancing sensitivity for analytes that have multiple significant hydroxylation sites. However, the acknowledged limitation is that xenobiotic substances cannot be analyzed in the presence of isomeric endogenous compounds.
Another advantage is illustrated in Figure 2b. Here, settings in the data processing software were configured to return a nonzero trace only if signals from both an unmetabolized steroid and its hydroxylated metabolite correlate within a flow-injection peak. Requiring the presence of both parent and metabolite increases the confidence of positive results, and can allow these positive results to be easily spotted amongst a long series of injections.
Figure 3 shows a signal-rich spectrum that contains signals for THG and hydroxylated THG. Average resolving power within the displayed segment is more than 90,000. The analyte signals were assigned with relative m/z errors of -1.4 ppm for THG and -0.5 ppm for hydroxylated THG.

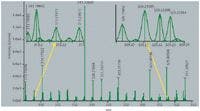

Figure 3: Ultrahigh resolution spectrum of a flow injection peak showing signals for THG (m/z 313.216) and hydroxylated THG (m/z 329.211).
Confirmation by LC–MS with CID
Steroid standards were obtained commercially and diluted as shown in Table I. The most concentrated solution of each analyte was analyzed using MS with comprehensive CID (MSc2), as described in the experimental section.

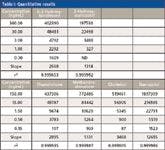
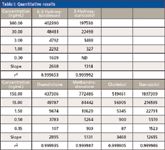
Table I: Quantitative results
Processing the acquired data yielded deconvolved precursor ion spectra that were aligned with corresponding deconvolved product ion spectra. Such spectra are complete with isotopes for all signals and adducts in some cases. Figure 4a shows the MSc2 of clostebol. Note that the two principal fragments differ by one carbon. This characteristic pattern of two major fragments differing by exactly 12 Da is commonly observed in steroid-derived drugs including clostebol, oxandrolone, testosterone, and others. Thus, this spectral feature could be used as a class-specific screen for other steroids with similar structures.

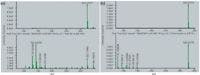
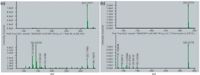
Figure 4: Deconvolved spectra: (a) clostebol at collision offsets of 10 V (top) and 60 V (bottom); (b) stanozolol at collision offsets of 10 V (top) and 75 V (bottom).
Figure 4b shows the deconvolved precursor ion and product ion spectra of stanozolol. Fragmentation of the presucor in a manner such as that observed here (and common among sterols) can make derivation of selective MRM transitions challenging. Comprehensive fragmentation allows all product ions to be monitored simultaneously, then combined together by data processing to yield an enhanced signal. This is not time-dependent nor is there a limit to the number of fragments to be correlated with a precursor ion. In addition, unlike MRMs, the product ions may in fact be correlated with one another to create signal enhancement in the chromatogram. Further enhancement in S/N is achieved by requiring selected precursor and product ions to be concurrently present before a nonzero signal is returned. Figure 5 shows the resultant enhanced extracted ion chromatograms for six steroids.

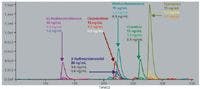
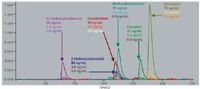
Figure 5: Overlaid enhanced extracted ion chromatograms for six steroids.
Figure 6 shows the deconvolved spectra of three coeluting steroids: oxandrolone, which fragments extensively at 60 V collision offset; methandrostenolone, which yields a few intense fragments at 60 V collision offset; and 3-hydroxystanozolol, which yields no measureable fragments at 60 V collision offset. Note that the oxandrolone and methandrostenolone signals are completely deconvolved from the 3-hydroxystanozolol spectra. Also, note that both oxandrolne and methandrostenolone yield intense fragments of nominal m/z 121. In a typical QqQ analysis, this could lead to cross-talk. However, high-resolution MS easily distinguishes these two fragments that represent a formula difference of CH4 vs. O.

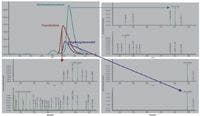
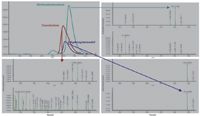
Figure 6: Deconvolved spectra of coeluting steroids, each at collision offsets of 10 V (top) and 60 V (bottom).
Quantitative results are listed in Table I. Figure 7 shows the unweighted least squares model for the lowest four levels of the stanozolol standard curve. Similar to a typical MRM analysis, the enhanced extracted ion chromatogram shows high selectivity and a robust linear correlation.

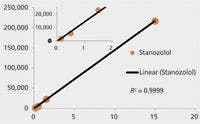
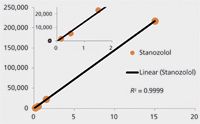
Figure 7: Unweighted least squares regression for the four lowest levels of stanozolol.
Comprehensive CID also yields more information for confirmation of analyte identity by facilitating the monitoring of several qualifier ions. A sample positive for stanozolol and hydroxylated stanozolol by the direct analysis screening method was analyzed using the MSc2 technique for confirmation. Two chromatographic peaks were observed in the resulting enhanced extracted ion chromatogram for stanozolol, and multiple hydroxylated stanozolol peaks were observed. Figure 8 shows enhanced extracted ion chromatograms for these analytes. Stanozolol, 3-hydroxystanozolol, and 3-hydroxystanozolol-d3 (the internal standard) are confirmed by comparison with authentic reference material. Based on the principal fragments, the other peaks may be an epimer of stanozolol and metabolites hydroxylated in positions other than the 3 position.

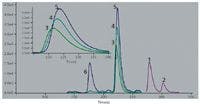
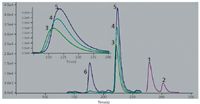
Figure 8: Stanozolol-related analytes detected in a sample: 1 = stanozolol; [M+H]+ = 329.259, principal fragment = 81.045; 2 = stanozolol-related; [M+H]+ = 329.259, principal fragment = 81.045; 3 = 3-hydroxystanozolol-d3 (internal standard); [M+H]+ = 348.272, principal fragment = 97.040; 4 = 3-hydroxystanozolol; [M+H]+ = 345.254, principal fragment = 97.040; 5 = hydroxystanozolol-related; [M+H]+ = 345.254, principal fragment = 81.045; 6 = hydroxystanozolol-related; [M+H]+ = 345.254, principal fragment = 81.045.
Conclusions
As we discussed here, significant advances continue to be made in high-performance MS. The gains achieved may allow new workflow strategies to be considered in the future.
Flow-injection ESI high-resolution MS can process sample at rates that are competitive with conventional robotic immunoassay platforms. However, because of the need to distinguish background ions from analyte ions, and from one another, a resolving power of about 100,000 is the minimum requirement to make direct MS analysis a viable alternative for high-throughput screening applications. Ideally, direct high-resolution MS should be preceded by sample cleanup procedures that are selective for particular compound classes. In addition, system stability (mass drift over short times) in the low parts-per-million range and inherent root-mean-square mass accuracies of approximately 1 ppm are required.
As the resolving power of commercial instruments continues to increase, this approach will become more practical for general screening. Compiling libraries of ions expected in certain matrices will become faster and discovery of unexpected substances will become more facile. In silico libraries will provide much of the information needed to make these effective.
MSc2 suits high-resolution analysis because it takes full advantage of a high resolution mass analyzer. MSc2 maintains the highest capability for retrospective data analysis and makes complete precursor and product ion spectra that are available for confirmation of analyte identity. The utility of these spectra depends on the accurate deconvolution algorithms. Algorithms that are capable of accurately distinguishing precursor and product ions of near-dead coelutions have been developed. Signals from deconvolved spectra can be adapted and combined to retrospectively extract highly selective quantitative information regarding any known or unknown analyte in the sample. Sensitivity remains independent of the number of signal combinations extracted.
The data described above demonstrate the overall utility of high-performance TOF-MS in the qualitative and quantitative analysis of drugs of abuse using one of the more challenging examples — sterols. The lower ionization efficiency and complex fragmentation make these less desirable and more challenging in MRM analyses. However, results indicate that high-performance TOF and the leveraging of high-resolution fragment ions provide both rapid screening and high-performance quantitative opportunities.
Erica A. Guice is with Western Slope Laboratory, LLC, in Troy, Michigan.
Kevin Siek, Jeffrey S. Patrick, Stephanie Amaya, and Joe Binkley are with the separation science division at LECO Corporation, in St. Joseph, Michigan. Please direct correspondence to: sepsci@leco.com.
References
(1) E.M. Thurman and I. Ferrer, in Liquid Chromatography Time-of-Flight Mass Spectrometry: Principles, Tools, and Applications for Accurate Mass Analysis (Wiley, Hoboken, New Jersey 2006) pp. 247–257.
(2) E.A. Guice, "Anabolic Androgenic Steroid Testing by Liquid Chromatography Quadrupole Time-Of-Flight Mass Spectrometry in Urine," presented at Mass Spectrometry Applications to the Clinical Lab, San Diego, California, 2011.


Newsletter
Get essential updates on the latest spectroscopy technologies, regulatory standards, and best practices—subscribe today to Spectroscopy.