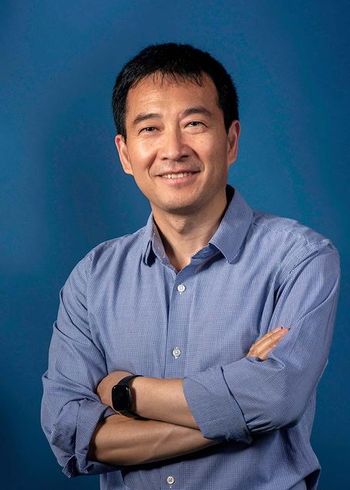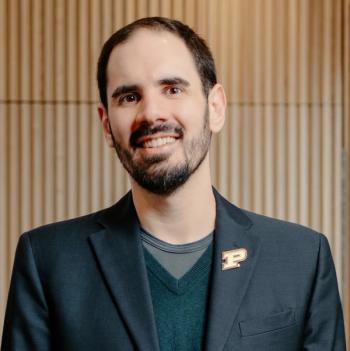
In the second part of our interview with Brandon Boor of Purdue University, he discusses how his team controls experimental variables during cleaning experiments in order to obtain interpretable data.
Are your ICP-OES or MS results affected by errors and interferences? Would you know for sure if they were? Attend this second event in our three-part webcast series to learn about the latest techniques to identify and highlight potential errors in ICP data. And find out how software and reporting tools can help you to be certain of the results you report. Live: Europe Broadcast: Tuesday, Jun. 2, 2020 at 9am EDT | 2pm BST | 3pm CEST US Broadcast: Tuesday, Jun. 2, 2020 at 2pm EDT | 1pm CST | 11am PDT On demand available after airing until Jun. 2, 2021.
Register Free:
Event Overview:
Part 2 of a 3 Part Series: Identifying and Mitigating the Errors and Interferences that can Affect ICP-OES and ICP-MS Data Quality
Errors and interferences can affect data quality in any sample type or application, and it’s not always easy for a user to identify when data has been affected. Methods evolve to require more elements to be measured at lower detection limits, and with faster analysis of a wider range of sample types. At the same time, there is increasing demand for quality data to be improved.
The common performance testing and QC approaches used in regulated methods – such as internal standard and spike recoveries, calibration verification standards, and analysis of reference materials – all have limitations. This can be a particular problem in applications involving high throughput analysis of samples with variable composition.
There is an urgent need to develop more robust ways to assess and verify data quality, and these approaches must also enable users to easily identify and report errors and interferences.
In this webcast, the second of a three-part series, we will explain the techniques available to deal with some common and some less familiar errors that affect ICP analysis. We will focus on the tools that are available to identify potential errors in typical sample types and applications. And we’ll show how a holistic approach to ICP data can be used to identify and correct for interferences, even those you weren’t aware of.
Key Learning Objectives:
Speakers: Ed McCurdy, ICP-MS Product Marketing, Agilent Technologies Inc.
Ross Ashdown, Optical Atomic Spectroscopy Marketing Manager, Agilent Technologies Inc.
Time and Date: Europe Broadcast: Tuesday, Jun. 2, 2020 at 9am EDT | 2pm BST | 3pm CEST
US Broadcast: Tuesday, Jun. 2, 2020 at 2pm EDT | 1pm CST | 11am PDT
On demand available after airing until Jun. 2, 2021.
Sponsor: Agilent Technologies
Register Free: