Key Takeaways
- A two-step neural network model developed by researchers significantly enhanced DFIR imaging by reconstructing high-resolution spectra from only seven wavenumbers and accurately predicting protein structural features.
- The model demonstrated high accuracy in reconstructing spectral images and quantifying protein structures, with metrics like mean absolute error (MAE), R², and SSIM confirming strong performance.
- Designed to be modality-agnostic, the model offers scalable and adaptable potential for broader chemical imaging applications and could be integrated with other AI tools and spectral regions in future research.
Recently, a study published in Applied Spectroscopy presented a two-step regressive neural network model that enhances discrete frequency infrared (IR) imaging for biomedical applications, particularly in analyzing protein secondary structures in tissue specimens relevant to neurodegenerative disease research (1). This new model was designed to address limitations of traditional methods, such as principal component analysis (PCA), by using only seven wavenumbers to interpolate high-resolution spectra and predict structural component areas under the curve (AUCs), achieving faster analysis and faster data acquisition (1).
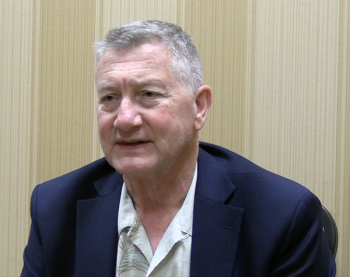
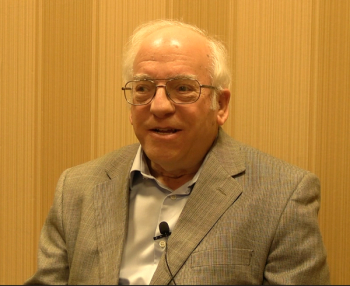
This study was conducted by a team of researchers, led by Ayanjeet Ghosh, who is a professor in the Department of Chemistry and Biochemistry at the University of Alabama. Along with one of his coauthors, Rohit Bhargava, who is a professor in the Department of Bioengineering at the University of Illinois, Urbana-Champaign, the two sat down with Spectroscopy to discuss their findings.
In the final part of this three-part interview, Ghosh and Bhargava talk about the key performance metrics they used to evaluate their model, and what the future of neurodegenerative disease research looks like.
What were some of the key performance metrics or validation methods you used to assess the accuracy of your model compared to traditional band fitting?
All spectra used for the training and testing of the AUC prediction model were simulated, allowing us to know the true area under the curve (AUC) values for each of the Gaussian components. This direct knowledge of ground truth enabled a rigorous and unbiased evaluation of model performance across a wide range of spectral conditions.
The mean absolute error (MAE) between the predicted AUC values and the ground-truth AUC values was used as a primary performance metric. This quantified how closely the model's predictions matched the known component distributions across the test set. The R² values were calculated between the predicted and ground-truth AUCs for each Gaussian component. High R² values indicated strong agreement between the model predictions and actual values, validating the model’s regression accuracy.
Structural Similarity Index Measure (SSIM) was used to validate the reconstructed spectral images. For example, the predicted image at 1628 cm⁻¹ compared to the real image yielded an SSIM of 0.9969, showing near-identical preservation of structural features during spectral reconstruction.
To assess robustness under varying signal-to-noise (S/N) ratio conditions, the model’s performance was compared against traditional Gaussian fitting. Across different S/N ratio levels, the model consistently outperformed Gaussian fitting, showing lower relative MAE and less degradation in predictive accuracy as noise increased.
In the context of neurodegenerative disease research, what kinds of structural protein differences were you able to detect using your model, and how do these findings contribute to disease characterization or diagnosis?
The model demonstrated the ability to clearly resolve β-sheet content within Alzheimer’s disease plaques, specifically corresponding to the 1628 cm⁻¹ band (AUC1). This spectral marker is widely associated with β-sheet structures, a hallmark of amyloid aggregation in neurodegenerative pathology.
Compared to traditional Gaussian fitting methods, the model produced spectral maps with lower background noise. This reduction in noise improves the clarity of plaque detection, particularly in our in-house observations, where conventional fitting sometimes amplified background artifacts that complicated feature identification.
By accurately and efficiently mapping the spatial distribution of parallel β-sheet content across tissue sections, the model enables more detailed studies of disease heterogeneity and progression. Although the focus of this work was demonstrating the viability of this approach, we anticipate expanded implementation of our model in future research efforts that use DFIR for tissue imaging.
However, beyond structural detection, the most immediate advantage of implementing this model is workflow efficiency. Imaging large tissue data sets is inherently time and resource intensive. Reducing the number of required spectral acquisitions by roughly sixfold, while still preserving critical molecular information, represents a major optimization for spectroscopic imaging and opens the door to scaling studies to larger patient cohorts.
Looking forward, how do you envision this model impacting future clinical or research applications of IR imaging, and are there plans to integrate it with other imaging modalities or AI tools?
Our combined model is designed to accomplish two simple yet key tasks in the context of spectroscopic imaging. First, it takes sparse, limited input data, which in isolation is only modestly informative, and molds it into something much more valuable for biological interpretation and clinical research. By drastically reducing the number of wavenumbers needed for acquisition (from 41 to 7), the model cuts experimental time by about 6-fold. Second, it shrinks the computational overhead dramatically compared to traditional Gaussian fitting methods. This makes it possible to extend protein quantification using infrared imaging to entire tissue sections and to much larger patient cohorts without overwhelming acquisition or processing capacity. Importantly, the general framework of the model is modality-agnostic and can be adapted for other forms of chemical imaging beyond DFIR, such as optical photothermal infrared (OPTIR) microscopy.
A key advantage of our approach is that the two neural network models can be used independently of each other. Hence, the upscaling model can be used only to reconstruct higher resolution spectral data from sparse inputs and subsequently used for analysis other than band fitting. Similarly, the second AUC prediction model can be applied to existing hyperspectral IR data specifically for protein structure characterization.
Although the current study focuses on a relatively small spectral region the approach is not restricted to this range. Future adaptations could expand to other spectrally rich regions, such as the 3-micron window (~2500–3700 cm⁻¹), where lipid, nucleic acid, and protein O-H and N-H stretching vibrations occur.
References
- Edmonds, H.; Mukherjee, S. S.; Holcombe, B.; et al. Quantification of Protein Secondary Structures from Discrete Frequency Infrared Images Using Machine Learning. Appl. Spectrosc. 2025, ASAP. DOI: 10.1177/00037028251325553
- The University of Alabama, Ayanjeet Ghosh. UA.edu. Available at: https://chemistry.ua.edu/people/dr-ayanjeet-ghosh/ (accessed 2025-05-01).
- University of Illinois, Urbana-Champaign, Rohit Bhargava. Illinois.edu. Available at: https://bioengineering.illinois.edu/people/rxb (accessed 2025-05-01).


