Top articles include the publication of a new terminology guide focused on data processing, machine learning, artificial intelligence (AI), and chemometrics.
In a recent study published in the journal AIP Advances, researchers used molecular and elemental spectroscopic techniques, such as laser-induced breakdown spectroscopy (LIBS), Raman spectroscopy, and Fourier transform infrared (FT-IR) spectroscopy, to characterize silicate gems found in ancient Egyptian mines (1).
For this study, the researchers examined a wide variety of gems, dating back to the era of the pharaohs. The team analyzed gem samples including peridot, beryl/emerald, amazonite, and amethyst to learn more about their chemical compositions. Doing so allowed the researchers to gain additional insight into ancient Egyptian history, which could potentially help determine trade routes in ancient civilizations (1). The researchers compared the gems to a sample of peridot uncovered in the Harrat Kishb lava field in western Saudi Arabia (1).
Gems are valuable artifacts in archaeology. Gemstones have great historical and cultural significance. By uncovering ancient gemstones, archaeologists can use them to piece together what an ancient society might have been like, and what the people living during that time valued. These artifacts embody both cultural significance and visual beauty. However, it can be challenging to find an effective and efficient detection method that can distinguish between natural and synthetic gemstones (1). Spectroscopic techniques can be helpful in this process.
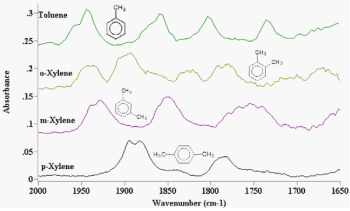
For example, LIBS is an effective technique that can distinguish different gem groups. By analyzing specific spectral windows, researchers identified unique characterizing elements for each gem variety. Raman and FT-IR spectroscopy also served as invaluable tools, offering distinct molecular fingerprints that can indicate potential alterations over time. FT-IR even unveiled specific functional groups responsible for the captivating colors seen in these gemstones.
In this study, three experimental methods were used, one for each spectroscopic technique. The experimental setup for LIBS analysis involved using a Q-switched Nd:YAG laser at a wavelength of 1064 nm. An Escelle spectrometer was coupled to an ICCD camera, and LIBS software was used to analyze the LIBS spectra (1). FT-IR analysis was conducted using a Model 4100 Jasco spectrometer working in the vibrational range of 400–4000 cm-1 wavenumber, using potassium bromide as a reference. Raman analysis was conducted with using a German-made confocal Raman microscope under the conditions of 473/532/633 nm laser excitation, z-focus, and a software-controlled x–y sample stage for line scanning and mapping (1).
Gem enthusiasts, historians, and gemstone traders stand to benefit from the ability to trace the origin and authenticity of gemstones, offering a tantalizing glimpse into the ancient past.
(1) Khedr, A. A.; Surour, A. A.; El-Hussein, A.; Abdelhamid, M. Characterization and discrimination of some gem silicate minerals adopting LIBS, FTIR, and Raman spectroscopic techniques. AIP Advances 2023, 13, 085101. DOI: 10.1063/5.0157623