Publication
Article
Spectroscopy
A Survey of Chemometric Methods Used in Spectroscopy
Author(s):
We provide a scorecard of chemometric techniques used in spectroscopy. The tables and lists of reference sources given here provide an indispensable resource for anyone seeking guidance on understanding chemometric methods or choosing the most suitable approach for a given analysis problem.
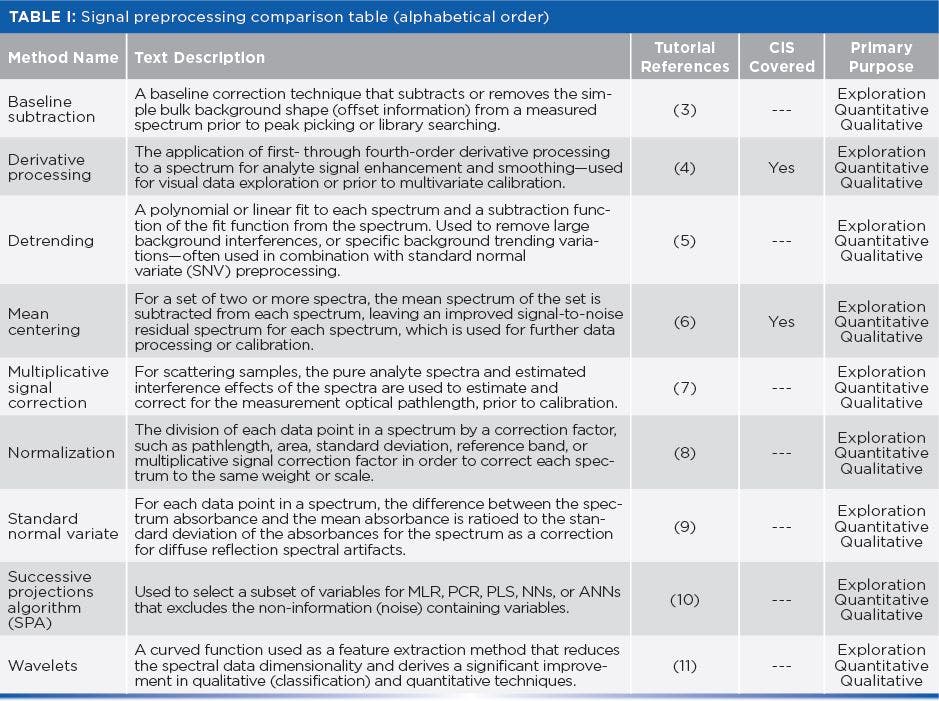
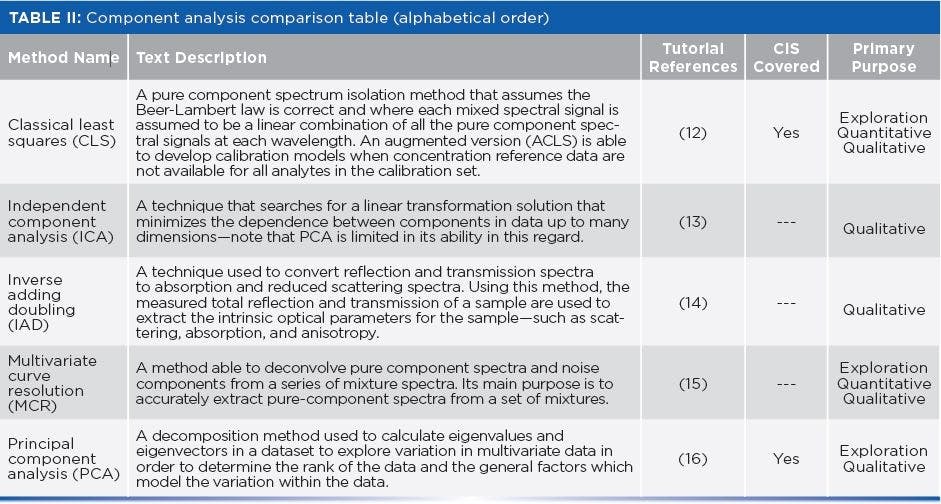
In writing this column over the years, we have covered many topics related to the use of statistics and chemometrics in spectroscopy. At this point, we are taking a break (so to speak) to build a scorecard of chemometric techniqu es consisting of topics we have either previously discussed or plan to discuss going forward. Although it is quite difficult to define these complex topics in short sentences, without the use of graphical or mathematical representations, we have attempted to do so here. In this column, we show method comparison tables of chemometric methods, and include the method name, a brief text description, key tutorial references, whether the method was previously discussed in detail within previous “Chemometrics in Spectroscopy” articles, and the primary analytical purpose of the method. In past articles, we have addressed many details associated with quantitative and qualitative spectroscopy, particularly the fine points of calibration methods, and we plan to continue to do so into the future. We note that we have already covered some aspects of signal preprocessing in the context of other topics, but have not addressed these in great detail. As we progress with this series, we intend to cover the essential chemometric methods in greater detail and expand into new frontiers.
A recently published book review of Chemometrics in Spectroscopy (2nd edition, Elsevier) recommended that the subjects of neural networks (NNs)and multivariate curve resolution (MCR) be covered, as well as other advanced chemometrics techniques that have not been described to date in our column series of the same name (1,2). Although we have addressed many topics in the column, there are still more to cover. Some of the techniques we have not addressed will receive attention in future columns. And to expand on that, at some point we hope to provide more information on available open source code and programming languages for chemometric methods, as well as commercial software options. We may not get to write detailed articles on all of the topics listed in the following tables, but, at some future time, we plan to discuss many more of them. We note that, for the tables below, we restricted ourselves to one tutorial or descriptive reference for each of the topics (rows), resulting in 29 additional references (3–31). These summary tables are an imperfect approach, because there are several (or many) very good references for each topic, but, given space limitations, we selected a single reference for each topic that we considered most applicable to Spectroscopy readers, and also tried to select those references that might be considered “classic,” or tutorial papers. As we delve into each subject or topic, we will include additional references that will be helpful to the reader in understanding and using the various chemometric methods.
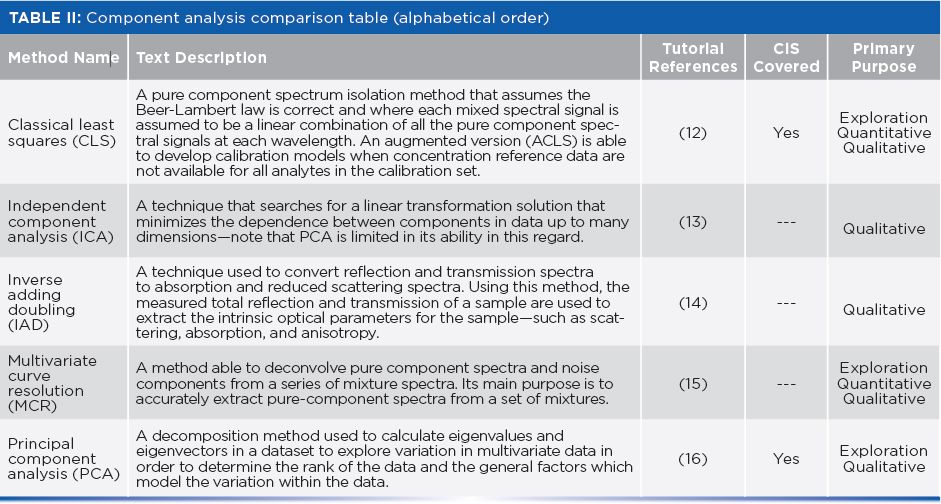
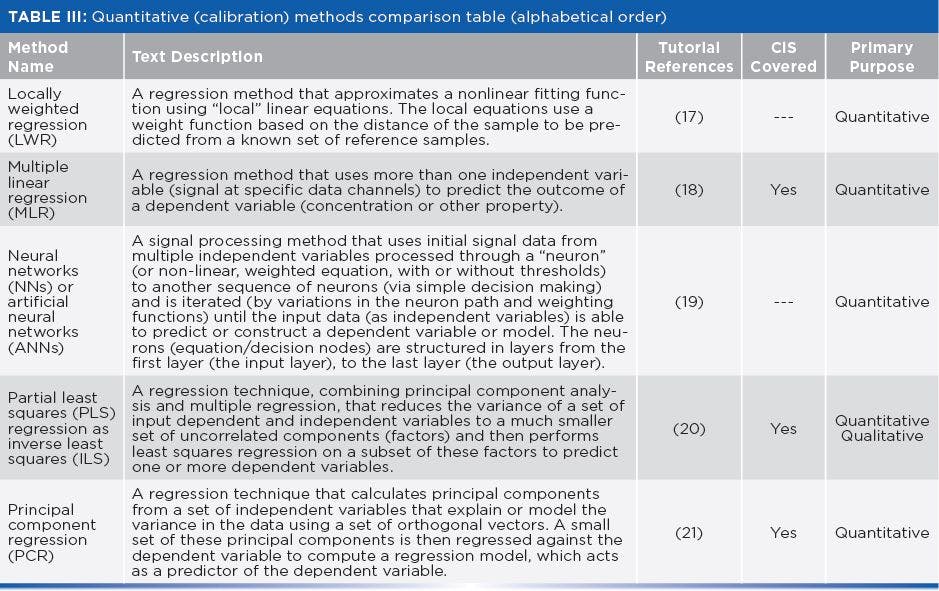
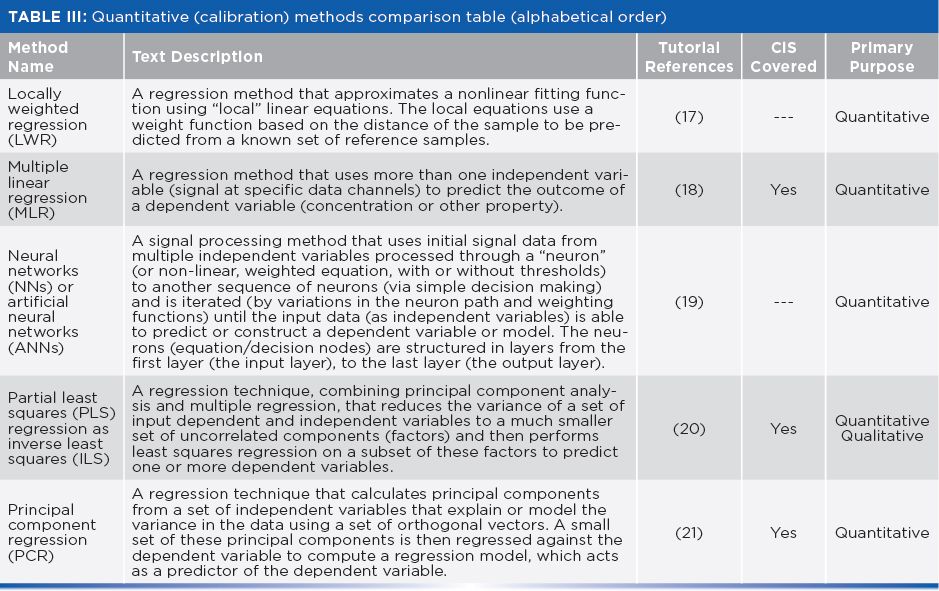
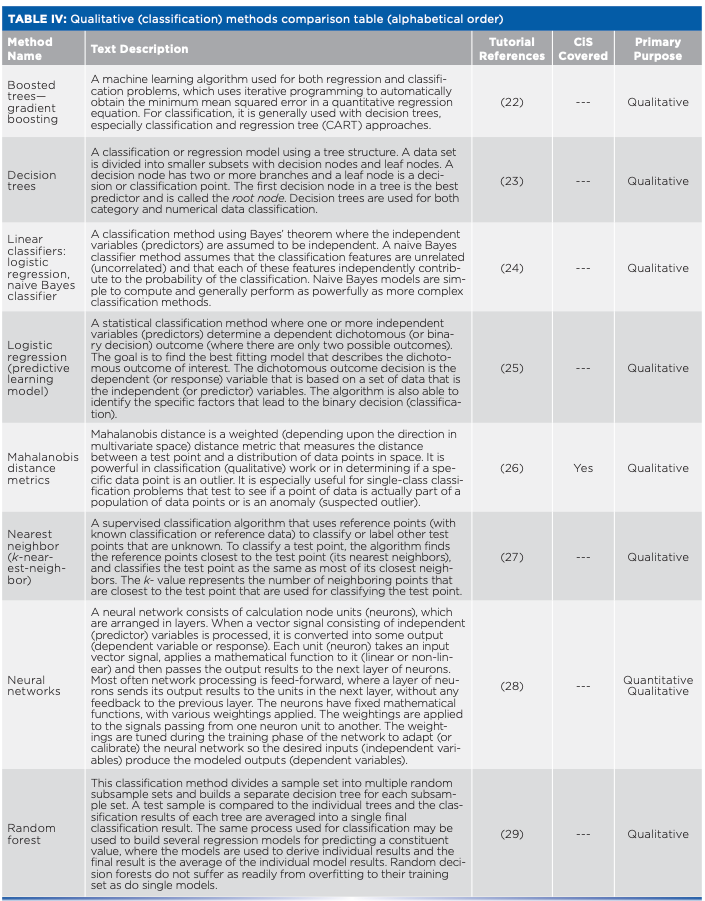
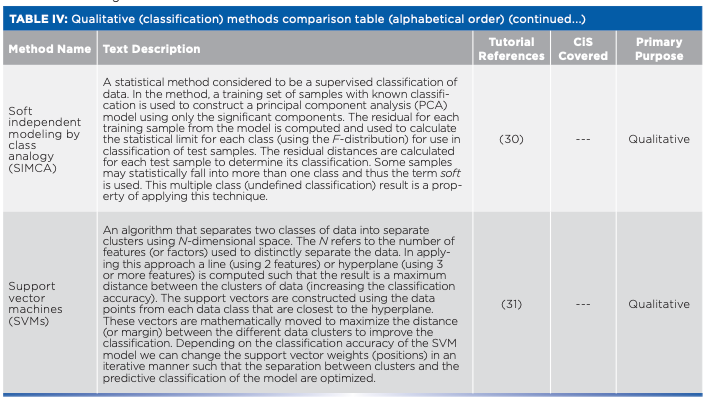
Table I represents signal preprocessing techniques; these data processing methods are often used prior to the application of explorative, qualitative, or quantitative methods. Table II lists component analysis techniques used mostly for data exploration and discovery. Table III shows the variety of quantitative (calibration) methods used to take raw or preprocessed data, and compute predictive calibration models for quantitative determination of physical or chemical parameters in a dataset. Table IV provides a summary of the qualitative (calibration) methods used to take raw or preprocessed data and compute predictive calibration models for qualitative (classification) of different groups or types of samples or of physical or chemical parameters in a dataset. As noted, because of space limitations, a single primary reference is included for each method.


References
- H. Yang, Spectroscopy 34(11), 40–42 (2019).
- H. Mark, and J. Workman Jr., Chemometrics in Spectroscopy, (Elsevier, Academic Press, London, United Kingdom, 2nd Ed., 2018).
Signal Preprocessing
Baseline Subtraction - A. Jirasek, G. Schulze, M.M.L. Yu, M.W. Blades, and R.F.B. Turner, Appl. Spectrosc. 58(12), 1488–1499 (2004).
Derivative Preprocessing - B. Zimmermann and A. Kohler, Appl. Spectrosc. 67(8), 892–902 (2013).
Detrending - B.K. Alsberg, W.G. Wade, and R. Goodacre, Appl. Spectrosc. 52(6), 823–832 (1998).
Mean Centering - A. Lorber, K. Faber, and B.R. Kowalski, J. Chemom.10 (3), 215–220 (1996).
Multiplicative Signal Correction - A. Kohler, J. Sulé-Suso, G.D. Sockalingum, M. Tobin, F. Bahrami, Y. Yang, J. Pijanka, P. Dumas, M. Cotte, D.G. Van Pittius, and G. Parkes, Appl. Spectrosc. 62(3), 259–266 (2008).
Normalization - N.B. Zorov, A.A. Gorbatenko, T.A. Labutin, and A.M. Popov, Spectrochim. Acta Part B At. Spectrosc. 65(8), 642–657 (2010).
Standard Normal Variate - R.J. Barnes, M.S. Dhanoa, and S.J. Lister, Appl. Spectrosc. 43(5), 772—777 (1989).
Successive Projections Algorithm (SPA) - M.C.U.Araújo, T.C.B. Saldanha, R.K.H. Galvao, T. Yoneyama, H.C. Chame, and V. Visani, Chemometr. Intell. Lab. Syst. 57(2), 65–73 (2001).
Wavelets - J. Trygg and S. Wold, Chemometr. Intell. Lab. Syst. 42(1–2), 209–220 (1998).
Component Analysis - Classical Least Squares (CLS)
D.M. Haaland and D.K. Melgaard, Appl. Spectrosc. 55(1), 1–8 (2001).
Independent Component Analysis (ICA) - J. Chen and X.Z. Wang, J. Chem. Inf. Comput. Sci. 41(4), 992–1001 (2001).
Inverse Adding Doubling (IAD - S. Prahl, “Everything I Think You Should Know About Inverse Adding-Doubling” (Oregon Medical Laser Center, St. Vincent Hospital, 2011), pp. 1–74.
Multivariate Curve Resolution (MCR) - A. De Juan, J. Jaumot, and R. Tauler, Anal. Methods 6(14), 4964–4976 (2014).
Principal Component Analysis (PCA) - E.J. Hasenoehrl and P.R. Griffiths, Appl. Spectrosc. 47(5), 643–650 (1993).
Quantitative (Calibration) Methods
Locally Weighted Regression - T. Næs and T. Isaksson, Appl. Spectrosc. 46(1), 34–43 (1992).
Multiple Linear Regression (MLR) - A. O’Neil, R. Jee, and A. Moffat, Analyst 123(11), 2297–2302 (1998).
Neural Networks (NN) - D. Svozil, V. Kvasnicka, and J. Pospichal, Chemometr. Intell. Lab. Syst.
39(1), 43–62 (1997).
Partial Least Squares (PLS) Regression (Inverse Least Squares) - P. Geladi, and B.R. Kowalski, Anal. Chim. Acta 185, 1–17 (1986).
Principal Components Regression (PCR) - P.J. Gemperline and A. Salt, J. Chemom. 3(2), 343–357 (1989).
Qualitative (Classification) Methods
Boosted Trees—Gradient Boosting - A. Natekin and A. Knoll, Front Neurorobot. 7, 21 (2013).
Decision Trees - A.J. Myles, R.N. Feudale, Y. Liu, N.A. Woody, and S.D. Brown, J. Chemom. 18(6), 275–285 (2004).
Linear Classifiers: Logistic Regression, Naive Bayes Classifier - I. Rish, “An Empirical Study of the Naive Bayes classifier,” In IJCAI 2001
Workshop on Empirical Methods in Artificial Intelligence 3(22), 41–46 (2001).
Logistic Regression (Predictive Learning Model) - M.G. Sowa, L. Leonardi, J.R. Payette, K.M. Cross, M. Gomez, and J. Fish, J. Biomed. Opt. 11(5), 054002 (2006).
Mahalanobis Distance Metrics - H.L. Mark and D. Tunnell, Anal. Chem. 57(7), 1449–1456 (1985).
Nearest Neighbor - U. Von Luxburg, Stat. Comput. 17(4), 395–416 (2007).
Neural Networks (For Classification) - W. Wu, B. Walczak, D.L. Massart, S. Heuerding, F. Erni, I.R. Last, and K.A. Prebble, Chemometr. Intell. Lab. Syst. 33(1), 35–46 (1996).
Random Forest - N.L. Afanador, A. Smolinska, T.N. Tran, and L. Blanchet, J. Chemom. 30(5), 232–241 (2016).
Soft Independent Modeling By Class Analogy (SIMCA) - O.G. Meza-Márquez, T. Gallardo-Velázquez, and G. Osorio-Revilla,
Meat Sci.86(2), 511–519 (2010).
Support Vector Machines (SVMs) - J. Luts, F. Ojeda, R. Van de Plas, B. De Moor, S. Van Huffel, and J.A. Suykens, Anal. Chim. Acta 665(2), 129–145 (2010).

Jerome Workman, Jr. serves on the Editorial Advisory Board of Spectroscopy and is the Senior Technical Editor for LCGC and Spectroscopy. He is also a Certified Core Adjunct Professor at U.S. National University in La Jolla, California. He was formerly the Executive Vice President of Research and Engineering for Unity Scientific and Process Sensors Corporation.


Howard Mark serves on the Editorial Advisory Board of Spectroscopy, and runs a consulting service, Mark Electronics, in Suffern, New York. Direct correspondence to: SpectroscopyEdit@mmhgroup.com


Newsletter
Get essential updates on the latest spectroscopy technologies, regulatory standards, and best practices—subscribe today to Spectroscopy.