Publication
Article
Spectroscopy
Enhanced Raman and Mid-Infrared Spectroscopic Discrimination of Geographical Origin of Rice by Data Mining and Data Fusion
Author(s):
Data mining and fusion of Raman and mid-infrared (mid-IR) spectra was studied to improve the identification ability for geographical origins of rice. Relative standard deviation (RSD) analysis can predict whether there are outlier Raman spectra. Hierarchical clustering analysis (HCA) can find out the potential outlier data, and then RSD analysis can finally determine the outlier data. The recognition accuracy of the model built by eliminating the outlier data was higher than that of the model using all the data. The identification accuracy of the data fusion model was 97.8%, 4.5% higher than that of the Raman and mid-IR models. The model was further applied to identify the geographical origins of 10 japonica rice varieties, with an accuracy of 96.7%. A combination of data mining and data fusion can enhance the discrimination ability for the geographical origin of rice using a combination of Raman and mid-IR spectroscopy.
Rice is one of the most important cereal crops. It is rich in protein, fat, carbohydrates, and other nutrients (1,2). Its quality is influenced by many factors, such as genetics, growing conditions, and processing (3). With living standards improving, geographical indication products are becoming more popular among consumers because of their better quality. Meanwhile, the phenomenon of confusion or adulteration appears, bringing unfair economic benefits to the fraudsters and destroying the credibility of consumers to producers (4). Therefore, it is necessary to develop a reliable tool to identify the geographical origin of rice for consumers, honest producers, retailers, and governments.
Sensory identification (5), biological identification (6,7), chemical identification (stable isotope [8,9]), trace elements (10,11), volatile components (12–14), and other technologies have been widely used to identify the geographical origin of rice. Among them, cheap and fast spectral technologies, combined with pattern recognition methods, are becoming more popular, and are generally used in the analysis of multicomponent samples. The literature reports the application of Raman spectroscopy in identifying the geographical origin of rice. For example, Hwang and others reported the identification of Korean and imported rice with the recognition accuracy of 98% (15). Kim and co-authors identified rice that came from China and Korea with the recognition accuracy of 96% (16). Feng and others identified rice that originated from different provinces in China with the highest recognition accuracy of 100% (17,18). Most of the rice samples used in these studies are shelled rice grains, so only the information of components outside the rice grains are collected. It is well known that the weight percentages of carbohydrates, protein, fat, and water in rice grains are about 70–80%, 7–8%, 1–2%, and 11–12%, respectively, and the distribution of the components in rice grains is inhomogeneous (19). Besides, the rice processing technology, such as polishing, will cause differences on the surface of rice. Therefore, the Raman spectra obtained are insufficient to reflect the information of the whole composition of rice. To analyze the rice grains accurately, they need to be pulverized and sieved to obtain the rice flour sample as evenly as possible (20). In addition, the existing literature focused on the identification of geographical origins and varieties of rice and other inhomogeneous products mainly obtain the spectral information based on the average of two or three measurements (21). The possibility of outlier data caused by large fluctuations is not taken into account, and the accuracy of the data by taking the average is unknown. To make the obtained spectra reflect the sample information more comprehensively, it is necessary to collect enough spectra and eliminate the outliers.
As the growing environment changes, so does the content or structure of components in rice, thus the position and intensity of the absorption peaks of infrared spectra are different, and these differences can be used to reflect the regional characteristics of rice products (22). Xia and colleagues used near-infrared spectroscopy (NIR) and Fisher’s linear discriminant to discriminate Xiangshui rice with the accuracy of 100% (23). In the discrimination of non-Xiangshui rice originated from nine provinces, 92.3% of the modeled samples were classified correctly, and 90.9% of the validated samples were correctly discriminated. Compared with the NIR spectrum, the absorption peak of the mid-IR spectrum is usually sharper, with good resolution and high peak value. Nowadays, the updated mid-IR spectrometer in the market does not require sample preparation, greatly saving testing time, and is an ideal fast detection technique. However, the application of mid-IR spectroscopy in identifying the geographical origin of rice is rare.
The above methods for identification of the geographical origin of rice are mostly based on a single technique that can not reflect the composition information of rice sufficiently. For example, artificial falsification of specific chemical indicators will cause serious interference to chemical identification methods, so the reliability of identification results is poor. Moreover, the existing identification methods are commonly aimed at rice samples grown in different countries or different provinces in the same country. The geographical areas are far apart from each other, making identification relatively easy. There have been many reports on the application of data fusion technology in food quality detection (24,25). Sun and others established a model for identifying official rhubarb using NIR spectroscopy and mid-IR spectroscopy, using data fusion strategies to improve the classification model and allow the correct classification of all the samples (26). Hohmann and associates can effectively distinguish a total of 205 tomato samples of nine varieties from seven farms with an accuracy rate of 95 to 100% by combining proton nuclear magnetic resonance, mid-IR spectroscopy, and isotope ratio mass spectrometry (27). According to the literature, data fusion of Raman and infrared spectra for geographical identification of rice is rarely reported.
Therefore, in this work, rice products grown in four geographical regions (Xijiang, Panjin, Jiansanjiang, and Wuchang) in northeast China were taken as representative examples to develop an excellent identification model. Rice samples were refined, crushed, and screened to obtain relatively uniform rice flour samples. Raman and mid-IR spectra were obtained. Outlier Raman spectra were eliminated. A model was established by support vector machine based on data fusion of Raman and infrared spectra aimed at improving the identification accuracy and reliability for geographical origins of rice. Finally, the promotion and application value of the established method and model were studied in 10 kinds of rice.
Materials and Methods
Samples
For this experiment, 10 types of geographical indication rice products were collected from different areas of China, as seen in Figure S1. Fangzheng rice, Jiansanjiang rice, Wuchang rice, and Xiangshui rice were all grown in Heilongjiang province. Yanbian rice and Xijiang rice were both grown in Jilin province. Xinghua rice and Heheng rice were grown in Jiangsu province. Panjin rice was grown in Liaoning province. Yutai rice was grown in Shandong province. All of the rice samples were cultivated in 2017 and 2018, and collected in different planting areas to ensure they are representative of the samples. Xijiang, Panjin, Jiansanjiang, Wuchang, Xiangshui, Yanbian, Fangzheng, Heheng, Xinghua, and Yutai rice were collected from 18, 30, 21, 21, 30, 15, 33, 21, 21, and 33 positions, respectively. Two samples were collected in each position, each sample took about 2 kg of rice, and all the samples were japonica rice with specific varieties.


FIGURE S1: Geographical origin of the 10 kinds of rice.
Instruments and Equipment
Rice milling process mainly used paddy huller (NA12345) and rice mill (NA-JCB) which were both produced by Kemai Instrument Co., Ltd. A vertical grinder (15B, Baling Electric Appliance Co., Ltd.) was used to crush rice samples, and the diameter of stainless steel sieve in it was 0.6 mm. Raman spectra were recorded using a portable laser Raman spectrometer (Prott-ezRaman-d3, Enwave Optronics), samples were simply transferred on a quartz glass with 2 mm thick. Mid-IR spectra were recorded using an attenuated total reflectance (ATR) Fourier transform infrared spectrometer (Nicolet IS-10, Thermo Fisher Scientific).
Methods
Sample Preparation
Rice samples were processed according to the requirements of the first grade japonica rice in GB/T 1354-2018. Then, 20 g of each grain sample was slowly added to the grinder within half a minute and crushed for 2 min to ensure complete crushing. The rice flour obtained was screened by 100 and 140 mesh sieves successively. Rice flour with the size of 100–140 mesh was stored in a freezer and balanced to room temperature in a dryer before spectral analysis.
Spectrum Collection
The parameters for Raman spectrum acquisition were as follows. The excitation wavelength of laser was 785 nm, the laser power was 450 mW, the temperature of the charge-coupled detector (CCD) detector was -85 °C, the spectrometer operated from 250 to 2339 cm-1 with a resolution of 1 cm-1, and the number of scans was three with each having an accumulation time of 4 s. Five replicated spectra were acquired at different positions for each sample. The total test time of a sample was about 2 min, including sample loading, testing (five times), spectrum saving, and desktop cleaning.
The parameters for the mid-IR spectrum acquisition were as follows: The spectrometer operated from 525 to 4000 cm-1 with a resolution of 0.4821 cm-1, and each sample was scanned 32 times. An appropriate amount of rice flour was covered on the testing window and was compacted for test subsequently. All the samples were analyzed in triplicate. The total test time of a sample was about 2.5 min.
Data Analysis
To remove interfering and irrelevant information from the original spectral data, pretreatment should be done before data analysis. In this work, Raman spectra and mid-IR spectra were denoised by a wden wavelet function (28), which eliminated the effect of scattering by multiplicative scatter correction (29), and normalized by the mapminmax function (30) successively. As Raman measurement was relatively interfered by the environment and instrument, relative standard deviation (RSD) analysis and hierarchical clustering analysis (HCA) (31,32) were comprehensively applied to eliminate outliers. Then, the average Raman spectrum and mid-IR spectrum for each sample were taken as the representative spectra. Finally, a support vector machine (SVM) (33) was used to establish the model, with the radial basis function (RBF) (34) being used. In addition, Gamma and C parameters were optimized by a grid search technique within the region of 10-5 to 105. The data of one sample of each sampling point was used as the training set, and the data of the another sample was used as the prediction set. All of the data preprocessing and model construction were based on Matlab 2019b.
Results and Discussion
Spectrum Analysis
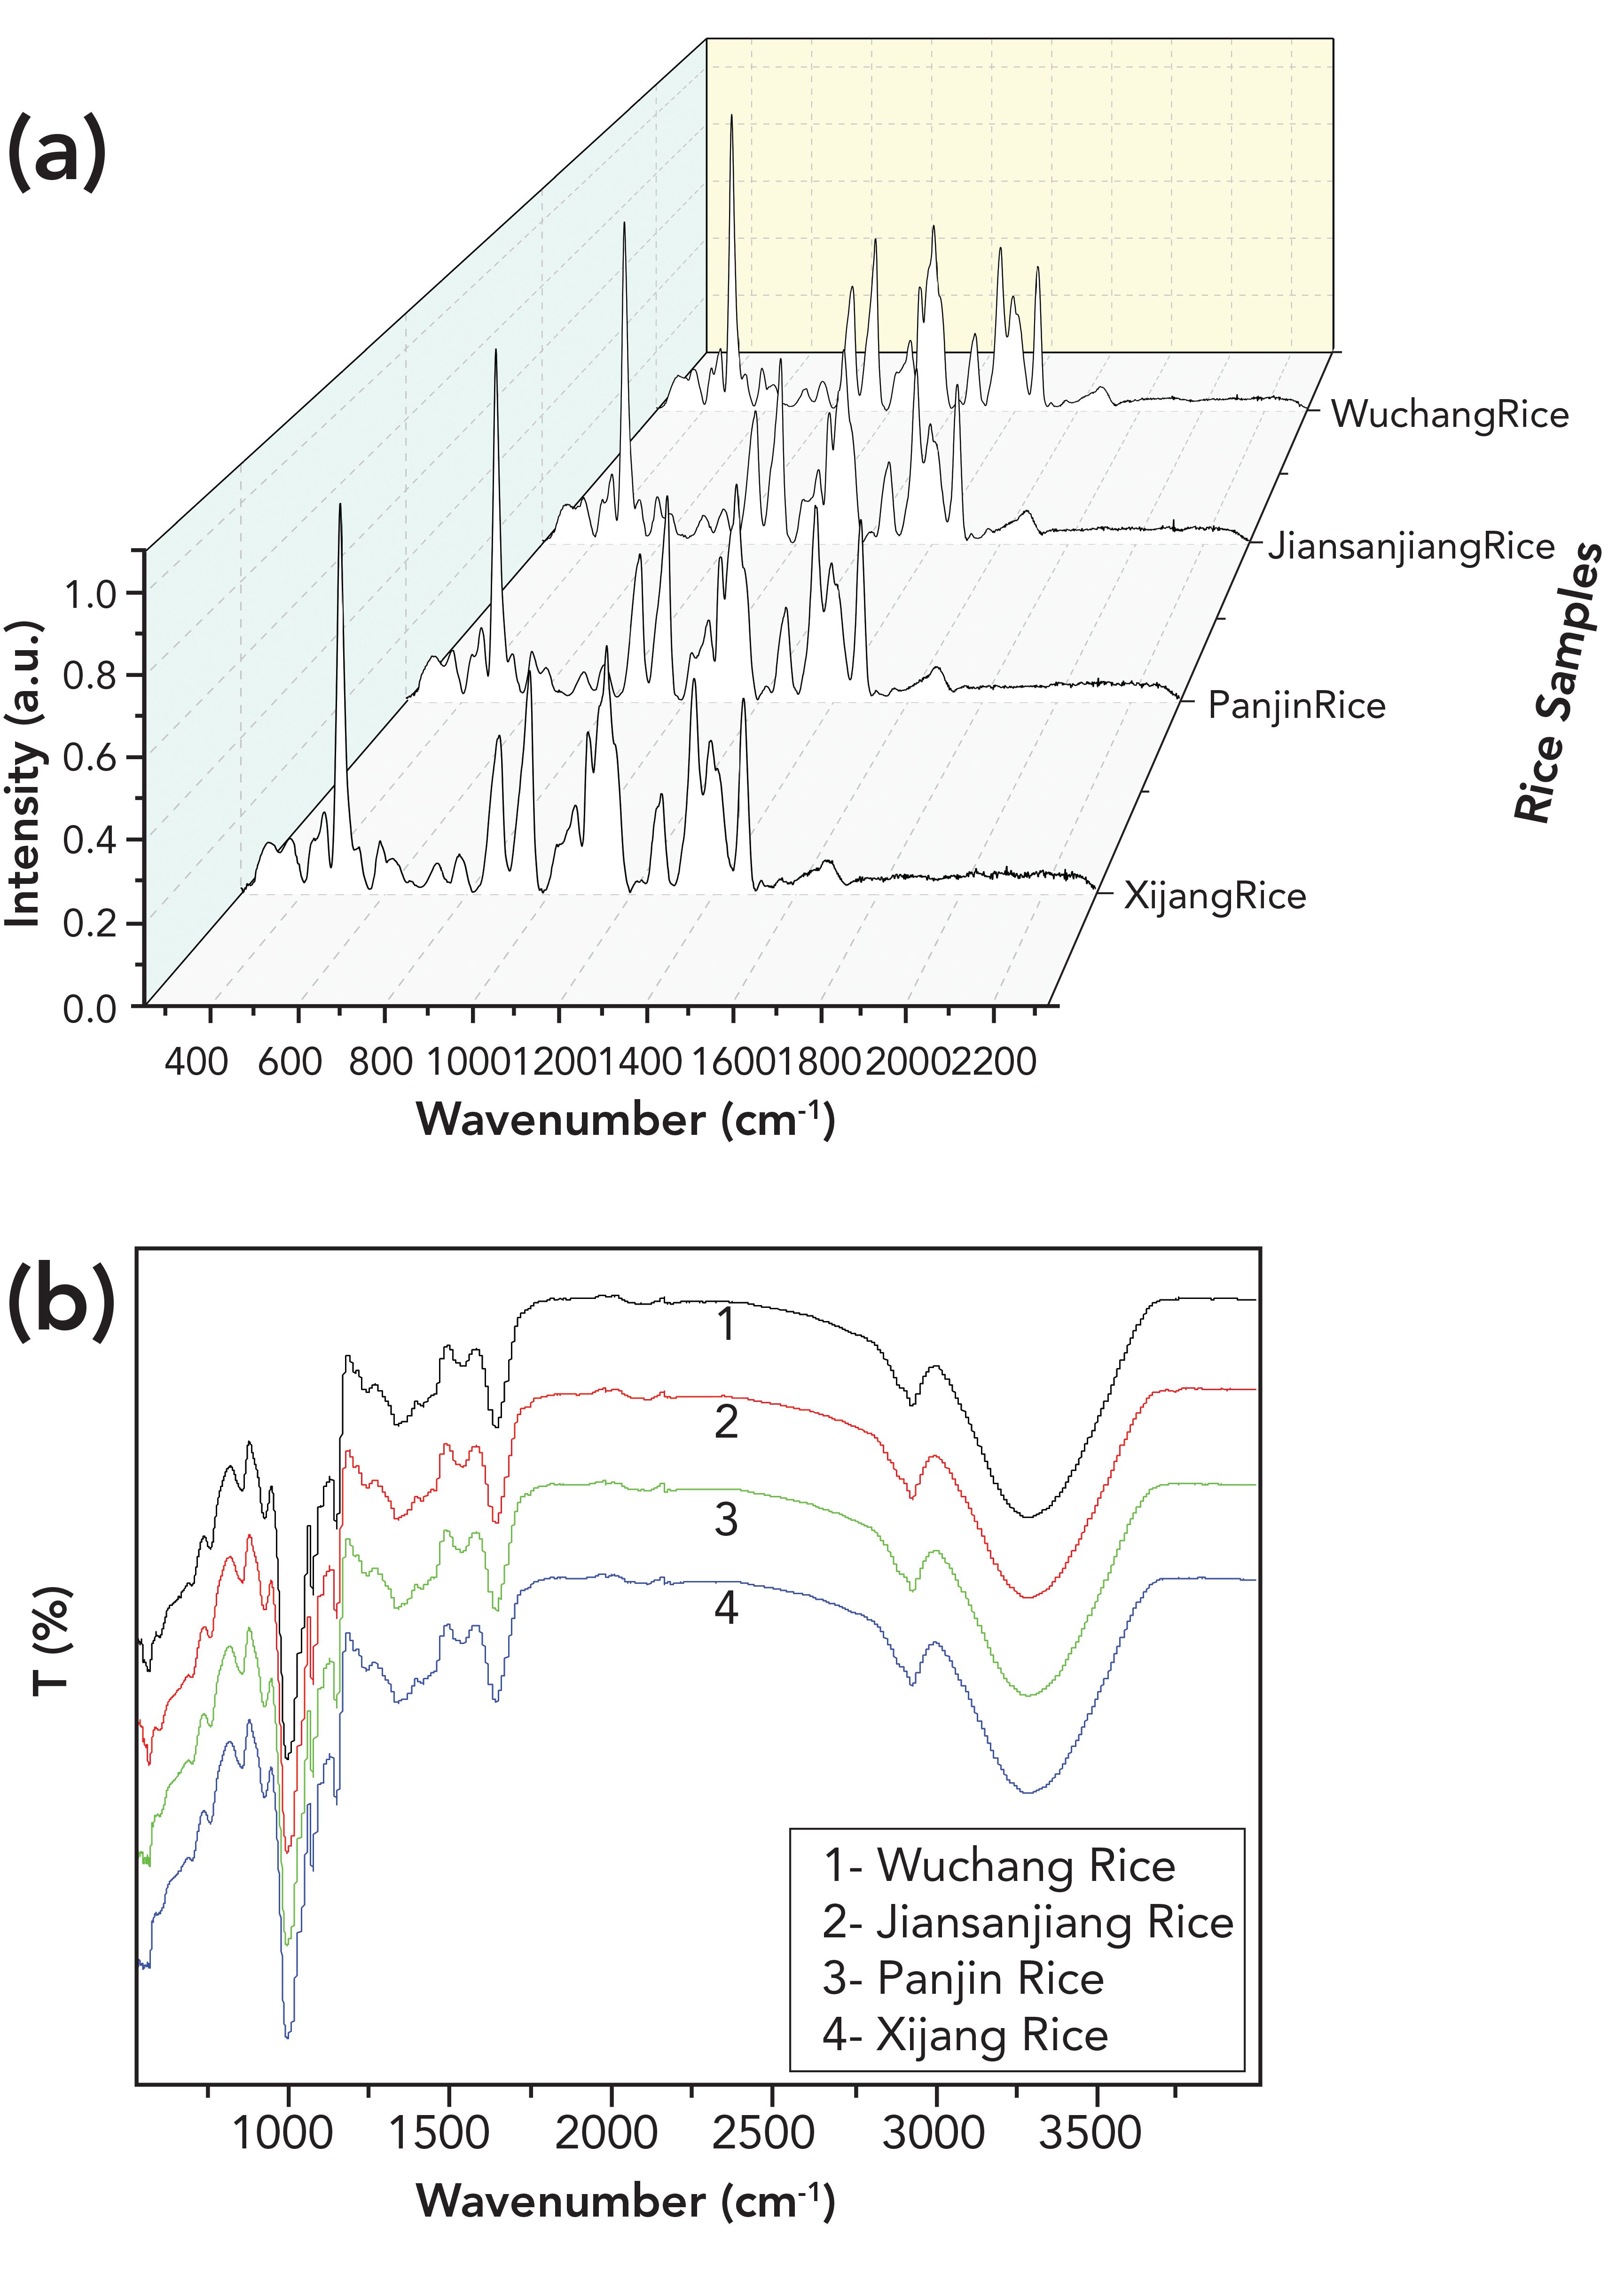
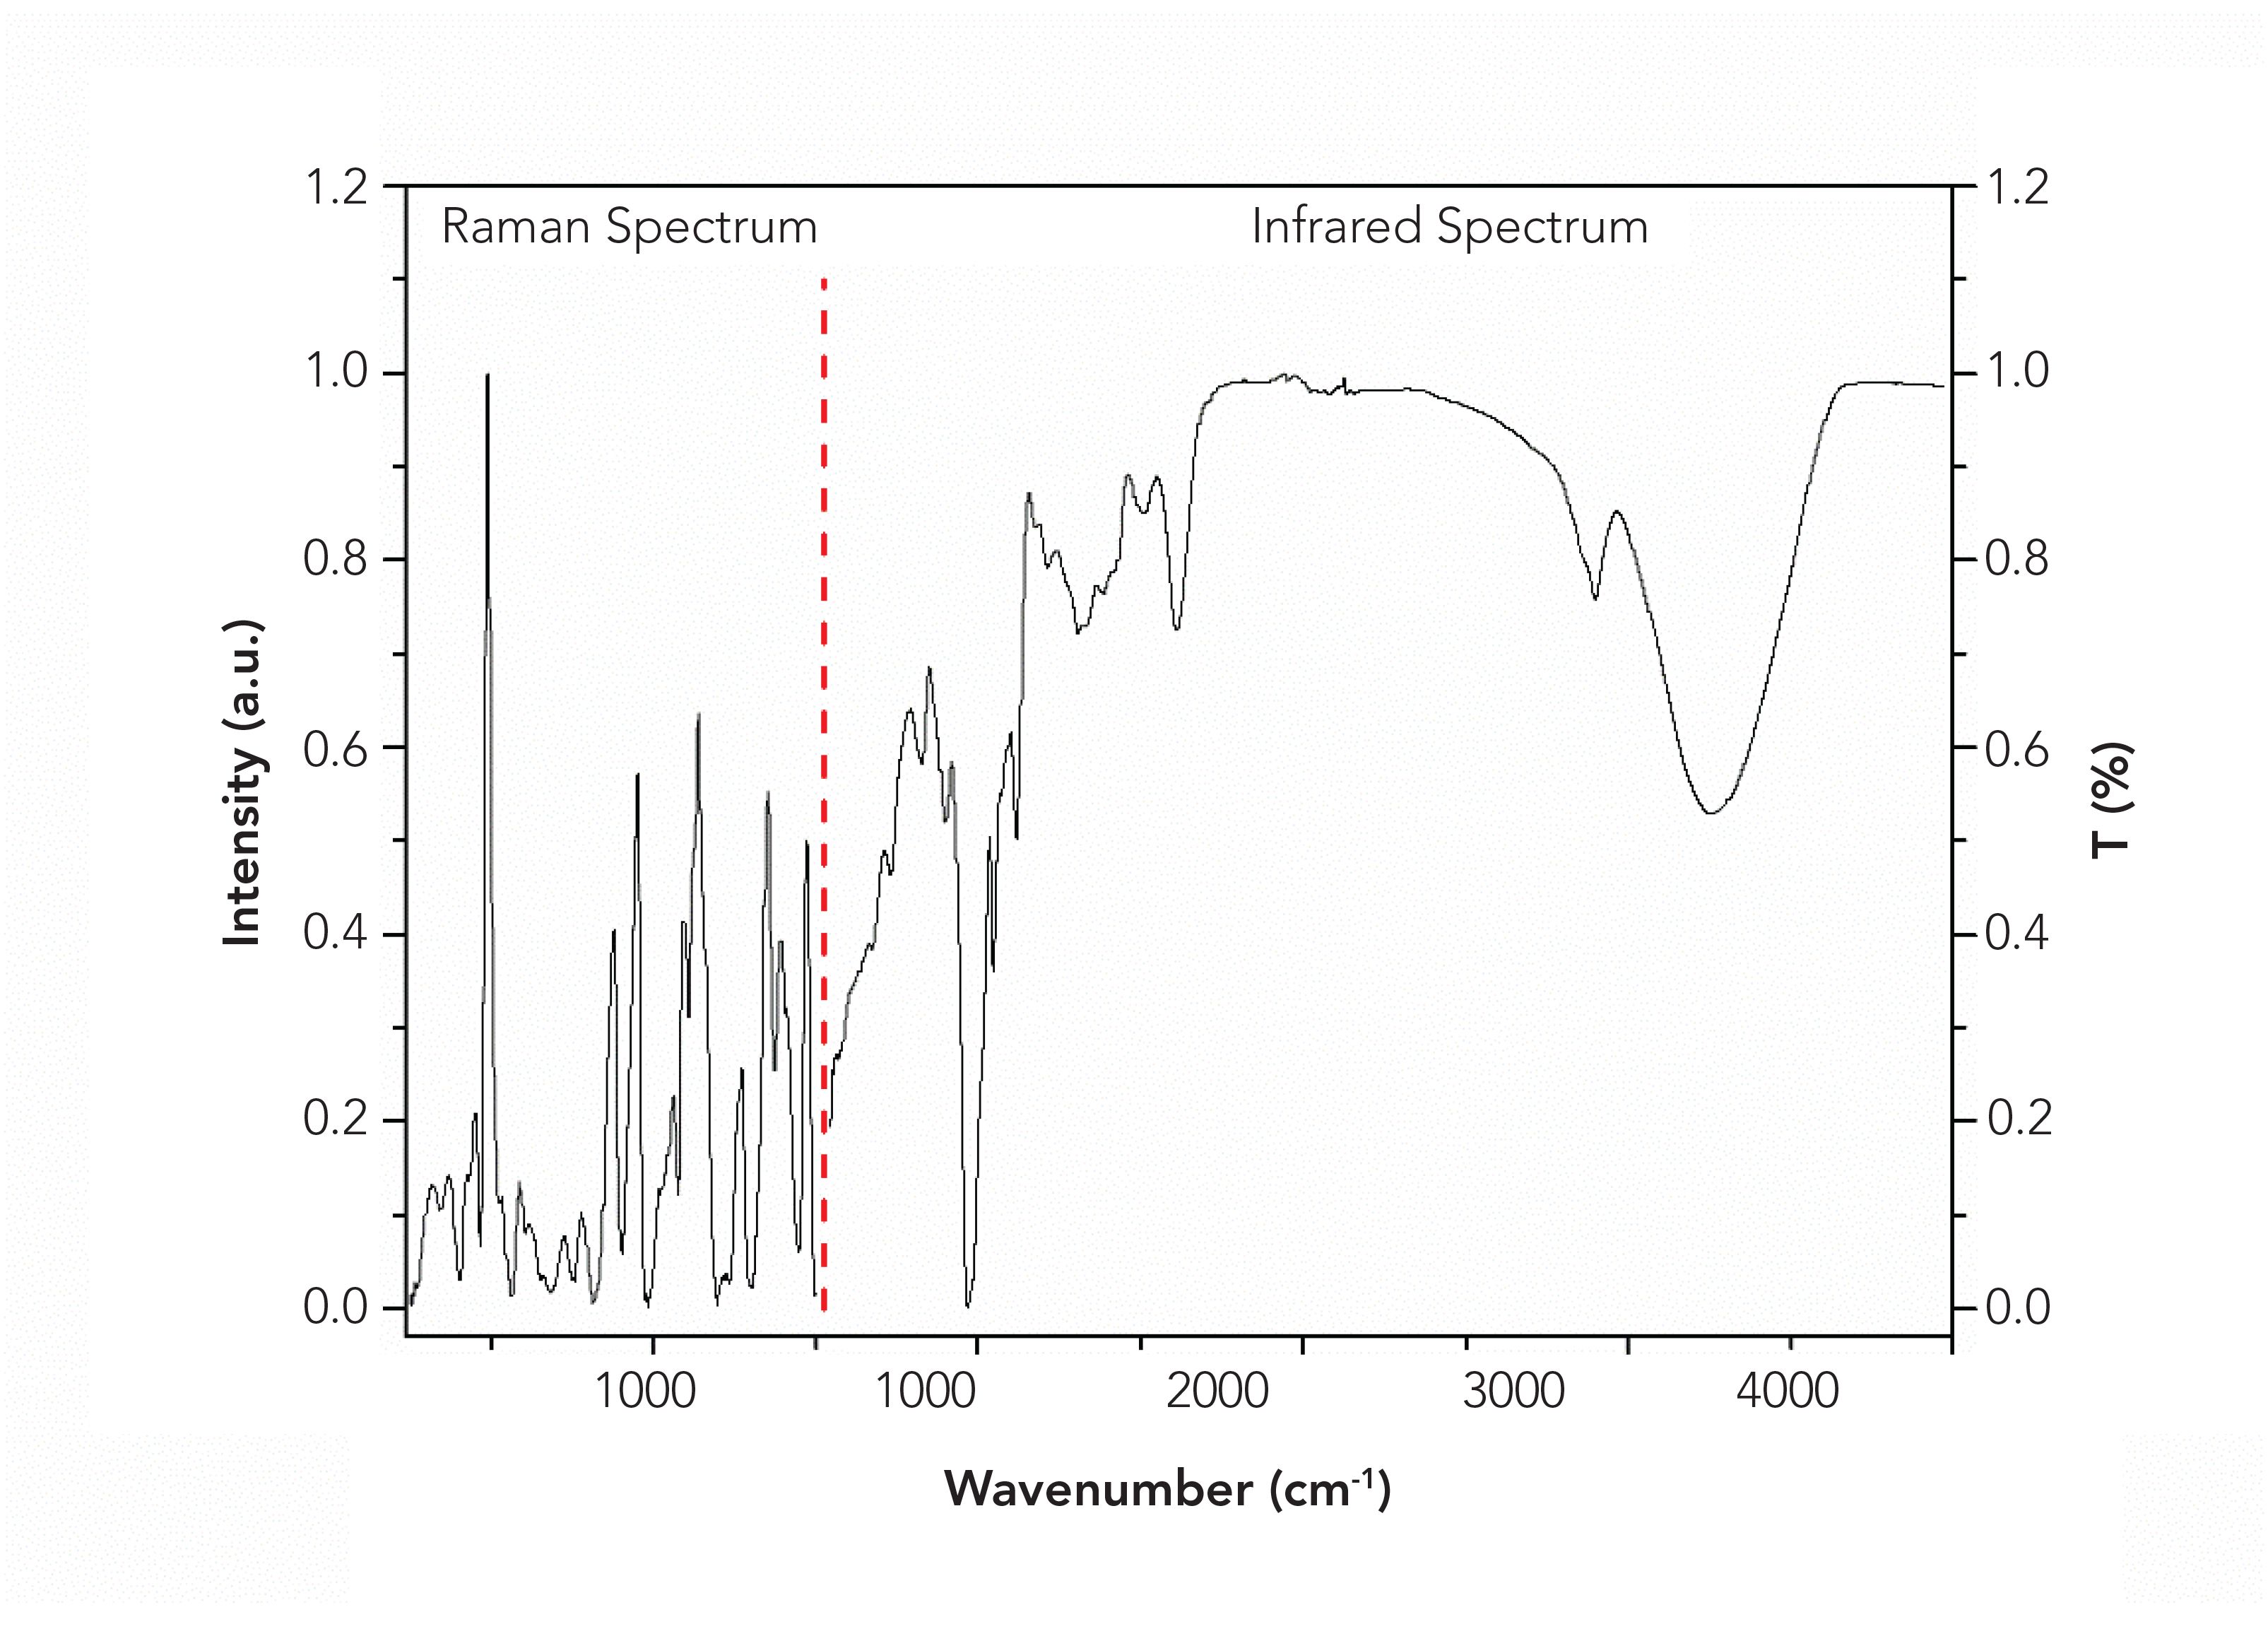
Taking Xijiang, Panjin, Jiansanjiang, and Wuchang rice as examples that originated from three neighboring provinces in northeast China, the spectra of sample 1 in position 1 were pretreated and shown in Figure 1. The peaks of Raman spectra mainly located in the region of 251–1500 cm-1, especially located at 492, 878, 952, 1094, 1126, 1139, 1273, 1351, 1390, and 1474 cm-1. Through RSD analysis, it was found that the bands with high stability of mid-IR spectra located at 578–4000 cm-1, and the peaks mainly occurred at 859, 928, 997, 1080, 1150, 1640, 2930, and 3290 cm-1. Therefore, the data of these regions were adopted for subsequent analysis. As seen in Figure 1, the spectra of the four kinds of rice from different producing areas were highly similar which were difficult to be recognized by naked eyes.

 Raman and (b) mid-IR spectra of the four kinds of rice after pretreatment.")
FIGURE 1: Typical (a) Raman and (b) mid-IR spectra of the four kinds of rice after pretreatment.
Model Analysis
Geographical Identification of Rice by Raman Spectroscopy
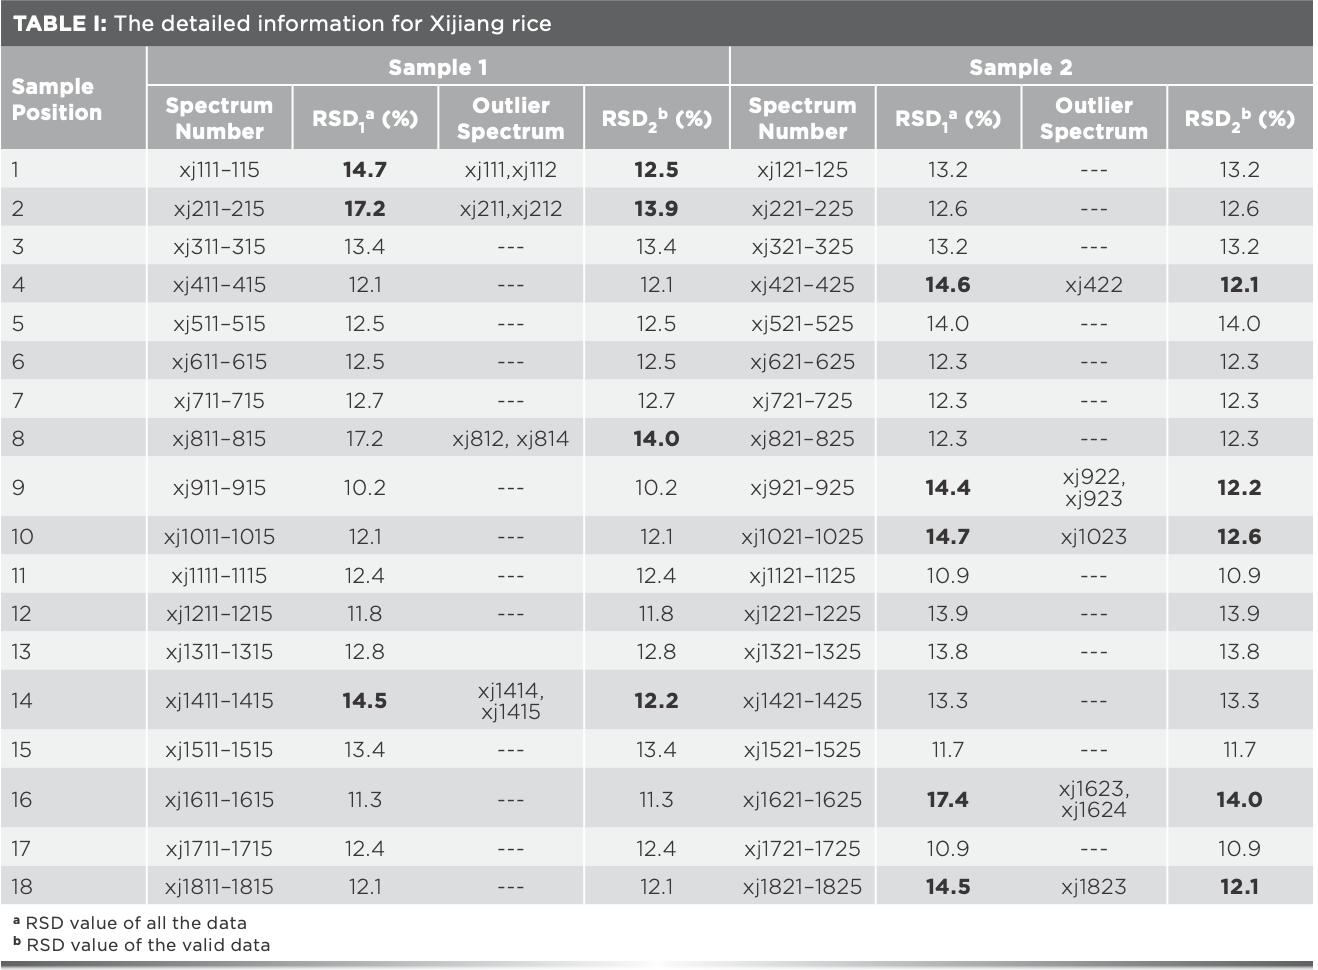
In the region of 251–1500 cm-1, taking Xijiang rice as an example, RSD values of the five Raman spectra of each sample are shown in Table I. Because of the fluctuation of instrument and environment, inhomogeneity of rice flour, and some man-made factors, the RSD values generally fluctuated below 14%. Among them, the RSD value of some rice samples were so large that there might be outlier data.


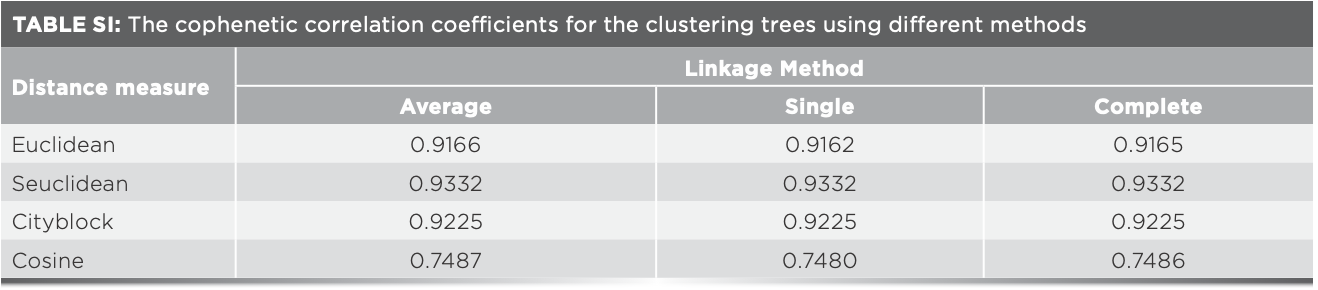
The HCA of five Raman spectra of each sample was performed to find out the possible outlier spectrum intuitively. Euclidean distance (35), standard Euclidean distance, city block distance, and the congruence coefficient (cosine) (36) were used as distance measures to quantify the similarity between spectra. Linkage methods, such as average linkage (37), single linkage, and complete linkage, were applied to construct the clustering tree (38). Taking sample 1 of Xijiang rice in position 2 for example, the values of cophenetic correlation coefficient for different methods were calculated and shown in Table SI. The best created clustering tree using seuclidean distance measure and average linkage method was shown in Figure 2a. Spectra 1 and 2 had high similarity and were clustered together while spectra 3–5 clustered together. The distinction between spectra 1 and 2 and spectra 3–5 was very obvious. However, it was still difficult to judge the outlier data.


 the five Raman spectra of sample 1 of Xijiang rice in position 2, (b) the ten Raman spectra of Xijiang rice in position 2 (spectra 1–5 refer to xj211–215 while spectra 6–10 refer to xj221–225 in Table I).")
FIGURE 2: Clustering trees for (a) the five Raman spectra of sample 1 of Xijiang rice in position 2, (b) the ten Raman spectra of Xijiang rice in position 2 (spectra 1–5 refer to xj211–215 while spectra 6–10 refer to xj221–225 in Table I).
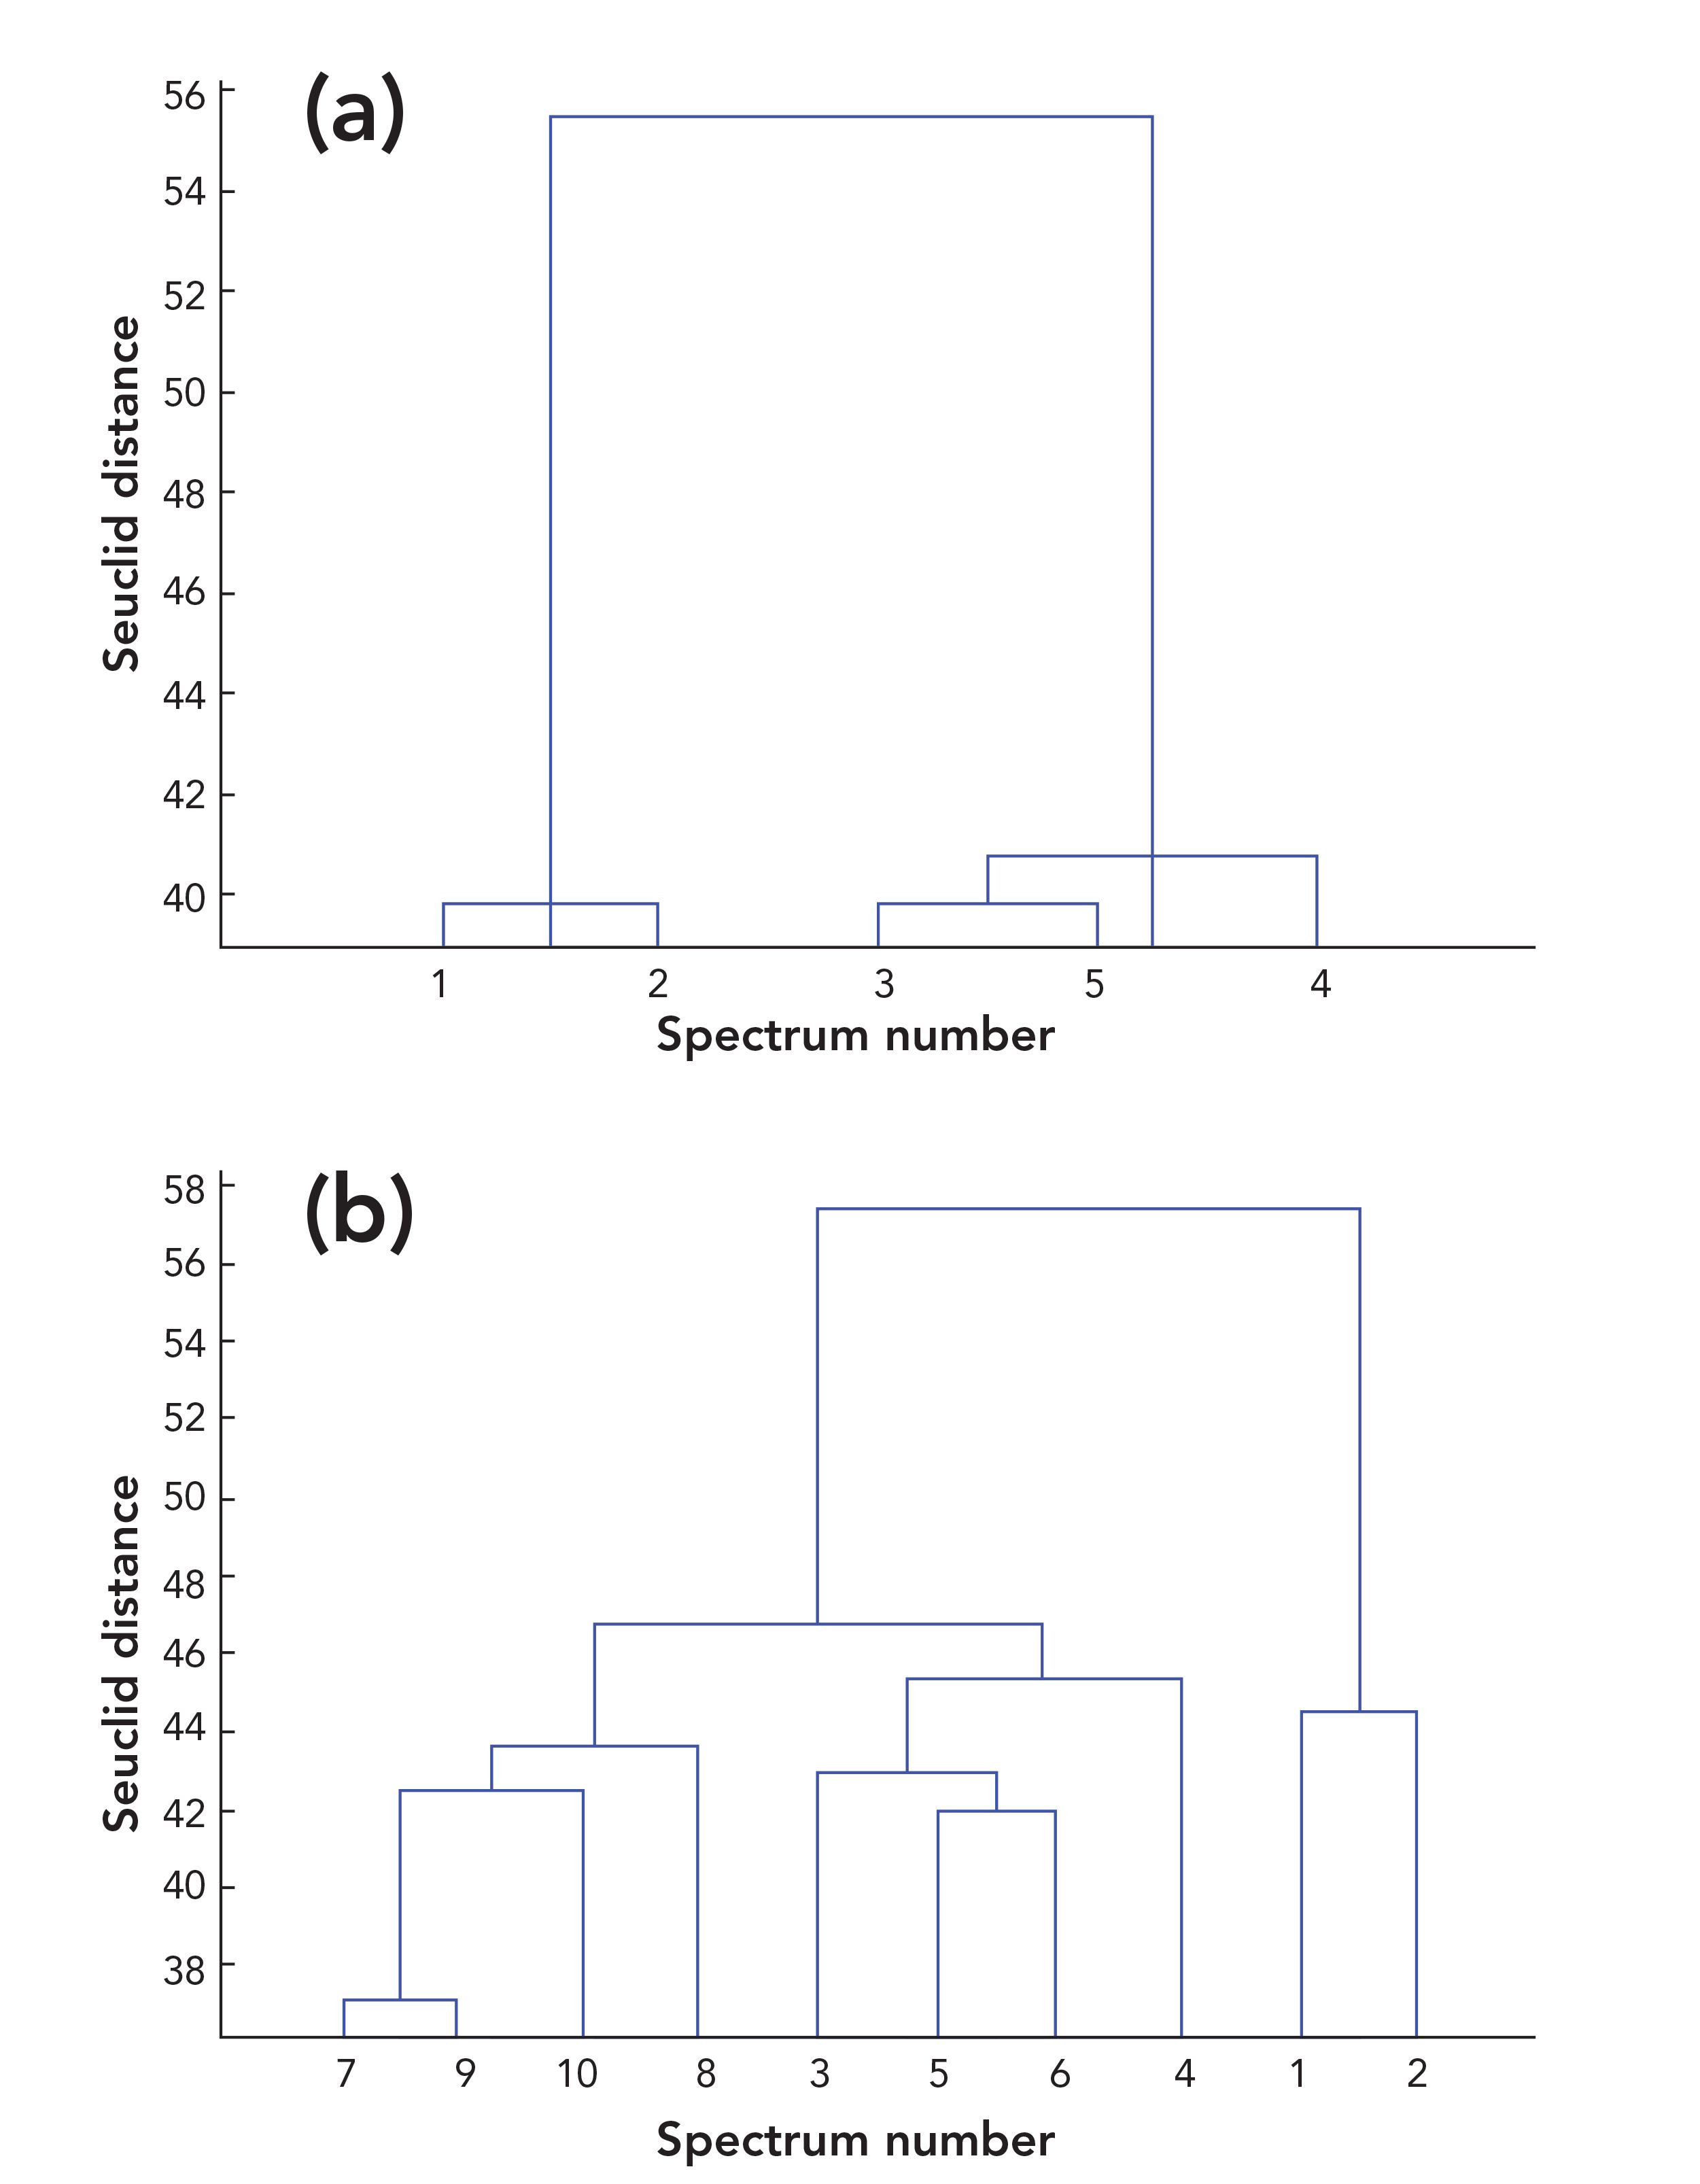
The HCA was further carried out on the ten spectra of Xijiang rice in position 2, and the results were shown in Figure 2b. Spectra 1 and 2 were significantly different from the other eight spectra, indicating that they were the potential outliers. After eliminating spectra 1 and 2, RSD value of the remaining three Raman spectra of sample 1 in position 2 was 13.9%, which was within the fluctuation range (below 14%), confirming that spectra 1 and 2 were the outlier data. Spectra 3–8 in Figure 2b were mixed together indicating that the difference between the two rice samples in the same position was small. The above research results showed that RSD analysis can predict whether outliers exist, HCA analysis can find out the potential outliers, and the outliers can be finally identified and verified by RSD analysis. Combination of RSD analysis and HCA provides an accurate and reliable method to eliminate the outliers.
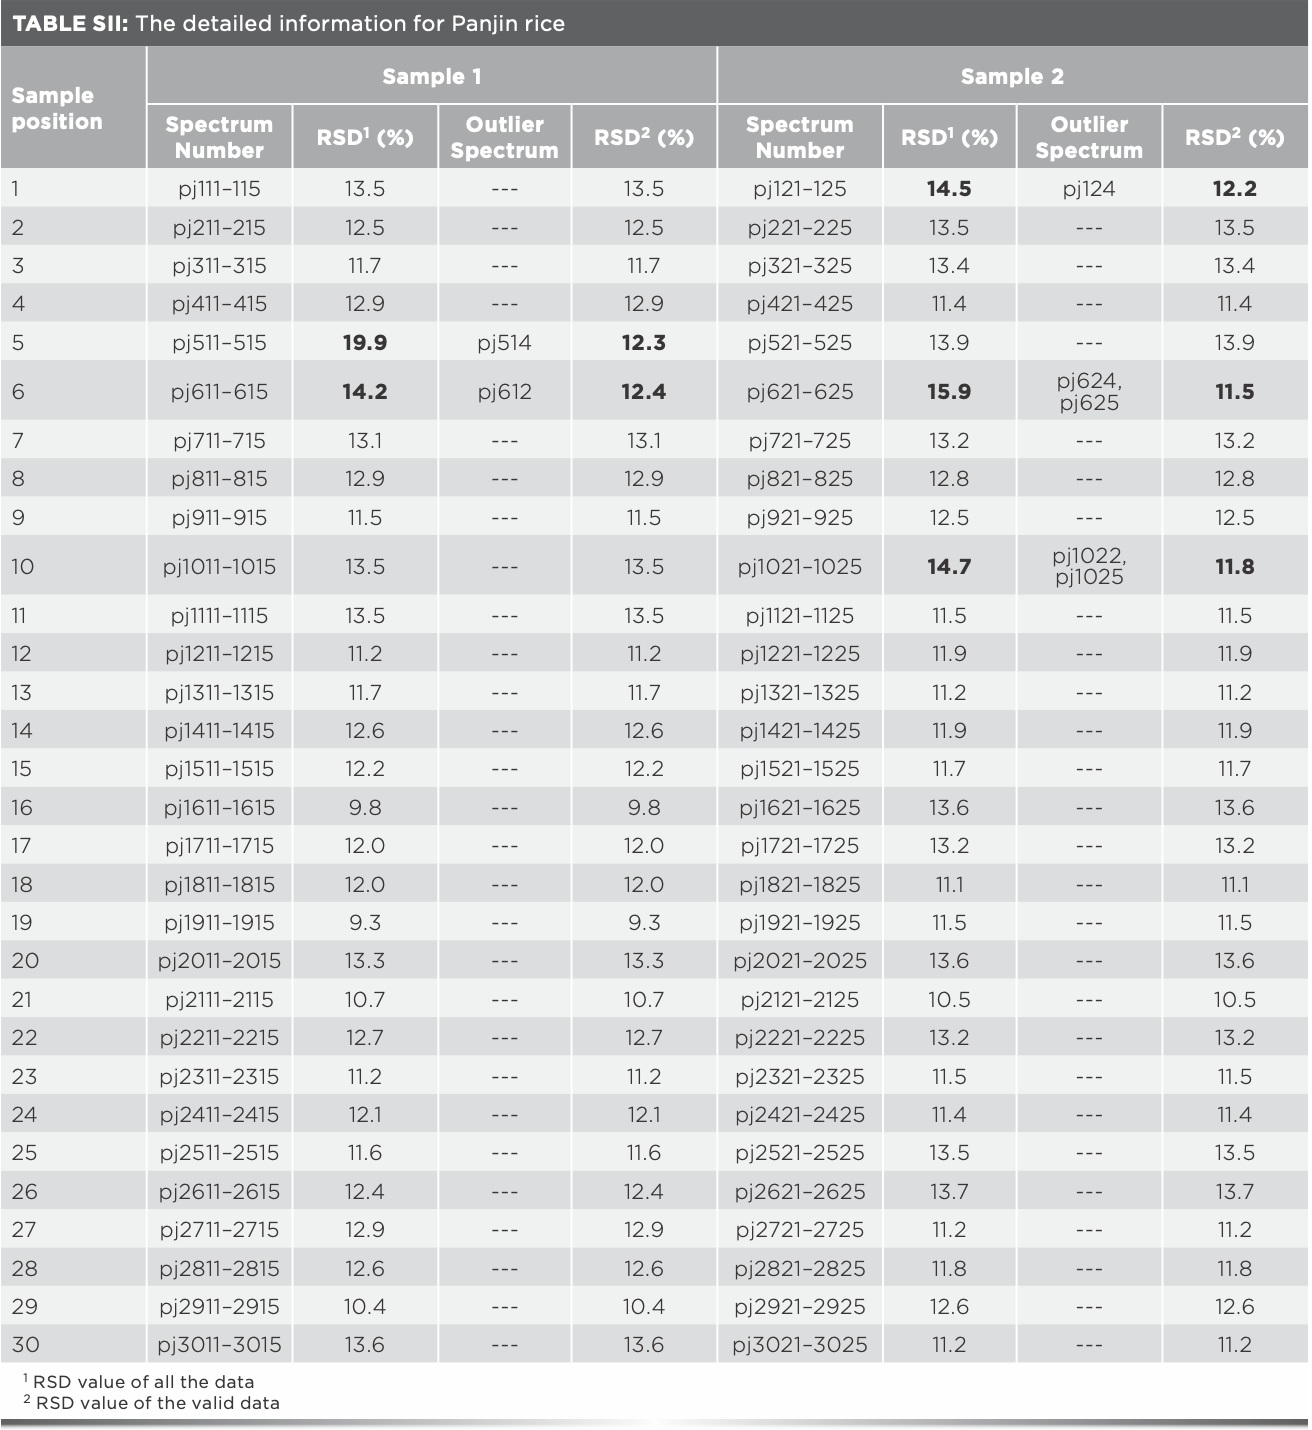
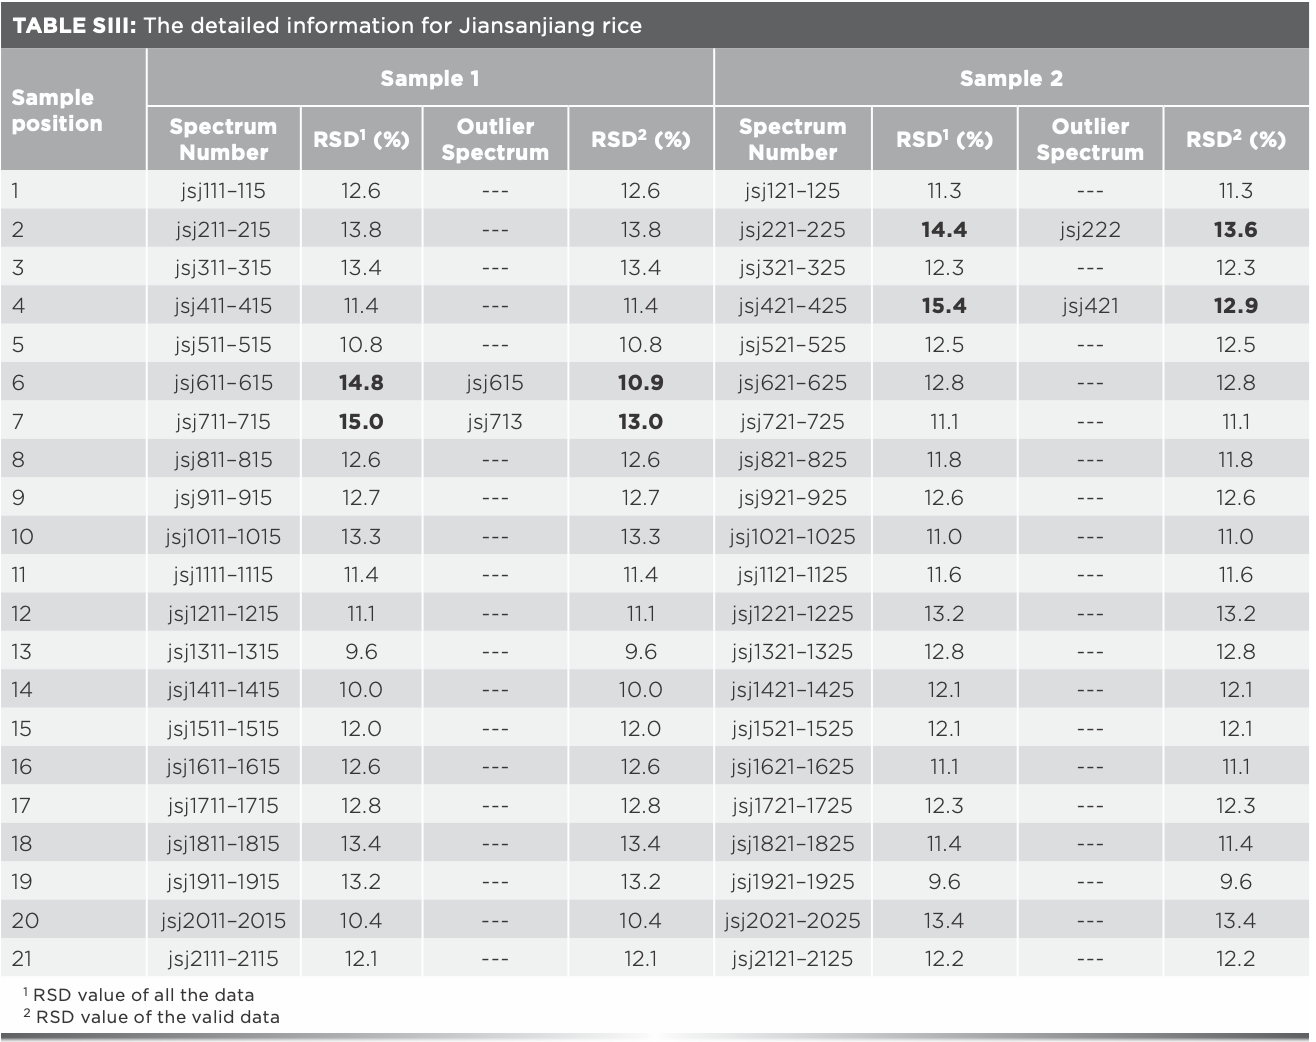
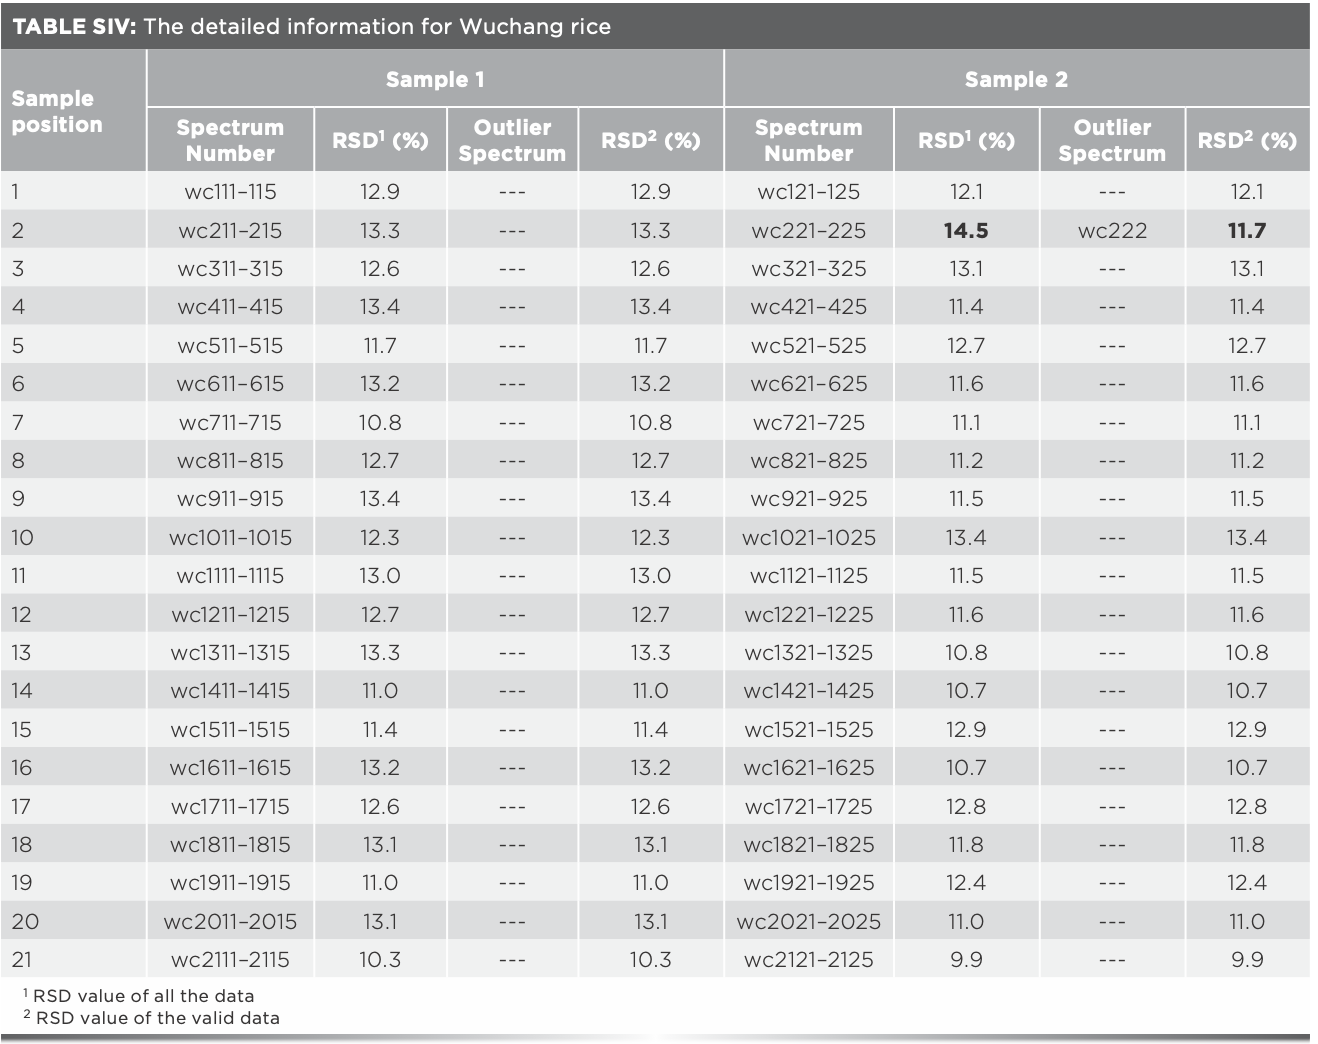
The same analysis of Xijiang rice in the remaining 17 positions was processed, and the outlier data found are shown in Table I. It was found that outlier data exist in all the rice samples which RSD values were over 14%, and the RSD values after eliminating the outlier data were all less than 14%, indicating that the existence of outlier data can be preliminarily judged by the fluctuation range of the RSD value. The 15 outlier spectra in Table I should be eliminated for subsequent modeling. Furthermore, after analyzing the Raman spectra of Panjin, Jiansanjiang, and Wuchang rice, it was found that there were seven, four, and one outlier spectra, respectively (Tables SI–SIV).


Average of Raman spectra after eliminating outlier data were taken as the representative spectra for each sample, values of the Raman absorbance were taken as independent variables, and the geographical origin was used as the dependent variable. Thus, matrix X (180 × 1250) and matrix Y (180 × 1) were formed. The number of samples was 180, and 1250 was the number of independent variables, along with one dependent variable. The recognition accuracy of the model based on matrix X was 93.3%, and the total recognition time was 54.9 s. Another prediction model was established by using the data without eliminating the outlier spectra, the recognition rate was 91.1%, and the recognition time was 55.1 s.
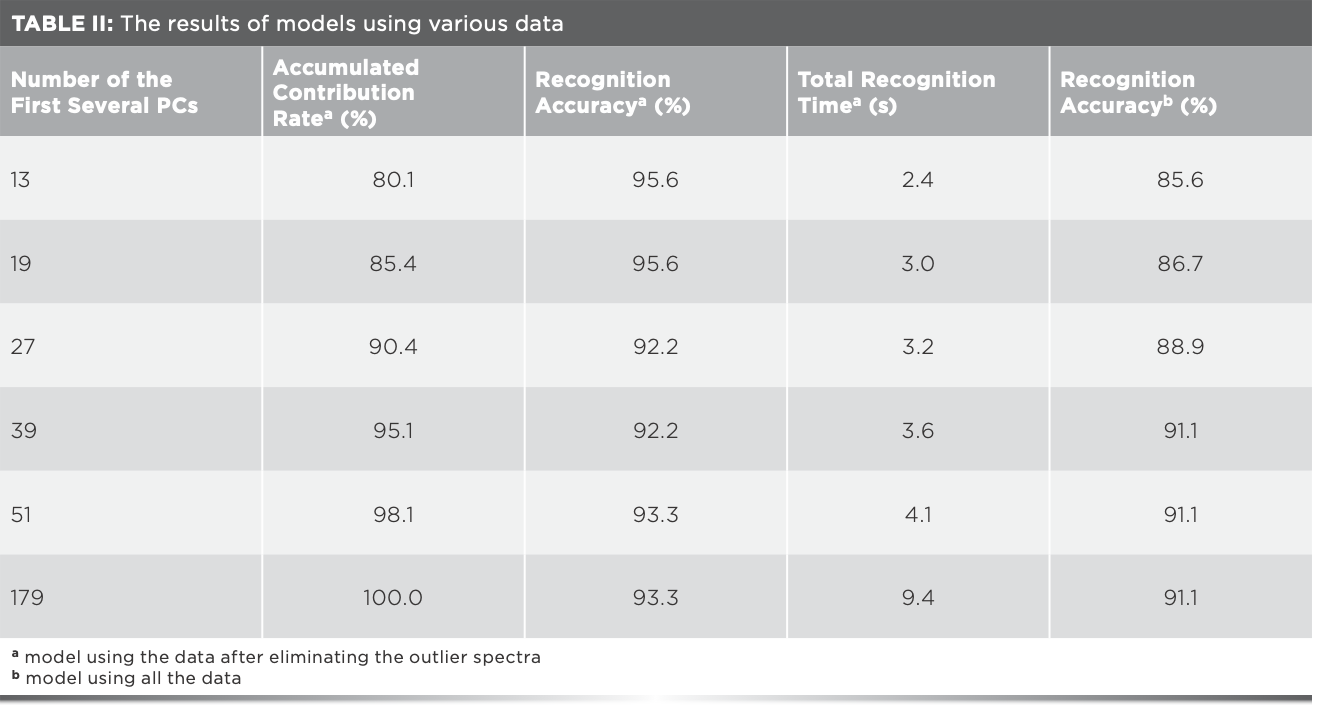
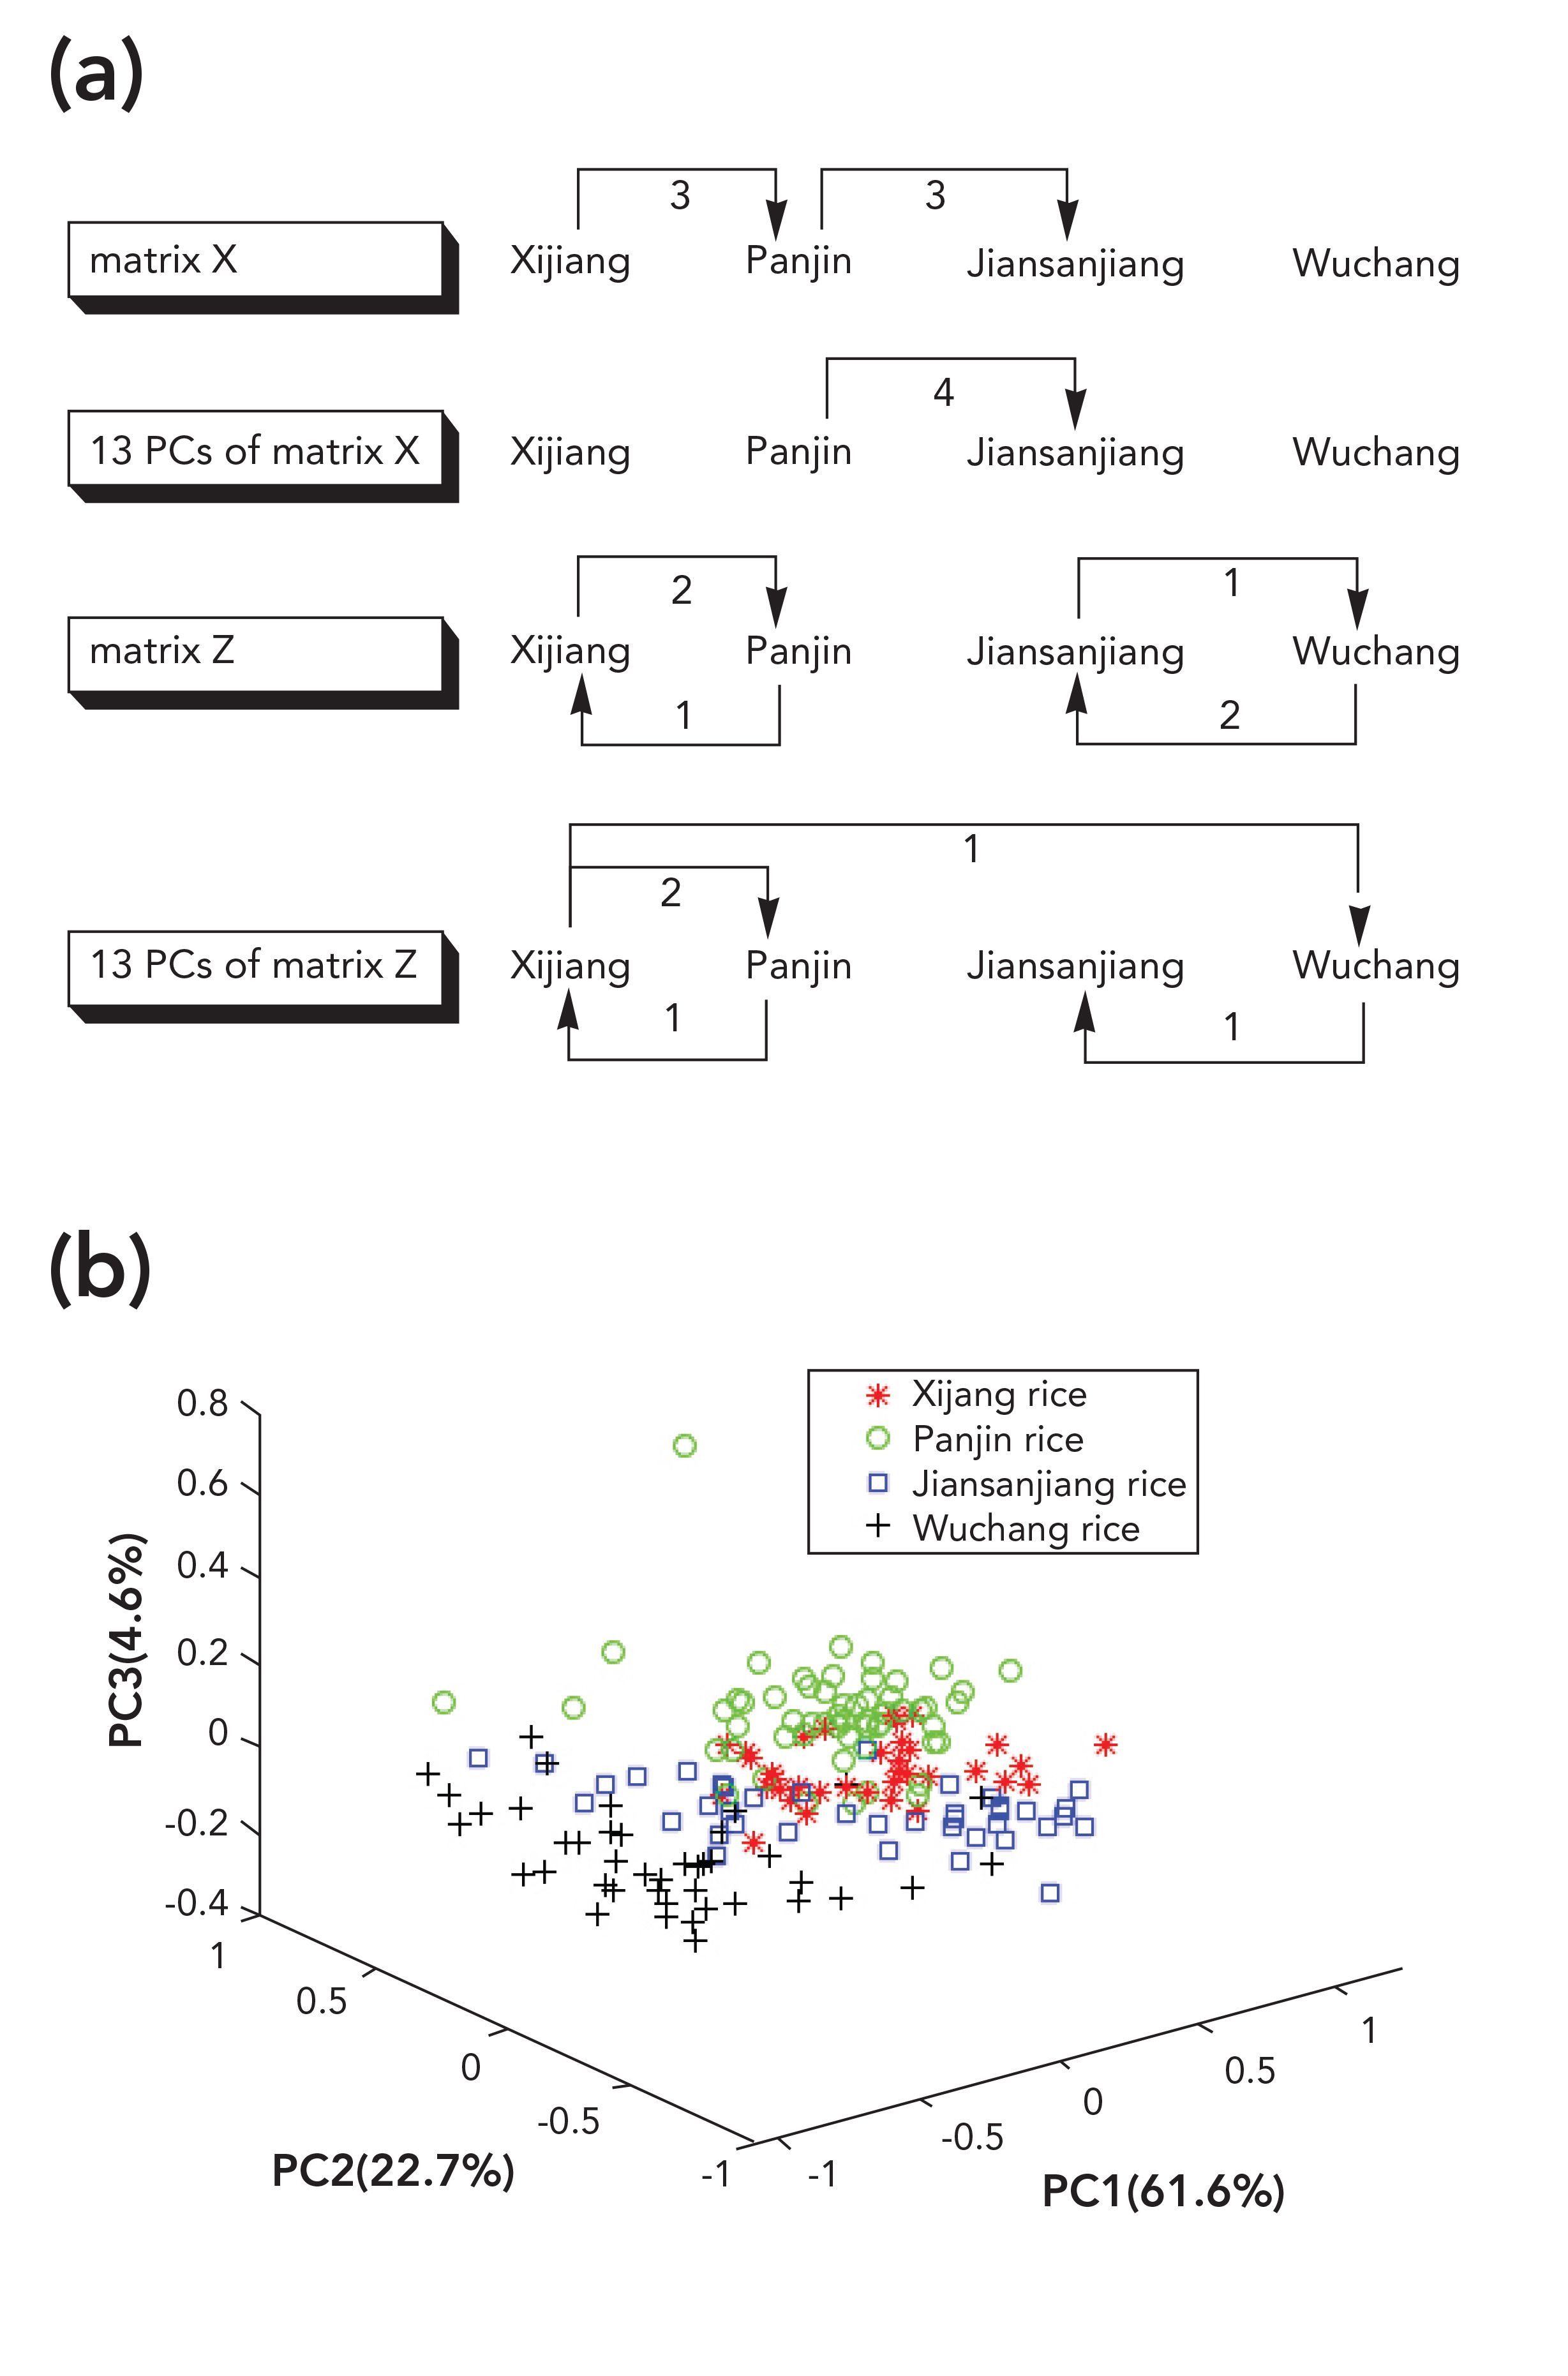
Taking into account the relevant variables will influence the efficiency of the model, and the principal component analysis (PCA) can extract the main information of the data, so PCA of matrix X was carried out before modeling, and the results were shown in Table II. The accumulated contribution rate of the first 179 principal components (PCs) was 100.0%, demonstrating that the 179 PCs can represent the overall information of matrix X. The recognition accuracy of the model using the 179 PCs was consistent with the result of matrix X, but its value was not the largest in Table II, indicating that there are some useless information in the first 179 PCs. When the numbers of PCs were 13, 15, 16, 18–21, and 24, the recognition accuracy was the highest (95.6%), and the total recognition time was 2.4–3.0 s, which were both better than those of the model built with matrix X. The misidentified samples were shown in Figure 3a. When matrix X was used, there were six wrongly classified samples. Three samples of Xijiang rice were classified as Panjin rice, three samples of Panjin rice were classified as Jiansanjiang rice. When the numbers of PCs were 13, 15, 16, 18–21, and 24, four samples of Panjin rice were wrongly classified as Jiansanjiang rice. It could be seen that the results varied greatly using different data, and the recognition accuracy of the model built by eliminating the outlier data was always higher than that of the model using all the data (Table II).


 Details of misclassified rice samples by Raman spectroscopy (b) Distribution of rice samples in the multidimensional principal component analysis (PCA) space formed by the first three PCs of mid-IR spectra.")
FIGURE 3: (a) Details of misclassified rice samples by Raman spectroscopy (b) Distribution of rice samples in the multidimensional principal component analysis (PCA) space formed by the first three PCs of mid-IR spectra.
Geographical Identification by Mid-IR Spectroscopy
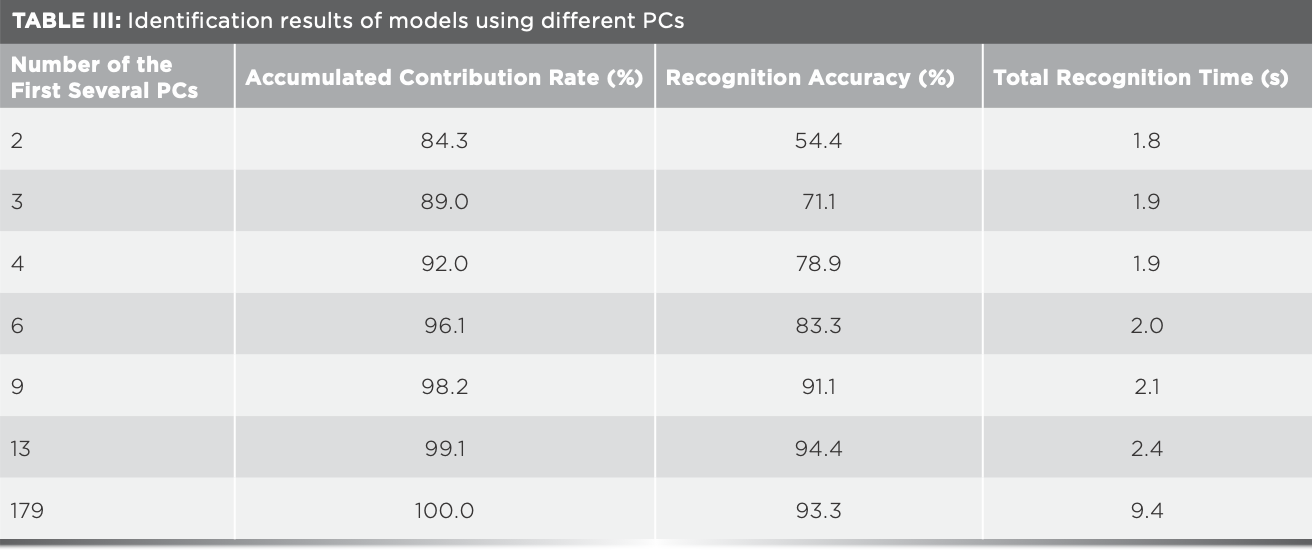
Mid-IR spectra of 180 samples of four kinds of rice were averaged as the representative spectra for each sample, values of the transmittance of mid-infrared spectra were taken as independent variables, and the geographical origin was used as dependent variable. Thus, matrix Z (180 × 7100) and matrix Y (180 × 1) were formed, with 7100 being the number of independent variables. The recognition accuracy of the model based on matrix Z was 93.3%, and the total recognition time was 307.4 s. PCA was then carried out on matrix Z, the results of the identification model using different PCs were shown in Table III. With the increase of the number of PCs, total recognition time increased when the number of PCs was between 13 and 15 and identification accuracy was 94.4%, which was the largest in Table III and much better than the results using matrix Z. When the identification accuracy was 94.4%, five samples were wrongly identified as can be seen in Figure 3a. Distribution of rice samples in the space formed by the first 3 PCs was shown as Figure 3b. Panjin rice was close to Xijiang and Jiansanjiang rice, some samples of Xijiang and Jiansanjiang rice were crossed together, and a few samples of Jiansanjiang and Wuchang rice overlapped. These samples were easy to be misjudged during identification, which explained why the recognition accuracy was only 71.1% when the number of PCs was three.


Identification Results After Data Fusion
Transitions between vibrational and rotational levels of chemical bonds or functional groups absorb infrared light, so the infrared spectrum can reflect the information of functional groups or chemical bonds contained in molecules. Besides, infrared absorption takes place only when there is a change of dipole moment. Raman spectrometer analyses the scattered light with different frequency from the incident light to obtain the information of molecular structure. Different from infrared spectrum, both polar molecules and nonpolar molecules can produce Raman spectrum. Therefore, if the two spectra is integrated, the information representing the composition of rice can be more comprehensive. According to the above experimental results, the misclassified samples corresponding to the best identification accuracy of Raman and mid-IR spectroscopy were entirely different, so data fusion of the two spectra can play a complementary role.
Low-level fusion of data was conducted first. Matrix X (180 × 1250) and matrix Z (180 × 7100) were fused into matrix M (180 × 8350) according to the method shown in Figure S2 (taking sample 1 of Xijiang rice in position 1 as an example). It was found that the recognition accuracy of the model using matrix M was 97.8% and the recognition time was 387.3 s. Data fusion by this method had achieved ideal recognition accuracy, but the recognition took a long time.


FIGURE S2: Diagram of low-level fusion method.
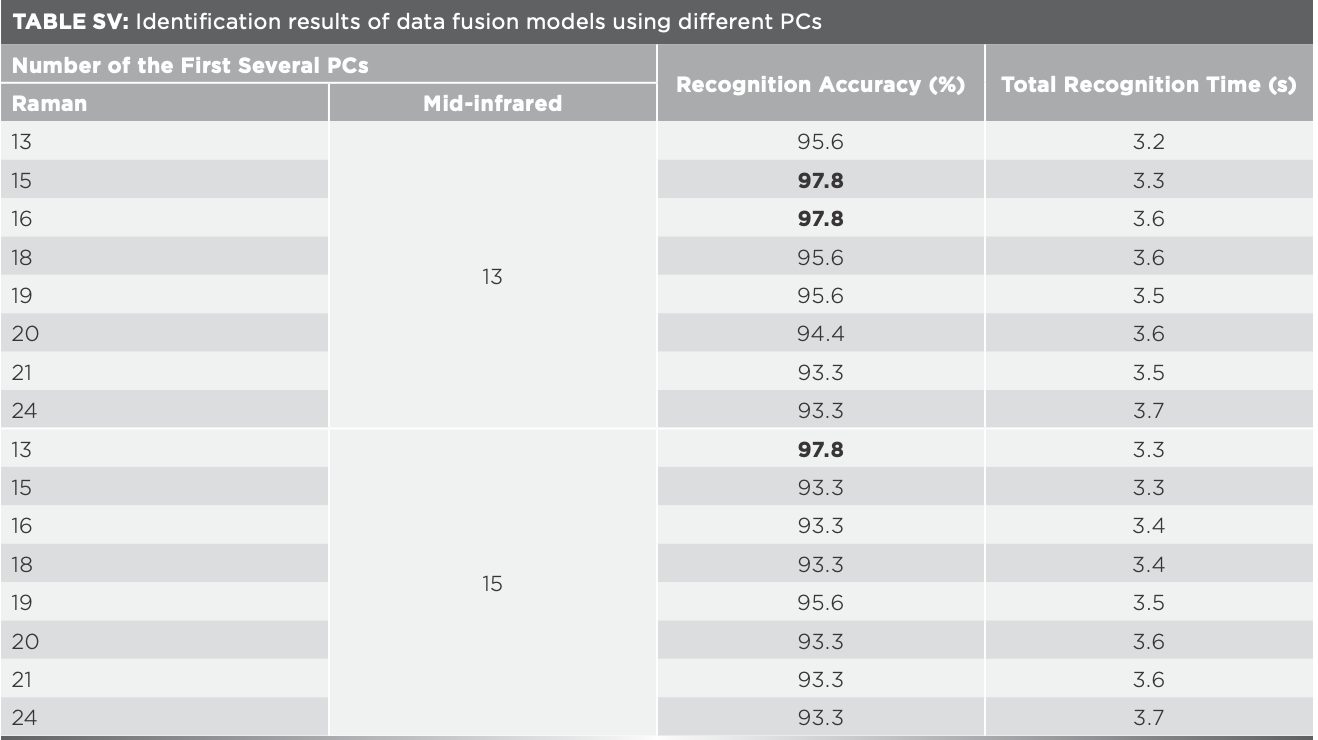
To overcome the low recognition efficiency, mid-level data fusion was used. According to the results in Table II and Table III, 13, 15, 16, 18– 21, and 24 PCs corresponding to the highest identification accuracy of Raman spectroscopy were selected respectively, and new data matrices were constructed by combined with 13 and 15 PCs corresponding to the highest identification accuracy of mid-IR spectroscopy. The newly established classification models had the highest recognition accuracy of 97.8% (Table SV), which was 4.5% higher than that of Raman and infrared spectroscopy. One sample of Xijiang rice was wrongly identified as Wuchang rice while one sample of Wuchang rice was wrongly identified as Jiansanjiang rice.


Promotion and Application of Data Mining and Data Fusion Technology
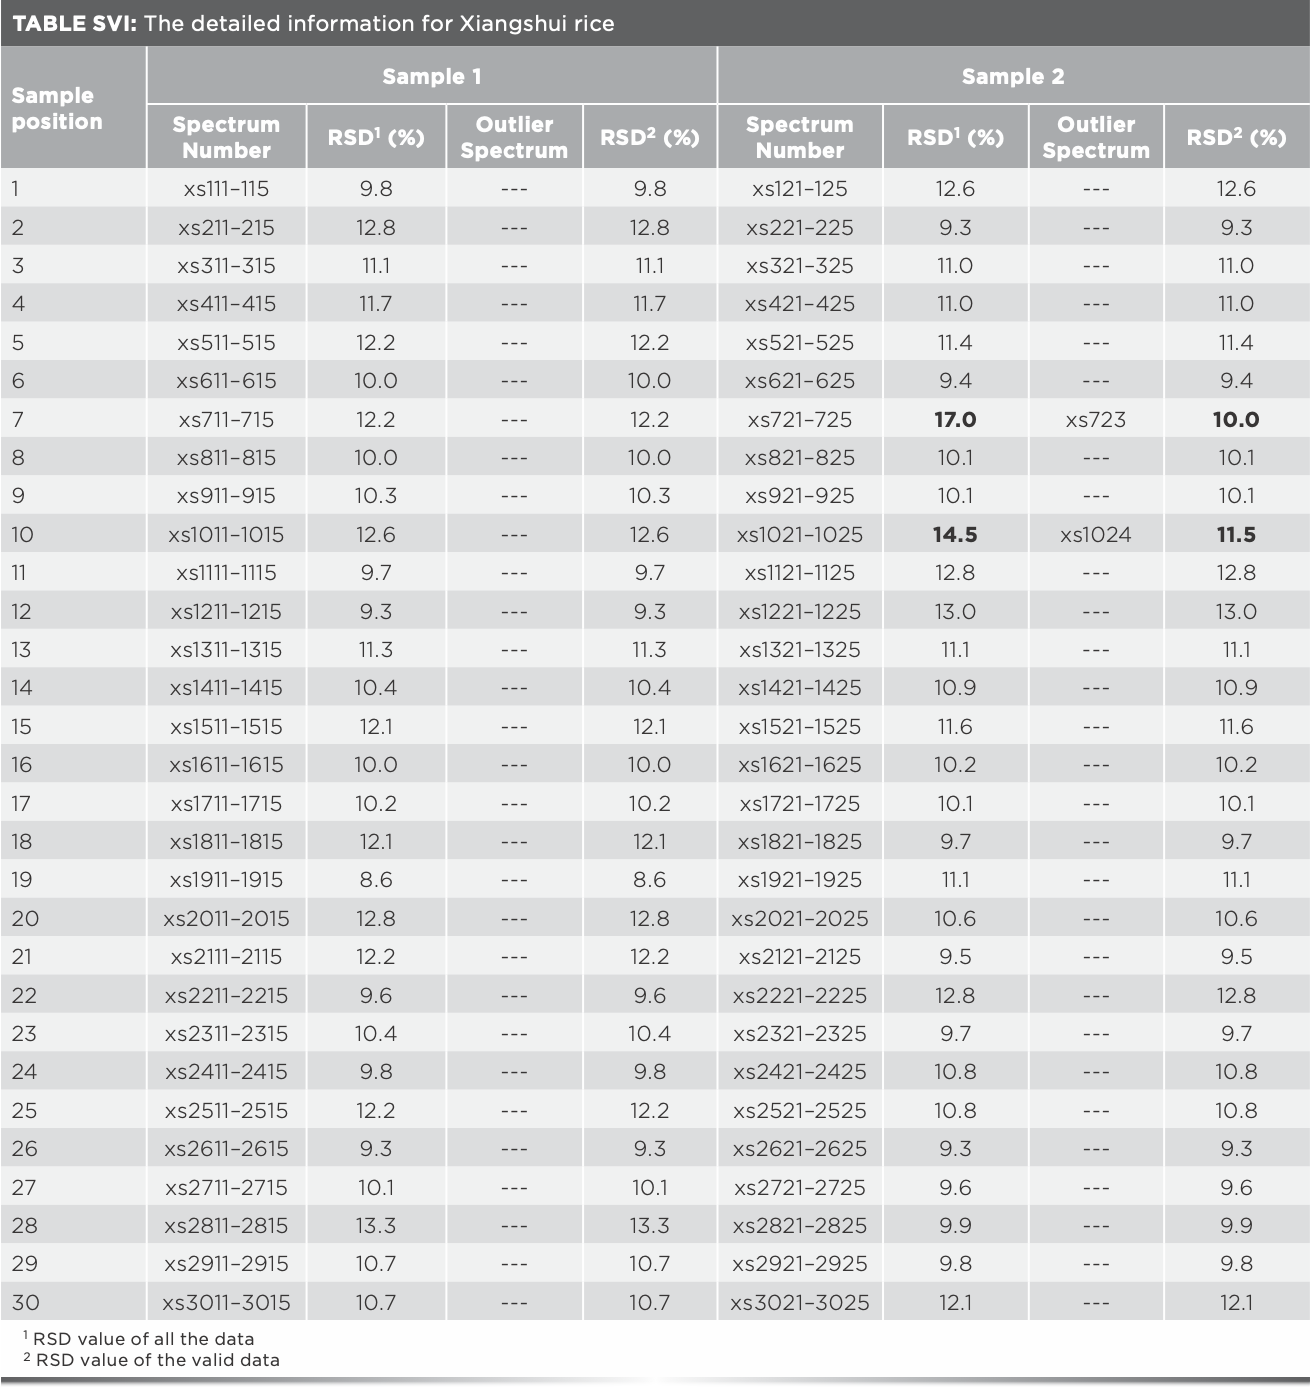
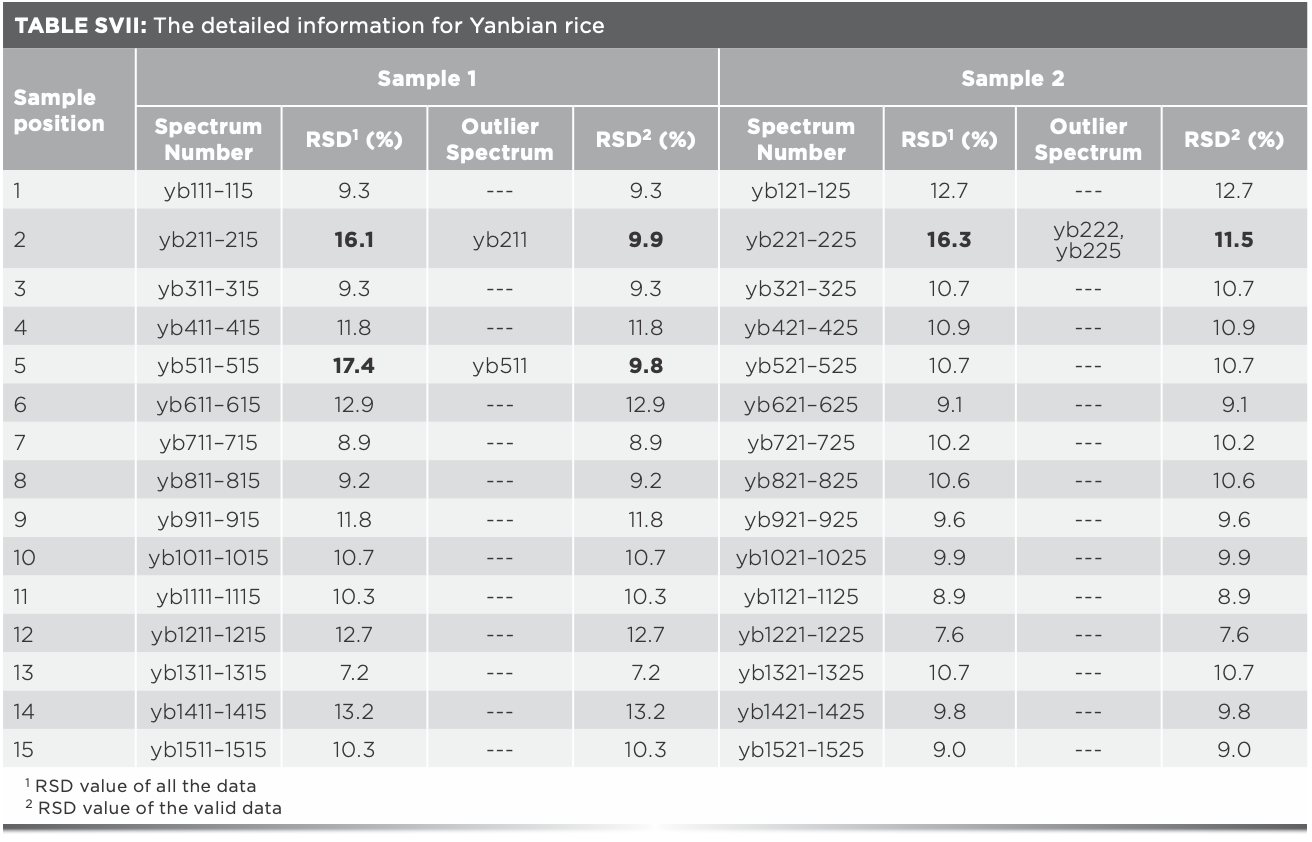
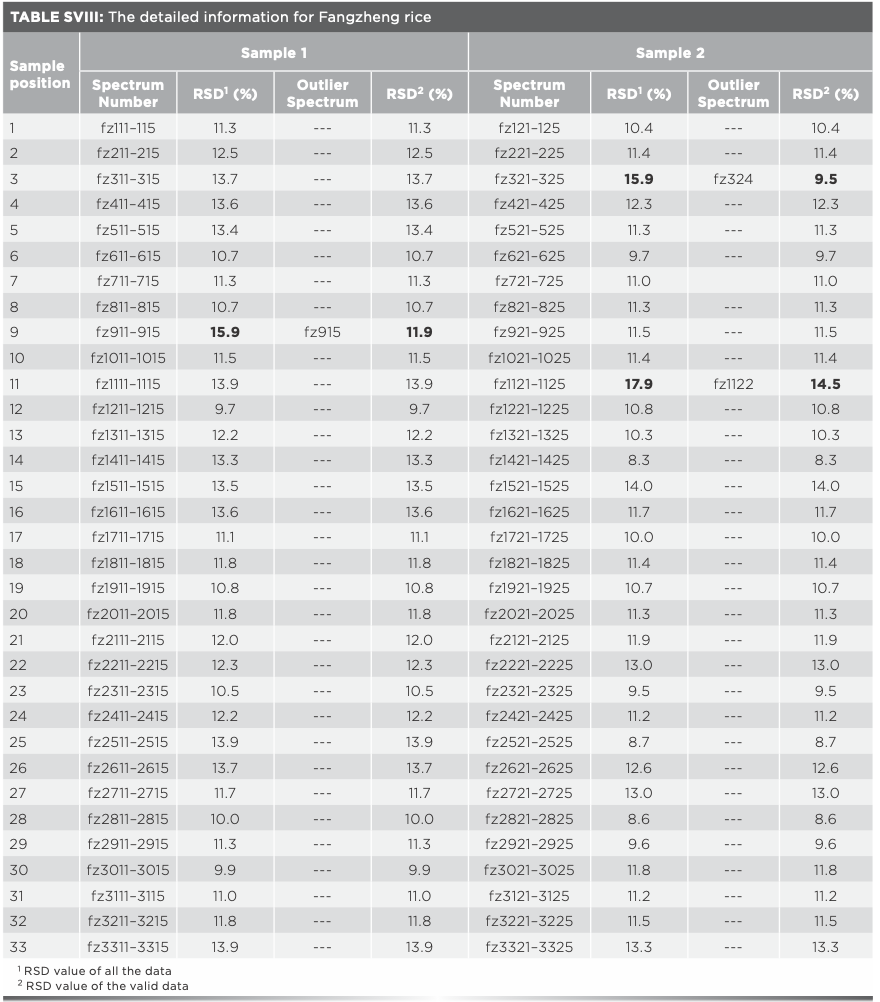
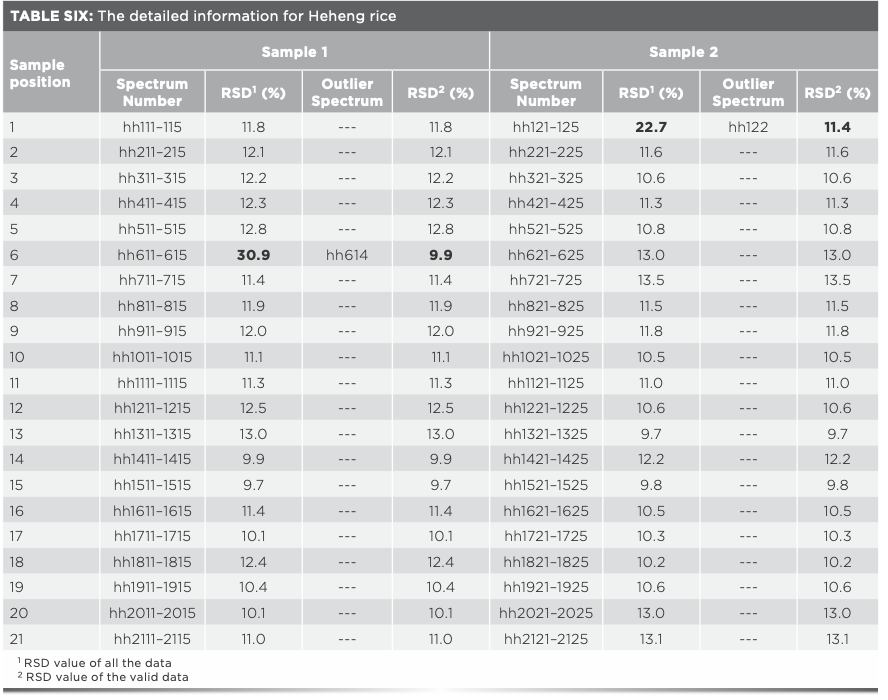
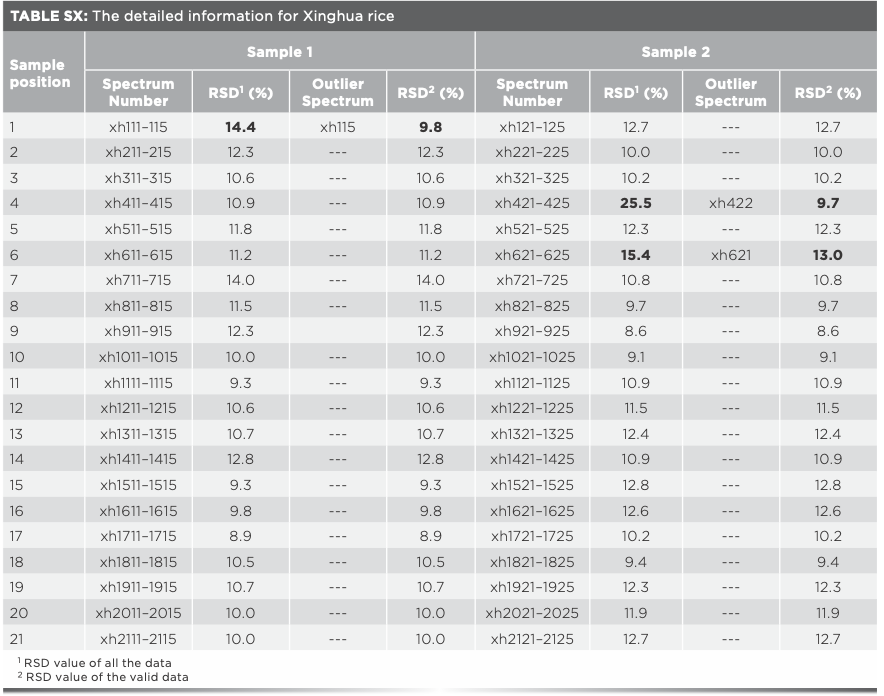
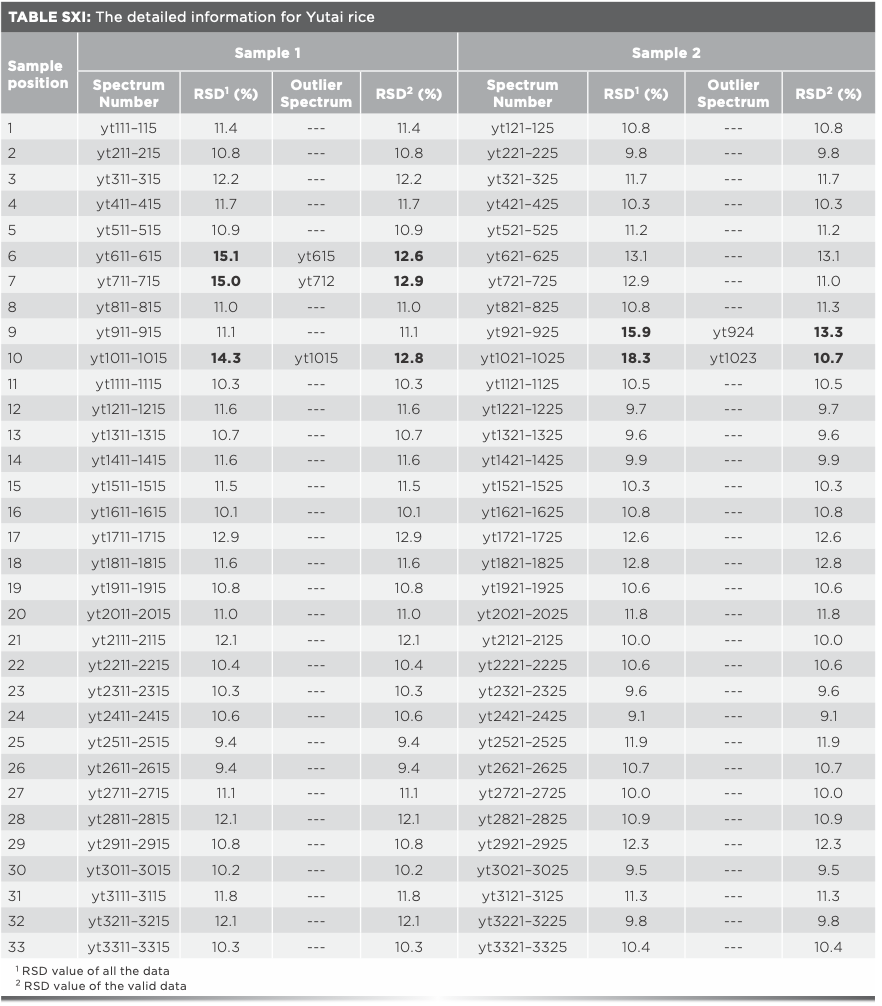
The promotion and application of data mining and data fusion technology were further studied. Xiangshui rice, Yanbian rice, Fangzheng rice, Heheng rice, Xinghua rice, Yutai rice, and the above studied four kinds of rice were identified together. The matrix of Raman spectra data was 486 × 1250, the identification accuracy was 91.8%, and the identification time was 430.9 s. The matrix of mid-IR spectra data was 486 × 7100, the identification accuracy was 91.8%, and the identification time was 2497.7 s, the model was time-consuming and its identification accuracy was not ideal. To improve the recognition accuracy and efficiency of the model, data mining (Tables SVI–SXI) and mid-level data fusion method was adopted. When the number of Raman PCs was 40 and the number of infrared PCs was 35, the identification accuracy of the ten kinds of rice was 96.7%, and the identification time was 40.1 s. The results were relatively ideal and consistent with expectations.


Conclusion
Taking Xijiang rice, Panjin rice, Jiansanjiang rice, and Wuchang rice as examples, this paper explored the influence of data fusion of Raman spectra and mid-IR spectra on the geographical identification model. First of all, rice samples were processed, crushed, and screened, and rice flour sized between 100–140 mesh were obtained. Second, Raman spectra and infrared spectra of each sample were collected at 5 measurement positions and in triplicate respectively. The collected spectra were pretreated by denoising, multivariate scattering correction and normalization successively. RSD analysis and HCA were applied to detect of outliers from Raman data of each sample. Then, the Raman spectra and mid-IR spectra of each sample were averaged respectively. Finally, the geographical identification models were established by support vector machine using Raman data, mid-IR data and the fusion of the two data. The results showed that RSD analysis can predict whether there are outliers, HCA analysis can find out the potential outlier data, and then RSD analysis can finally determine the outlier data, the comprehensive application of RSD analysis and HCA provides an accurate and reliable method to eliminate the outliers. In addition, data fusion realized complementarity of Raman and mid-IR spectra information, and the accuracy of the established model was 97.8%, which was 4.5% higher than that of Raman data and mid-IR data. The data fusion method explored in this paper provided more accurate and reliable data for identifying geographical origins of rice quickly. Besides, the identification accuracy of 10 kinds of rice with close geographical location was 96.7%, which was higher than 90.0%, demonstrating that the data pretreated method and the data fusion model proposed were effective and worthy popularization.
Conflicts of Interest
The authors have no conflicts of interest.
Acknowledgments
This work was supported by the Natural Science Foundation of Jiangsu Province [grant number BK20180816]; the Natural Science Research of Jiangsu Higher Education Institutions of China [grant number 17KJD550001]; and the National Natural Science Foundation of China [grant number 61602217].
References
(1) Y.B. Monakhova, D.N. Rutledge, A. Roßmann, et al., J. Chemometrics 28(2), 83–92 (2014).
(2) S.Y. Park, J.K. Kim, J.S. Jang, et al., Food Sci. Biotechnol. 24(1), 225–231 (2015).
(3) K.L. Bett-Garber, R.J. Bryant, C.C. Grimm, et al., Cereal Chem. 94(3), 602–610 (2017).
(4) H.B. Zhu, Y.Z. Wang, H. Liang, et al., Talanta 81(1–2), 129–135 (2010).
(5) G.A. Camelo-Méndez, B.H. Camacho-Díaz, A.A. Villar-Martínez, et al., J. Sci. Food Agric. 92(13), 2709–2714 (2012).
(6) M. Ashfaq and A.S. Khan, Russ. J. Genet. 48(1), 53–62 (2012).
(7) M.M. Voorhuijzen, J.P. van Dijk, T.W. Prins, et al., Anal. Bioanal. Chem. 402(2), 693–701 (2012).
(8) K. Ariyama, M. Shinozaki, and A. Kawasaki, J. Agric. Food Chem. 60(7), 1628–1634 (2012).
(9) R.A. Lagad, S.K. Singh, and V.K. Rai, Food Chem. 217, 254–265 (2017).
(10) G. Li, L. Nunes, Y.J. Wang, et al., J. Environ. Sci. 25(1), 144–154 (2013).
(11) J. Promchan, D. Günther, A. Siripinyanond, et al., J. Cereal Sci. 71, 198–203 (2016).
(12) R.J. Bryant and A.M. McClung, Food Chem. 124(2), 501–513 (2011).
(13) D.K. Lim, C. Mo, D.K. Lee, et al., J. Food Drug Anal. 26(1), 260–267 (2018).
(14) D.S. Yang, K. Lee, and S.J. Kays, J. Sci. Food Agr. 90(15), 2595–2601 (2010).
(15) J. Hwang, S. Kang, K. Lee, et al., Talanta 101, 488–494 (2012).
(16) Y. Kim, S. Lee, H. Chung, et al., J. Raman Spectrosc. 40(2), 191–196 (2009).
(17) X. Feng, Q. Zhang, P. Cong, et al., Talanta 115, 548–555 (2013).
(18) L. Zhu, J. Sun, G. Wu, et al., J. Cereal Sci. 82, 175–182 (2018).
(19) S. Chaiwanichsiri, D. Thumrongchote, T. Suzuki, et al., Res. J. Pharm. Biol. Chem. Sci. 3(1), 150–164 (2012).
(20) M. Sha, D.D. Gui, Z.Y. Zhang, et al., J. Food Meas. Charact. 13(3), 1705–1712 (2019).
(21) D. Ballabio, E. Robotti, F. Grisoni, et al., Food Chem. 266, 79–89 (2018).
(22) D. Cozzolino, Food Res. Int. 60, 262–265 (2014).
(23) L.Y. Xia, S.G. Shen, Z.H. Liu, et al., Spectrosc. Spect. Anal. 33(1), 102–105 (2013).
(24) E. Borràs, J. Ferré, R. Boqué, et al., Anal. Chim. Acta 891, 1–14 (2015).
(25) L. Wang, D. Liu, H. Pu, et al., Food Anal. Method 8(2), 515–523 (2015).
(26) W.J. Sun, X. Zhang, Z.Y. Zhang, et al., Spectrochim. Acta A 171, 72–79 (2016).
(27) M. Hohmann, Y. Monakhova, S. Erich, et al., J. Agr. Food Chem. 63(43), 9666–9675 (2015).
(28) M. Sha, D. Zhang, Z.Y. Zhang, et al., J. Raman Spectrosc. 51, 702–710 (2020).
(29) I. Tomas and N. Tormod, Appl. Spectrosc. 42, 1273–1284 (1988).
(30) H.A.H. Naji, Q.J. Xue, K. Zheng, et al., Sensors 20(8), 2331 (2020).
(31) C.M. Farrelly, S.J. Schwartz, A.L. Amodeo, et al., J. Res. Pers. 70, 93–106 (2017).
(32) S.C. Johnson, Psychometrika 3, 241–254 (1967).
(33) S.R. Amendolia, G. Cossu, M.L. Ganadu, et al., Chemom. Intell. Lab. Syst. 69, 13–20 (2003).
(34) R.M. Balabin and S.V. Smirnov, Talanta 85, 562–568 (2011).
(35) L. He, B. Agard, and M. Trepanier, Transportmetrica A: Transport Sci. 16(1), 56–75 (2020).
(36) L.Z. Hong, Q.L. Bao, L.T. Yue, et al., Food Chem. 145, 625–631 (2014).
(37) H.S. Zwick and S.A.S. Syed, Appl. Econ. Lett. 24(7), 472–476 (2017).
(38) M. Sha, Z.Y. Zhang, D.D. Gui, et al., Food Anal. Method 10, 3415–3423 (2017).
Min Sha, Zhengyong Zhang, Yu Huang, Minqin Jiang, and Jun Liu are with the School of Management Science and Engineering at Nanjing University of Finance and Economics in Nanjing, China. Dongdong Gui is with the College of Civil Aviation at Nanjing University of Aeronautics and Astronautics in Nanjing, China. Peng Li is with the School of Food Science and Engineering, Nanjing University of Finance and Economics in Nanjing, China. Direct correspondence to: shaminjingjing@163.com.


")


Newsletter
Get essential updates on the latest spectroscopy technologies, regulatory standards, and best practices—subscribe today to Spectroscopy.