Article
Special Issues
Spectroscopy Supplements
ICP-MS Analysis of Multiple Trace Elements in Industrial Cell Lines
Author(s):
This article demonstrates that a dilute-and-shoot method combined with quadrupole ICP-MS is suitable to accurately analyze trace elements in two industrial cell lines using low sample volumes.
Trace-level multiple-element analysis through inductively coupled plasma–mass spectrometry (ICP-MS) provides suitable support for biopharmaceutical upstream process development and batch quality control. To set up a platform method for trace-level multiple elements in industrial cell culture media, scans of all relevant elements of fed-batch cell harvests from various mammalian cell lines were initially obtained and the distinct presence of major elements was observed. After an initial scan, 14 target elements were sorted into two analysis modes based on their specific concentration levels in the harvests. Following this sorting process, multiple-element standard curves with particulate ranges of each element were constructed. Results using various mammalian cell line harvests validated this method of trace-element analysis and provided a theoretical basis for metabolic pathways in distinct cell lines, based on differentiating elemental uptake patterns. Moreover, this multiple-element analysis demonstrated the efficiency of using multiple-element standards for quick result turnover. These results show the capability of ICP-MS to monitor multiple trace elements with high sensitivity in various industrial cell culture media.
The importance of inductively coupled plasma–mass spectrometry (ICP-MS) for trace-level elemental quantification has been affirmed through increasing interest and research within the field of environmental science and human clinical studies. The analysis of trace-level elements has expanded significantly into the pharmaceutical industry because of the growth of biologics in clinical trials and as commercial therapies, in many cases addressing previously unmet medical needs. These therapeutic proteins are large molecules of significant complexity because of protein secondary and tertiary structure as well as post-translational modifications. The complexity arises, in part, as the proteins are produced by mammalian cells during growth over many days in proprietary growth media. The media contain nutrients for optimal growth and influence expression of the target protein. Of particular interest, several trace elements (such as Mn2+) have been reported to improve glycosylation profiles of final products in Chinese hamster ovary (CHO) cells, by acting as a cofactor in a mechanism with β-1,4-galactosyltransferase (1). Sensitive instrumentation such as ICP-MS could be of great benefit in analyzing trace-level elements in spent media originating from different industrial cell lines. This technique naturally leads to facilitating cell culture process optimization by ensuring that critical product quality attributes, such as glycoforms, meet the standard of innovator drugs.
Based on reported studies about trace-element concentrations in human serum, a minimum sample volume of 500 µL is required for each sample (2,3). In some publications, the sample preparation approach is to use a digestion (4). The primary advantage of using the digestion method is to achieve complete decomposition of the matrix. However, the digestion procedure can introduce random contamination and volatile elements that interfere with the interpretation of results. In this work, we eschew the digestion process and implement a “dilute-and-shoot” method instead. Based on the characteristics of drug substance samples, appropriate dilutions for each sample are determined and applied. This approach provides the advantage of a minimum sample preparation volume requirement, which may be as low as 100 µL. With the dilute-and-shoot approach, sample preparation time is significantly reduced and possible sources of contamination are minimized. Moreover, assay cost is significantly less than the digestion method because it avoids microwave digestion during sample preparation.
It is noted that this method can result in buildup of sample residues on the MS nebulizer and sample introduction line, requiring frequent cleaning of both the nebulizer and pump tubing. Moreover, a standard minimum dilution limit must to be set to ensure the nebulizer and sample introduction lines are not saturated by protein matrices. After considering results obtained from internal work regarding analysis of trace-element concentration in CHO cell culture media, the minimum dilution of each sample preparation was defined as 1:100 in this study.
The analytical approach used for this experiment was validated by performing an accuracy check and a precision spike study. The method was then performed to assay a wide range of concentrations of the following elements of interest: Mg, Cr, Mn, Fe, Co, Ni, Cu, As, Se, Mo, Sb, Ba, Tl, and Pb. These elements originated from two common industrial cell lines, designated in this study as cell line 1 and cell line 2.
Experimental
Instrument Parameters
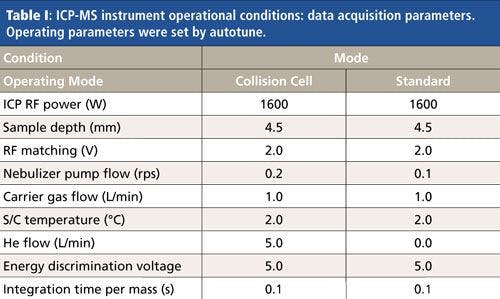
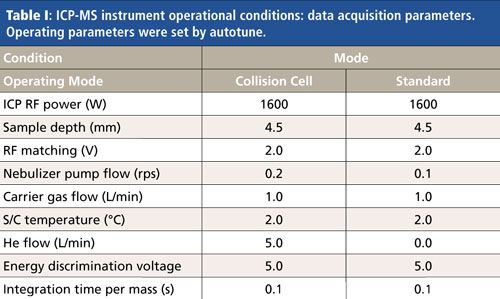
The entire study was performed using an Agilent 7700 quadrupole ICP-MS system (Agilent Technologies). The instrument parameters are summarized in Table I. The 14 elements were analyzed using ICP-MS in two separate modes. Most of the elements of interest were analyzed using standard mode. However, for Fe analysis, He mode with a collision cell was used to eliminate intense plasma- and polyatomic-based interferences such as 40Ar16O+.

Reagents and Standards
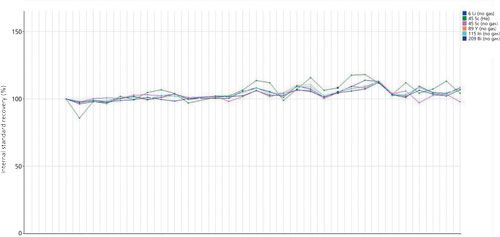
Standards and samples were prepared with high purity water that had a resistivity of 18.2 MΩ. Trace metal–grade nitric acid (Fisher Chemical) and ICP-MS trace-metal standards (Inorganic Ventures) were used in all standard preparations. To facilitate the monitoring of instrument parameters and the stability of target elements during the analysis, an internal standard mixture consisting of Li, Sc, Y, In, and Bi was added to each sample at a 2.5-µg/L level. The data are presented in Figure 1.

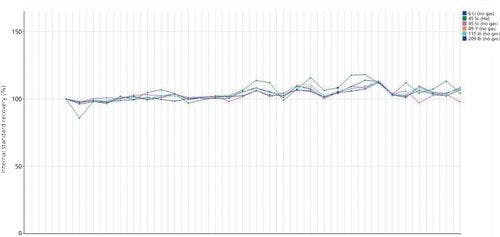
Figure 1: Internal standard recovery percentage measured with ICP-MS. All five internal standards in no gas mode (6Li, 45Sc, 89Y, 115In, 209Bi) have a recovery (%) range of 96–113%. Internal standard (45Sc) in He mode has a recovery (%) range of 86–118%.
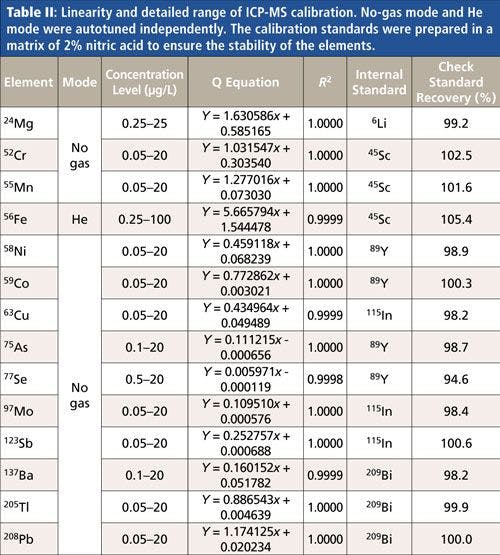
For initial scanning, semiquantitative (SemiQuant) mode was used with ICP-MS (5). For full quantitative (Full-Quant) mode based on distinct levels of each element, specific standard curve levels were designed as presented in Table II.

Sample Preparation for ICP-MS
Samples from two typical industrial cell lines were chosen for this trace-element study, cell line 1 (mammalian) and cell line 2 (human). Both cell lines typically have a two- to three-week bioreactor process before harvest. A spike study was performed with trace-level elements on log phase (day 3) to stationary phase (day 13) samples from both cell lines. To investigate the contribution of matrix effects, trace-element standard mixture was spiked into each sample at a 1-µg/L level. Bioreactor sample aliquots were centrifuged at 14,000 rpm (20,817 RCF) for 5 min to precipitate any cell debris before assay. Samples were serially diluted twice at a factor of 1:10 with 2% nitric acid in high purity water, for a total dilution of 1:100. For each sample, a further 1:4000 dilution was performed using the same diluent to capture highly abundant elements in cell media (for example, Mg, Fe, and Cu). After preparation, samples were centrifuged at 3500 rpm (1301 RCF) for 5 min before analysis.
Results
Semiquantitative-mode measurement with ICP-MS was performed initially, with full scanning of all possible elements in the samples. Notably, results show that more obvious concentration changes of Mg, Cu, Se, and Ba were found from day 3 and day 13 samples. Based on these initial data, a list of 14 elements was selected, which included the critical elements listed above (Mg, Cu, Se, Ba) as well as others considered to be of interest, but in reduced amounts (Cr, Mn, Fe, Co, Ni, As, Mo, Sb, Tl, and Pb).
The calibration ranges investigated for each element are summarized in Table II. Given the significantly higher abundance of 56Fe and 24Mg in mammalian cell media observed in previous experimental results, both calibration ranges for these elements began at a level of 0.25 μg/L, while the range for the other ultratrace elements began at a level of 0.05 μg/L. Calibration curves for all 14 elements were constructed with the calibration blank as zero and a six- to eight-point calibration series. Results for each isotope, calibration range, and linearity are also reported in Table II. The R2 values for all 14 elements were ≥0.9998. With the exception of Fe, all the elements of interest were analyzed using standard mode. He mode (with a collision cell) was performed to analyze Fe. 77Se was measured in this study because 78Se consistently presented higher polyatomic interference with other elements and had corresponding higher counts than estimated (6).
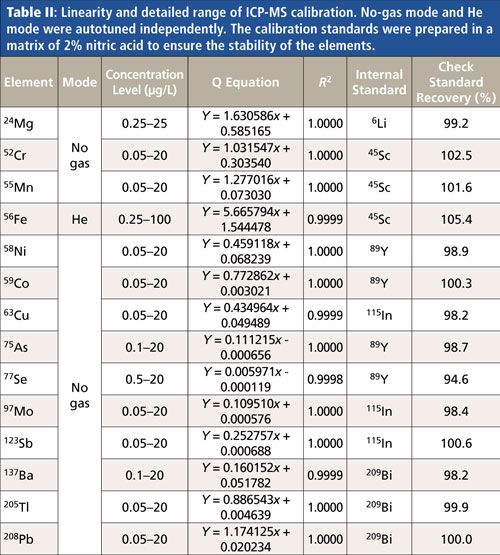
Table III presents the instrumental background equivalent concentration (BEC), method limit of detection (LOD), and method limit of quantification (LOQ) for all 14 elements in this study. BEC was measured directly by ICP-MS during the run, method LOD was calculated as 3.3 times the standard deviation of triplicate analyses of the calibration blank, and the method LOQ was calculated as 10 times the standard deviation of the triplicate analyses of the calibration blank (7). To summarize, the instrument BEC for all elements was within the range of 0.006–0.359 μg/L, and the method LOD was demonstrated to be in the range between 0.002–0.086 μg/L.


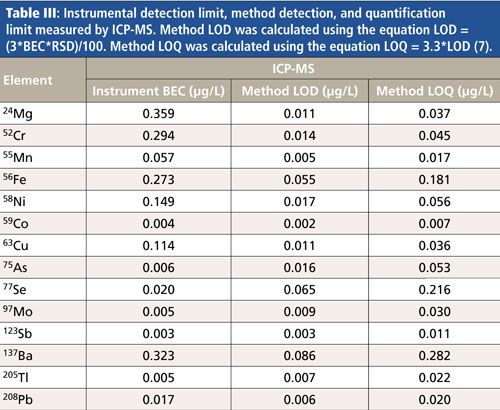
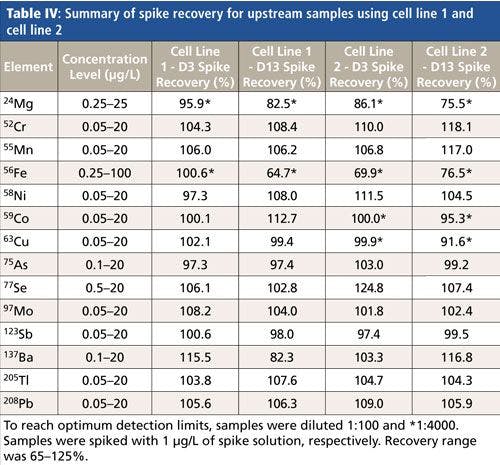
The accuracy and precision of this method was confirmed by triplicate standard checks and sample spike studies. Table II illustrates the check standard recovery (%) for all investigated elements based on ICP-MS standard mode and He mode, respectively. The range of recovery percentage (94.6–105.4%) demonstrated acceptable accuracy for all calibrants. Upstream samples obtained from 2-L bioreactors containing cells from cell line 1 and cell line 2 were used in this study to investigate matrix effects. Early phase (day 3) and late phase (day 13) samples were chosen to compare elemental uptake by the cells during specific growth phases. The multiple standard solution (1 μg/L) was spiked into each sample before assay to measure the related recovery.
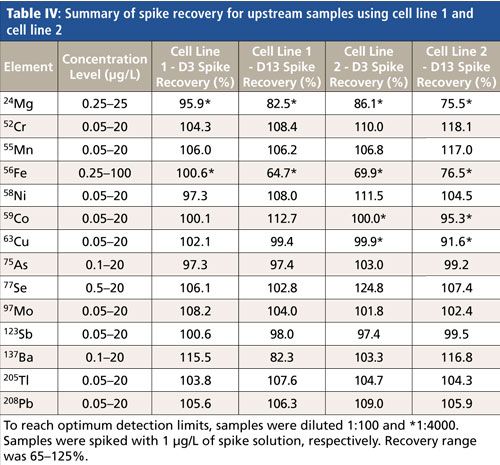
Table IV summarizes the results of all spike recoveries (%). The spike recovery values were within the range of 65–125%, indicating the capability of this method to recover successfully in the presence of matrix. Based on specific concentration levels in cell culture media, some abundant elements such as 24Mg and 56Fe were analyzed using a 1:4000 dilution. Elements such as Co and Cu were analyzed by larger dilutions within cell line 2 samples and smaller dilutions in cell line 1 samples.

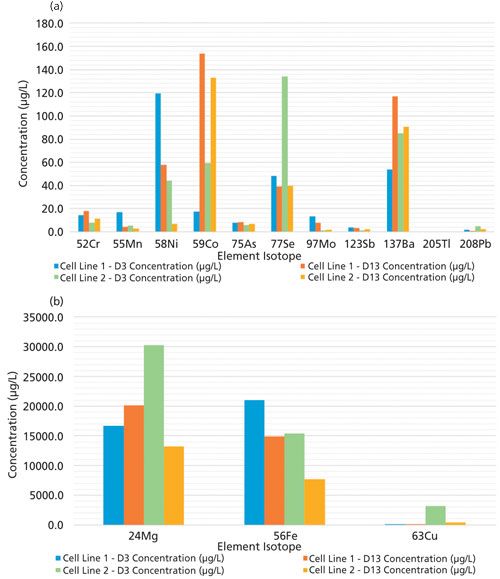
Compiled results for investigated elements in each cell line media are displayed in Figure 2. For a better comparison, 24Mg, 56Fe, and 63Cu were grouped together and all other elements were combined. Among all the elements, 56Fe, 58Ni, and 77Se concentrations were significantly decreased with process time in both cell lines. Specifically, 56Fe and 58Ni had much higher concentrations in cell line 1 media than in cell line 2 media and the concentration of 77Se was much higher in cell line 2 media than in cell line 1 media (in day 3). On the contrary, 59Co and 137Ba concentrations were increased from log phase to stationary phase in both cell lines. In addition, the 24Mg concentration had an upward trend in cell line 1 media but exhibited a downward trend in cell line 2 media. Similarly, a slight increase of 63Cu in cell line 1 media was evident, but a significant decrease in cell line 2 media was observed from the results.


Figure 2: Result comparison between trace elements within cell line 1 and cell line 2. Because of higher concentration levels, 24Mg, 56Fe, and 63Cu were grouped together, and the remaining elements were grouped together.
Discussion
The calibration results shown in Table II were linear over the measured concentration ranges for each element with R2 values of no less than 0.9998. Based on the percentage of check standard recovery, we can conclude that this analytical method is able to analyze all elements of interest without significant mass interferences. Noticeably, the spike recovery (%) of 56Fe shown in Table IV was lower than other elements in both cell lines. He mode with a collision cell was performed in Fe analysis with the intent to eliminate 40Ar16O+ and other polyatomic interferences. However, there are other potential sources of interference including adjacent elements such as Mg and Cu. These potential interferences may have contributed to the low spike recovery for Fe. Furthermore, high-density polyethylene (HDPE) centrifuge tubes that contained samples may introduce leachable trace elements during a typical storage period (8). Another possible reason for low spike recovery of 56Fe could be high salt and carbon effects. As observed in the semiquantitative-mode results, significantly high amounts of 23Na, 24Mg, 31P, and 34S were observed in both cell lines. The high concentrations of those elements increase noise levels in the measurement environment, which presents increased difficulty for discernment of the 56Fe signal. To reduce potential matrix effects in cell culture media of future studies, 0.01% Triton X-100 or 0.01% NaCl solution can be added to the diluent.
Noticeably, 24Mg concentration increased from log phase to stationary phase in cell line 1. On the contrary, 24Mg concentration in cell line 2 decreased from log phase to stationary phase. This difference may result from metabolic pathways unique to each cell line, which produces differing Mg uptake in facilitation of their metabolism. In addition, 77Se concentration in both cell lines was decreased in relation to cell growth, whereas much more significant uptake of 77Se was observed in cell line 2. Previous publications about Se (9) have reported an effect of Se on cell cycle and apoptosis. Therefore, a higher requirement of Se in cell line 2 may have a larger effect on cell viability and longevity, which correlates quite closely with product titer.
Conclusion
We have demonstrated that a dilute-and-shoot method combined with quadrupole ICP-MS is suitable to accurately analyze Mg, Cr, Mn, Fe, Co, Ni, Cu, As, Se, Mo, Sb, Ba, Tl, and Pb in two industrial cell lines using low sample volumes. The minimal required volume may be as low as 100 μL for each sample prep, which is significant for industrial researchers because it preserves precious sample. This method demonstrated the capabilities of ICP-MS and its functionality of analyzing trace-level elements simultaneously in two typical industrial cell lines. This assay has the potential to significantly accelerate the optimization of upstream processes in the biopharmaceutical industry and increase analytical testing efficiency.
Acknowledgment
This research was supported by the Process Development and Quality Control laboratories at Cook Pharmica LLC.
References
- C.K. Crowell et al., Biotechnol. Bioeng. 96(3), 538–549 (2007).
- H. Vanhoe and R. Dams, J. Anal. At. Spectrom. 9, 23–31 (1994).
- H. Vanhoe, J. Versieck, and R. Dams, Anal. Chem. 61(17), 1851–1857 (1989).
- G. Li et al., Am. J. Anal. Chem. 03(09), 646–650 (2012).
- M.A. Vaughan and D.M. Templeto, Clin. Chem. 37(2), 210–215 (1991).
- W.O. Moellmer, T.G. Miller, S. Wilbur, and E. Soffey, Spectroscopy22(1), 32–41 (2007).
- V. Thomsen, Spectroscopy27(3), 28–36 (2012).
- G. Kapadnis, “Analysis of Extractable and Leachable Metals in Plastic Materials of Construction as Per USP <661.1> Acid Extraction Procedure Using The Agilent 5110 VDV ICP-OES,” Agilent Technologies, 2016.
- H. Zeng, Molecules14(3), 1263–1278 (2009).
Wei Hong, Ilyas Holmes, Todd Stone, Robert Henry, Victor Vinci, and Yunsong Li are with Cook Pharmica LLC, in Bloomington, Indiana. Direct correspondence to: Yunsong.Li@cookpharmica.com


Newsletter
Get essential updates on the latest spectroscopy technologies, regulatory standards, and best practices—subscribe today to Spectroscopy.