Article
Special Issues
Spectroscopy Supplements
Nonderivatized Drug-Screen Analysis in Urine with Automated Solid Phase Microextraction and Comprehensive Two-Dimensional GC-TOF-MS
This article discusses the potential use and application of comprehensive multidimensional gas chromatography-time-of-flight mass spectrometry in forensic toxicology analysis for illicit drugs in urine without sample derivatization.
This research investigates the potential use and practical application of comprehensive multidimensional gas chromatography–time-of-flight-mass spectrometry (GC x GC–TOF-MS) in forensic toxicology analysis for a diverse range of illicit drugs in urine without sample derivatization. Conventional methods for the analysis of drugs in urine use time-consuming sample derivatization for GC–MS analysis to enhance chromatographic performance. This study utilizes GC x GC to increase peak capacity and resolution in combination with TOF-MS detection followed by data processing with deconvolution software algorithms for the identification and quantitation of nonderivatized drugs in urine.
Current trends indicate a global rise in the abuse of both prescription and illicit drugs. In the "National Drug Threat Assessment Summary for 2009," published by the National Drug Intelligence Center, the U.S. Department of Justice reported that more than 35 million individuals used illicit drugs or abused prescription drugs in 2007. In September of 2008, nearly 100,000 inmates in federal prisons were convicted for drug offenses, representing approximately 52% of all federal prisoners (1). Forensic crime laboratories are continually challenged to find faster and more efficient analytical methods and instrumentation to cope with ever-increasing sample backlogs. This experimental research explores the capabilities and utilization of automated sample handling using solid-phase microextraction (SPME) for nonderivatized urine samples along with comprehensive two-dimensional gas chromatography (GC x GC) coupled with time-of-flight-mass spectrometry (TOF-MS) as a practical instrumental resource to increase forensic drug screening laboratory throughput and productivity.


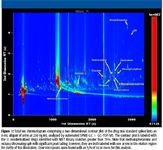
Figure 1
Recent forensic drug-screening applications have moved toward utilization of liquid chromatography with tandem MS detection (LC–MS-MS) to eliminate labor-intensive and time-consuming sample derivatization before analysis (2). Conventional MS methods for drug screening in urine use sample derivatization techniques before GC–MS analysis. This exploratory research utilizes automated SPME-GC x GC–TOF-MS for various drugs of abuse analysis in urine without time-consuming sample derivatization. Methamphetamine, cocaine, diacetylmorphine, codeine, oxycodone, ecstasy, acetylcodeine, monoacetylmorphine, hydrocodone, benzodiazepine, and LSD spiked as a standard mixture into urine were identified by this research. The variety of drugs utilized for this study represent distinct, as well as similar, chemical classes and functionalities.

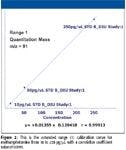

Figure 2
The objectives of this research demonstrate the detectability of nonderivatized drugs in complex biological samples such as urine. This article describes the calibration linearity capabilities over the range of 10–1000 ng/mL for drug screening in urine using SPME of nonderivatized samples coupled with GC x GC–TOF-MS. The feasibility of this analysis is described by illustrating the advantages of GC x GC and TOF-MS. Data from this research will show trace level part-per-billion (ppb) identification of targeted drugs in complex sample matrices. The use of automated SPME applied to nonderivatized urine samples, coupled with comprehensive two-dimensional chromatography and TOF-MS detection, demonstrates that this is a favorable technique for qualitative and quantitative analysis.

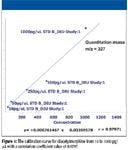
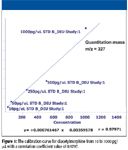
Figure 3
Experimental
A multiple-drug standard mixture prepared from Sigma Aldrich standards (St. Louis, Missouri) was spiked at concentrations from 10 to 1000 ppb into 8-mL aliquots of urine. Automated sample preparation was conducted on the nonderivatized spiked urine standards using an MPS2 autosampler (Gerstel, Linthicum, Maryland) equipped with a SPME prepstation. The extracted sample was then subjected to thermal desorption in the GC injection port. Aliquots of urine spiked with the drug standard mixture were prepared at the concentrations of 10, 50, 250, 500, and 1000 ng/mL. Hexachlorobenzene was added to each sample as an internal standard at 500 ng/mL before extraction. The samples required no further sample preparation prior to SPME extraction and GC x GC–TOF-MS analysis. Each sample was placed in a 10-mL glass SPME autosampler vial and sealed. Extraction was conducted on 8-mL aliquots spiked with the drug stock standard mixture at the specified concentration ranges from 10 to 1000 ng/mL using the MPS2 Prepstation (Gerstel). The results were generated with a Pegasus 4D GG x GC–TOF-MS instrument (LECO, St. Joseph, Missouri) equipped with a Gerstel MPS2 autosampler and SPME prepstation. The LECO Pegasus 4D was equipped with an 7890 gas chromatograph (Agilent, Wilmington, Delaware) featuring a LECO quad jet dual-stage thermal modulator and secondary oven. LECO ChromaTOF software with True Signal Deconvolution was used for all acquisition control and data processing. The autosampler was a single-rail Combi Pal (CTC, Zwingen, Switzerland) equipped with an SPME sample agitator/prepstation and a SPME fiber-conditioning station. Automated sample extraction was performed using a 50/30 µm DVB–Carboxen–PDMS Stable Flex SPME fiber (Supelco-Sigma-Aldrich, Bellefonte, Pennsylvania) (3). The SPME method was developed in the ChromaTOF software autosampler methods section using the CTC Combi PAL option. The sample agitator was set to "ON" at a speed of 200 rpm and extraction temperature of 37 °C. The SPME time was set for 30 min, and sample desorption time in the GC injection port was 2 min. The SPME fiber was then conditioned in the fiber bakeout station at 270 °C for 40 min before concurrent sample extraction for the next analysis.


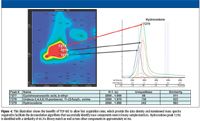
Figure 4
A 30 m x 0.25 mm x 0.25 µm film thickness, Rxi -5ms,(Restek Corp., Bellefonte, Pennsylvania) GC capillary column was used as the primary column for the analysis. In the GC x GC configuration, a second column 1.5 m x 0.18 mm id. x 0.18 µm film thickness Rtx-200 (Restek Corp.) was placed inside the LECO secondary GC oven after the thermal modulator. The helium carrier gas flow rate was set to 1.5 mL/min at a corrected constant flow via pressure ramps. The primary column was programmed with an initial temperature of 40 °C for 2.00 min and ramped at 6 °C/min to 290 °C for 10 min. The secondary column temperature program was set to an initial temperature of 50 °C for 2.00 min and then ramped at 6 °C/min to 300 °C with a 10-min hold time. The column temperature offset between the primary and secondary column oven temperature program was +10 °C. The liquid nitrogen–cooled thermal modulator was set to +25 °C relative to the secondary oven and a modulation time of 5 s was used. The MS mass range was 45–550 m/z with an acquisition rate of 200 spectra/s. The ion source chamber was set to 230 °C, and the detector voltage was 1650V with an electron energy of –70eV.

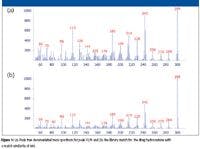
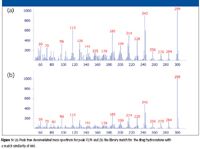
Figure 5
Results and Discussion
A total of 11 drugs of abuse and metabolites were detected in this analysis of nonderivatized drugs spiked in urine. methamphetamine, cocaine, diacetylmorphine, codeine, oxycodone, ecstasy, acetylcodeine, monoacetylmorphine, hydrocodone, benzodiazepine, and LSD were identified by comparison match to the NIST 05 mass spectral library. This analysis illustrates the capability of comprehensive two-dimensional chromatography coupled with TOF-MS to provide maximum chromatographic separation and resolution along with deconvolution algorithms to accurately identify trace parts-per-billion levels of drugs of abuse in urine without time-consuming sample derivatization. On average, 9000 peaks were found per sample with an S/N of 50, confirming the complexity of the sample matrix and difficulty of this type of analysis. The chromatogram in Figure 1 illustrates the increased peak capacity and resolution power of the extended chromatographic plane made available by comprehensive two-dimensional chromatography. The TOF mass spectrometer that was used acquires continuous full-range nonskewed mass spectra at acquisition rates of up to 500 spectra/s, thereby achieving the fast detection needed for accurate identification of peaks in a complex biological matrix such as urine.
Detectability of Nonderivatized Drugs in Urine by Automated SPME-GC x GC–TOF-MS
The minimum detectable concentrations calculated were based upon the data collected from this research of urine samples spiked with the drug standard mixture at the concentration range of 10–1000 ppb. Relative limits of detection were calculated for seven drugs by extrapolation from the ratio of concentration versus signal to noise. The relative limits of detection indicate that drug screening in urine without sample derivatization is sensitive to very low parts-per-billion or even parts-per-trillion levels by automated SPME-GC x GC–TOF-MS analysis. These results highlight the increased peak detectability realized by thermally modulated two-dimensional chromatography, which provides very narrow peak widths and increased peak height and thereby maximizes chromatographic efficiency.

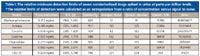
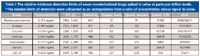
Table 1
Calibration Linearity for Eight Nonderivatized Drugs of Abuse
Five-point calibration curves were developed from 10 to 1000 ng/mL for eight nonderivatized drugs of abuse in this research. Good calibration linearity was observed for all eight components, even for two components that exhibited poor peak shape. Methamphetamine and ecstasy are known to give poor chromatographic performance and exhibit significant peak tailing. The "peak combine" feature in the software was used to overcome the chromatographic peak tailing and designate accurate peak areas for methamphetamine and ecstasy. The extended range capability in the calibration feature of the software was utilized to define different quantitation masses of two overlapping calibration ranges for the same analyte. The extended range calibration capability was applied in the calibrations for methamphetamine and cocaine to compensate for ion fragment mass signal saturation from particular fragment ions in the mass spectrum. The software used here allows the user to define a second quantitation mass spectral ion fragment that is not signal saturated, thereby allowing greater dynamic concentration range for a specific analyte in a single calibration. The nonderivatized drugs in urine analysis achieved linearity of 95% or greater for six out of the eight drugs selected in this research. All of the components achieved at least 90% linearity for the concentration range from 10–1000 ng/mL.

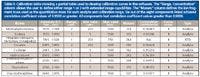
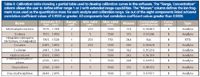
Table 2
TOF-MS Mass Spectral Deconvolution
TOF-MS produces continuous nonskewed spectra across the full mass range, which is sampled simultaneously from the ion source. Mass spectra obtained by TOF-MS maintain uniformity across the entire peak for a specific analyte. This allows deconvolution algorithms of coeluted chromatographic peaks to be accomplished more effectively and accurately in comparison with deconvolution of skewed mass spectra obtained from scanning mass spectrometers. The illustration in Figure 4 shows how successful mass spectral deconvolution is achieved in a compressed time window of 40 ms analyzed by TOF-MS. The peak markers labeled at peak 7277, 7278, and 7279 in the contour plot on the left in Figure 4 are then illustrated by the one-dimensional chromatogram of the unique ion mass for each component on the right-hand side of the figure, designated by arrows for each of the three selected peaks. The overlapping peaks observed in the one-dimensional chromatogram for the unique masses of the three selected analytes illustrate the importance of acquiring uniform nonskewed mass spectra across the entire chromatographic peak. This allows deconvolution algorithms to provide accurate spectral information for peak identification. The fast acquisition rates available with TOF-MS provided the data density needed to deconvolute the drug hydrocodone successfully from two other components in the time window of 40 ms.
Effective deconvolution of nearly coeluted peaks is observed in Figure 5a by the deconvoluted mass spectrum for hydrocodone, Peak 7279, previously illustrated in Figure 4 in the contour plot and first dimension chromatograms. The mass spectrum in Figure 5b is the NIST 05 library mass spectra for hydrocodone. The match of 893 out of 1000 shows a high degree of mass spectral similarity. This example illustrates the value of nonskewed full mass range high density data available with TOF-MS and the impact of such data on performing accurate identifications even in complex sample matrices.
Conclusions
This investigation employed GC x GC–TOF-MS as well as SPME without labor- and time-intensive sample derivatization to optimize qualitative and quantitative capabilities for drug-screening analysis in urine. Automated SPME-GC x GC–TOF-MS analysis results show that parts-per-billion levels of drugs from various chemical classes can be detected successfully. This experimentation achieved calibration linearity of 90% or greater for eight drugs with a concentration range from 10 to 1000 ng/mL in heavy sample matrices. The results of this study indicate that trace-level screening of drugs in urine can be performed without time-consuming and complex sample derivatization, providing accurate and positive identifications by automated SPME coupled with GC x GC–TOF-MS. GC x GC–TOF-MS combined with automated SPME achieves the chromatographic resolution, analyte sensitivity, and mass spectral integrity that can identify trace parts-per-billion levels of drugs accurately in complex sample matrices without sample derivatization.
John Heim and Scott Pugh are with LECO Corporation, Life Science and Chemical Analysis Center, St. Joseph, Michigan.
References
(1) National Drug Threat Asssessment 2009, National Drug Intelligence Center, U.S. Department of Justice, pp. 1–2, www.usdoj.gov/ndic/pubs31/31379/31379p.pdf
(2) S. Robinson and S. McDonnel, Clincal/Toxicology Application Notebook, May 2008, p. 6
(3) Supelco Application Bulletin 901A, Solid Phase Microextraction/Capillary Analysis of Drugs, Alcohols, Organic Solvents in Biological Fluids, Supelco-Sigma-Aldrich Co.


Newsletter
Get essential updates on the latest spectroscopy technologies, regulatory standards, and best practices—subscribe today to Spectroscopy.