Article
Special Issues
Spectroscopy Supplements
Rapid Surface-Enhanced Raman Spectroscopy Detection of Low-Dose APIs in Pharmaceutical Drugs
Author(s):
A simple SERS-based method was used to identify low doses of the APIs alprazolam, codeine, oxycodone, and hydrocodone using a handheld Raman spectrometer.
Abuse of prescription drugs in the United States has skyrocketed in recent years. The prevalence of prescription drug abuse has also resulted in the emergence of counterfeit pharmaceutical drugs, which often contain no active pharmaceutical ingredient (API) and instead may contain ingredients that are highly potent or dangerous. Because of the pervasiveness of these prescription drugs it is necessary to develop a technique that allows law enforcement officers, forensic analysts, and pharmaceutical scientists to quickly identify a genuine prescription drug. In this study we developed a simple surface-enhanced Raman spectroscopy (SERS)-based method to identify low-dose APIs alprazolam, codeine, oxycodone, and hydrocodone in prescription pharmaceutical drugs using a handheld Raman spectrometer with an on-board matching algorithm.
Prescription drug abuse has reached epidemic levels in the United States in the past decade. It is estimated that in 2012 at least 16.7 million people over the age of 12 abused prescription drugs, representing a 250% increase in prescription drug abuse over the previous 20 years (1). Furthermore, to keep up with the consumer demand for prescription drugs, drug traffickers produce inexpensive counterfeit substances that contain no active pharmaceutical ingredient (API) and instead may contain harmful substances (2). Recently in the United States, laboratory analyses of seized shipments of what appeared to be the anxiety medication alprazolam showed that they contain no APIs and instead contain fentanyl, a highly potent opioid that is fatal to humans in doses upward of 2 mg, indicating that counterfeit drugs have now become a problem in both developed and developing nations (2). To combat both prescription drug abuse and the prevalence of dangerous counterfeit pharmaceuticals, it is necessary to develop a technique that can quickly confirm the identity of a suspected fake pill.
A survey of the literature shows that many traditional analytical methods are used for analyzing suspected counterfeit pharmaceutical drugs. High performance liquid chromatography (HPLC) has customarily been the most popular method in forensic and pharmaceutical laboratories for its ability to quantify APIs as well as impurities in a drug sample (3). In addition, Raman spectroscopy (4–6), near-infrared (NIR) spectroscopy (7–10), thin-layer chromatography (11), nuclear magnetic resonance (NMR) spectroscopy (12), X-ray fluorescence (XRF) spectrometry (13), and liquid chromatography–mass spectrometry (LC–MS) (14) have all been used in recent years to characterize suspected counterfeit drugs. However, chromatography-based techniques require extensive sample preparation that is best suited to highly trained staff in forensic or pharmaceutical laboratories, and some spectroscopic techniques, such as NIR, may require chemometric modeling.
Combating prescription drug abuse and the prevalence of counterfeit drugs will require collaboration between law enforcement officials, forensic chemists, and pharmaceutical companies. For a method to be a viable analytical technique for confirming a suspected counterfeit pill, it should be simple enough to be performed by nontechnical law enforcement officers, sensitive to detect any low-dose APIs, sufficiently selective to detect the API in a pill matrix that may contain other high-dose APIs and various excipients, and (ideally) portable. Raman spectroscopy is an attractive technique for rapid analysis of these counterfeit drugs. Portable Raman spectrometers have made such advancements in the last decade that handheld Raman spectrometers are now commonly used for applications such as pharmaceutical raw material identification (15), geology (16), and field forensic analysis (17), often by nontechnical end users. Although there are several studies that use Raman spectroscopy as a screening tool for potential counterfeit drugs, these studies typically require the development of chemometric models (for example, principal component analysis) to discriminate counterfeit samples, which are typically not readily available on handheld Raman spectrometers (5). Furthermore, Raman spectroscopy is limited by its inherent insensitivity, given that only one in ~1 million incident photons are Raman scattered. The concentrations of low-dose APIs in prescription drugs are typically too low for normal Raman spectroscopy to detect in a complex matrix, leaving law enforcement officials in the field with no option but to send the evidence back to a central laboratory for testing.
Surface-enhanced Raman spectroscopy (SERS) has grown rapidly in its applications in recent years, ranging from areas as diverse as biosensing (18) to art and archeology (19). The recent development of flexible and low-cost paper SERS substrates has enabled SERS to shift from the research laboratory into real-world field detection applications such as explosives detection (20), pesticides detection (21), and controlled narcotics detection (22). The ability of SERS to significantly enhance the Raman signal by a factor of ~106 while simultaneously quenching molecular fluorescence makes it an attractive technique for identifying low-dose APIs in pharmaceutical drugs. The accessibility, reliability, and simplicity of paper SERS substrates makes them a viable option for the rapid screening of confiscated counterfeit pharmaceutical drugs by local police officers, pharmaceutical technicians, and forensics analysts.
We have developed a simple SERS-based sampling method using commercially available paper SERS substrates that allow both technical and nontechnical users to quickly investigate confiscated prescription drugs containing the low doses of the APIs oxycodone, hydrocodone, alprazolam, and codeine using a handheld spectrometer. On-board spectral matching of a measured sample to a library spectrum was performed on the handheld instrument using a correlation coefficient algorithm, a common spectroscopy library matching technique (23,24). The ability to identify the low-dose API in a confiscated pharmaceutical pill using a handheld spectrometer allows law-enforcement officials to confirm the identity of a pill on-site before sending the evidence back to a central testing laboratory.
Experimental
SERS Sample Preparation Protocol
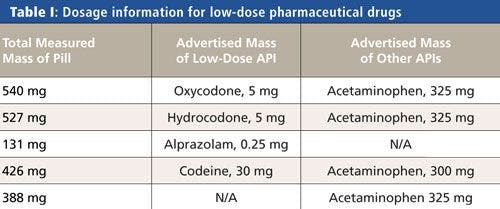
Samples of four pharmaceutical drugs with low doses of APIs were investigated. A sample of acetaminophen was also analyzed. Table I shows the advertised API dosage information for the pills tested. A one-quarter segment of a pill was typically a sufficient sample mass for all pill types, allowing for the remainder of the pill to be sent to a central laboratory for further testing. Pill segments were placed in individual 2.0-mL plastic centrifuge tubes. Then, ~0.5 mL of acetone was added to the centrifuge tubes. Plastic tubes were shaken until the sample dissolved and the solution looked noticeably cloudy (~30 s). For each tube, a commercially available paper SERS substrate was dipped into the centrifuge tube and allowed to sufficiently interact with the sample solution before analysis.


SERS Measurements
A B&W Tek iRaman Plus portable Raman spectrometer using a back-thinned charged-coupled device (CCD) array detector covering 65–3350 cm-1 and a 785-nm laser was used to acquire high-quality library spectra of the low-dose pharmaceutical APIs. A fiber-optic sampling probe was used to directly measure the SERS substrates. The laser power was adjusted to ~60–90 mW for all analyses. Typical acquisition times ranged from 10 to 20 s.
A B&W Tek TacticID handheld Raman spectrometer with 785-nm laser excitation was used for verification of the method. The SERS library spectra collected on the portable Raman spectrometer were imported into the handheld spectrometer. A sampling adapter to hold the paper substrates was used for all handheld Raman measurements. A laser power of ~30 mW was used for all handheld measurements, and typical automatic integration times ranged from 15 to 30 s. To account for sample heterogeneity within the plasmonic region of the substrate, at least two spots were analyzed on each SERS-active region. An on-board matching algorithm was used to match the SERS spectra obtained on the handheld spectrometer to a library spectrum.
Results and Discussion
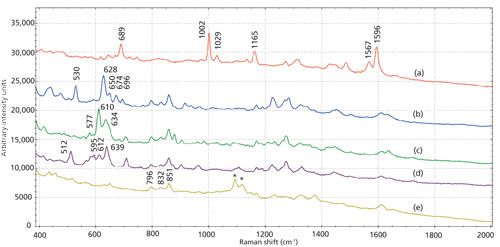
Figure 1 presents the SERS library spectra obtained from the four low dose prescription pills measured on the portable Raman spectrometer. The SERS spectrum from a pill containing alprazolam (Figure 1a) exhibits characteristic SERS peaks at 689 cm-1 (medium [m]), 1002 cm-1 (strong [s]), 1029 cm-1 (weak [w]), 1165 cm-1 (m), 1567 cm-1 (m), and 1596 cm-1 (s), which are consistent with previously reported SERS spectra of the API alprazolam (25). The SERS spectrum presented in Figure 1b from a pill containing acetaminophen with codeine shows characteristic peaks at 530 cm-1 (m), 628 cm-1 (s), 650 cm-1 (w), 674 cm-1 (w), and 696 cm-1 (w), which are consistent with a previously published codeine SERS spectrum (26). The SERS spectrum recorded from a pill containing oxycodone and acetaminophen (Figure 1c) has peaks at 577 cm-1 (w), 610 cm-1 (s), and 634 cm-1 (m), which are consistent with SERS peaks for the oxycodone low-dose API (27). Figure 1d presents the SERS spectrum from a hydrocodone and acetaminophen pill. Observed peaks at 512 cm-1 (m), 595 cm-1 (w), 612 cm-1 (w), and 639 cm-1 (s) are consistent with the SERS spectrum of the API hydrocodone (26).
The prescription drugs that contain low doses of oxycodone, codeine, and hydrocodone all include a high dose of acetaminophen. A sample of acetaminophen was also prepared using the SERS protocol. The SERS spectrum of acetaminophen in Figure 1e shows peaks at 796 cm-1 (m), 832 cm-1 (m), and 851 cm-1 (m). These peaks are also observed in the SERS spectra from the pills that contain oxycodone, codeine, and hydrocodone. The peaks at 1094 cm-1 and 1117 cm-1 labeled with asterisks in Figure 1e are consistent with cellulose in the paper support of the SERS substrate (28).

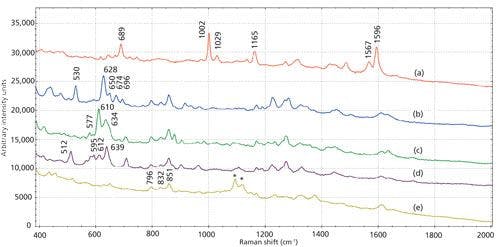
Figure 1: Library SERS spectra obtained on a portable Raman spectrometer with 785-nm excitation for four prescription pharmaceutical drugs containing low-dose APIs (a) alprazolam, (b) codeine, (c) oxycodone, and (d) hydrocodone. Spectrum (e) is the SERS spectrum from acetaminophen. Peaks labeled with asterisks are from the cellulose in the paper SERS substrate. Spectra are manually offset for clarification.
The high-quality SERS spectra of the low-dose APIs acquired on the portable Raman spectrometer were imported into a handheld Raman spectrometer as library spectra. The handheld spectrometer also contains thousands of Raman library spectra for narcotics, explosives, excipients, and other general chemicals. To match spectra measured on the handheld spectrometer to library spectra, a correlation coefficient algorithm is used to provide a hit quality index (HQI) value. The equation:

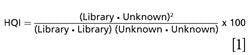

where Library is the mean-centered library spectrum on board the handheld spectrometer and Unknown is the mean-centered spectrum of the unknown sample measured on the handheld spectrometer, yields an HQI match that can range from 0 to 100. An HQI result of 100 represents a perfect match to a library spectrum, while a result approaching 0 presents a poor match. In the operating system of the handheld spectrometer, the user can set an HQI threshold so that only high HQI matches (for example, >90) are shown after a sample scan.
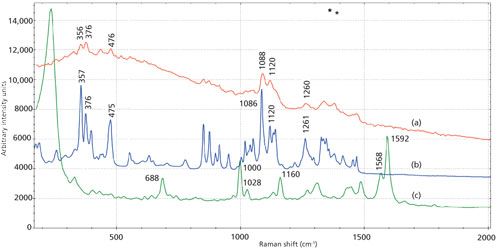
Figure 2a shows the Raman spectrum from a direct measurement with a handheld spectrometer on the surface of a pill containing a low dose of alprazolam. Raman peaks are present at 356 cm-1, 376 cm-1, 476 cm-1, 1088 cm-1, 1120 cm-1, and 1260 cm-1. No peaks consistent with alprazolam, are present in the Raman spectrum, indicating that normal Raman spectroscopy is too insensitive to identify the API on the surface the pill. On the handheld spectrometer, this spectrum matched to a library spectrum of lactose monohydrate (Figure 2b), one of the inactive ingredients in the pill, with an HQI of 86.7. After the SERS protocol was used on the alprazolam sample and the paper substrate was measured on the handheld spectrometer, SERS peaks consistent with alprazolam were observed at 688 cm-1, 1000 cm-1, 1028 cm-1, 1160 cm-1, 1568 cm-1, and 1592 cm-1 (Figure 2c). The SERS spectrum measured on the handheld spectrometer matched to the library SERS spectrum of alprazolam with an HQI of 95.9, demonstrating that the SERS protocol can identify a low dose of alprazolam in a pill using a handheld spectrometer, even though the API that makes up just <0.2% (w/w) of the pill.

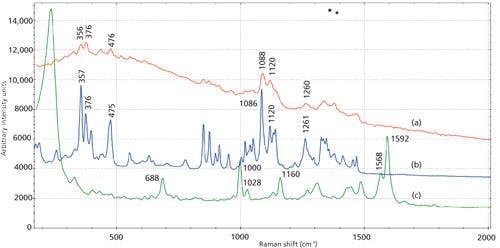
Figure 2: (a) Acquired handheld Raman spectrum from the surface of a pill containing a low dose of alprazolam, (b) library Raman spectrum of lactose monohydrate, and (c) acquired SERS spectrum from the alprazolam pill measured on a handheld spectrometer with peaks consistent with alprazolam. All spectra obtained with 785-nm excitation.
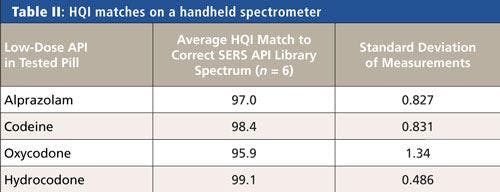
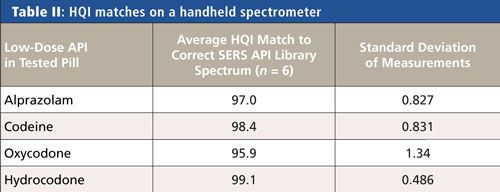
For each of the four prescription drugs tested, three pill samples were measured on separate paper SERS substrates. Table II shows the average of the six HQI results of the measured SERS spectra of the four prescription drugs to the on-board SERS library spectra of low-dose APIs. All SERS measurements of the pill samples matched correctly to the corresponding API library spectrum. The second-highest HQI matches for all measurements were below 80, demonstrating the discriminating power of the SERS method between the four low-dose APIs. The standard deviations of the measurements are also included in Table II, showing the reliability of the SERS measurements between samples.

Conclusion
A SERS-based sampling protocol was developed for the detection of several low-dose APIs in prescription pharmaceutical pills using a handheld spectrometer. The sample preparation for the SERS analysis is simple and can be easily performed by both laboratory technicians and nontechnical law enforcement officers. The SERS method demonstrates high selectivity for the APIs in the pills despite the presence of higher concentration APIs and various excipients. A handheld Raman spectrometer with on-board software processing capabilities was able to match the measured SERS spectrum to a library SERS spectrum of the correct API based on an HQI calculation. The ability to quickly confirm the presence of a low-dose API in a pharmaceutical pill is a valuable tool for local law enforcement, forensic laboratories, and pharmaceutical companies to combat the prevalence of counterfeit pills and prescription drug abuse in their communities.
References
- R.K. McHugh, S. Nielsen, and R.D. Weiss, J. Subst. Abuse Treat.48, 1–7 (2015).
- United States Drug Enforcement Administration, “Counterfeit Prescription Pills Containing Fentanyls: A Global Threat,” DEA Intelligence Brief from DEA Strategic Intelligence Section, https://content.govdelivery.com/attachments/USDOJDEA/2016/07/22/file_attachments/590360/fentanyl%2Bpills%2Breport.pdf.
- O. Shakoor, R.B.Taylor, and R.H. Behren, Trop. Med. Int. Health2, 839–845 (1997).
- M. de Veij, P. Vandenabeele, K.A. Hall, F.M. Fernandez, M.D. Green, N.J. White, A.M. Dondorp, P.N. Newton, and L. Moens, J. Raman Spectrosc. 38, 181–187 (2007).
- M. de Veij, A. Deneckere, P. Vandenabeele, D. de Kaste, and L. Moensa, J. Pharm. Biomed. Anal.46, 303–309 (2008).
- M.R. Witkowski, Am. Pharm. Rev. 8, 56 (2005).
- S. Henrique, F. Scafi, and C. Pasquini, Analyst 126, 2218–2224 (2001).
- O.Y. Rodionova, L.P. Houmøller, A.L. Pomerantsev, P. Geladi, J. Burger, V.L. Dorofeyev, and A.P. Arzamastsev, Anal. Chim. Acta. 549, 151–158 (2005).
- F.E. Dowell, E.B. Maghiranga, F.M. Fernandez, P.N. Newton, and M.D. Greene, J. Pharm. Biomed. Anal. 48, 1011–1014 (2008).
- M.J. Vredenbregt, L. Blok-Tip, R. Hoogerbrugge, D.M. Barends, and D. de Kaste, J. Pharm. Biomed. Anal.40, 840–849 (2006).
- J. Sherma, Acta Chromatog. 19, 5–20 (2007).
- U. Holzgrabea and M. Malet-Martinob, J. Pharm. Biomed. Anal. 55, 679–687 (2011).
- R.S. Ortiza, K.C. Mariotti, N.V. Schwab, G.P. Sabin, W.F.C. Rocha, E.V.R. de Castro, R.P. Limberger, P. Mayorga, M.M.S. Bueno, and W. Romão, J. Pharm. Biomed. Anal. 58, 7–11 (2012).
- K.A. Hall, P.N. Newton, M.D. Green, M. de Veij, P. Vandenabeele, D. Pizzanelli, M. Mayxay, A. Dondorp, and F.M. Fernandez, Am. J. Trop. Med. Hyg. 75, 804–811 (2006).
- K.A. Bakeev and R.V. Chimenti, Euro. Pharma. Review, http://www.europeanpharmaceuticalreview.com/wp-content/uploads/Bakeev-Web-Article_proof.pdf (2013).
- J. Jehlicka, A. Culka, P. Vandenabeele, and H.G.M. Edwards, Spectrochim. Acta A.80, 36–40 (2011).
- M. D. Hargreaves, R.L. Green, W. Jalenak, C.D. Brown, and C. Gardner in Infrared and Raman Spectroscopy in Forensic Science, J.M. Chalmers, H.G.M. Edwards, and M.D. Hargreaves, Eds. (John Wiley & Sons, Ltd, Chichester, UK, 2012), pp. 275–288.
- K.C. Bantz, A.F. Meyer, N.J. Wittenberg, H. Im, Ö. Kurtulus, S.H. Lee, N.C. Lindquist, S-H Oh, and C.L. Haynes, Phys. Chem. Chem. Phys. 13, 11551–11567 (2011).
- D. Bersani, C. Conti, P. Matousek, F. Pozzi, and P. Vandenabeele, Anal. Methods8, 8395-8409 (2016).
- P.M. Fierro-Mercado and S.P. Hernández-Rivera, Int. J. Spectro. Article ID 716527, 1–7 (2012).
- Y. Zhu, M. Li, Daoyang Yu, and L. Yang, Talanta128, 117–124 (2014).
- W.W. Yua and I.M. White, Analyst138, 1020–1025 (2013).
- S. Farquharson, C. Shende, A. Sengupta, H. Huang, and F. Inscore, Pharmaceutics3, 425–439 (2011).
- R.L. Mccreery, A.J. Horn, J. Spencer, and E. Jefferson, J. Pharm. Sci. 87, 1–8 (1998).
- E.L. Doctor, “Development of a Surface-Enhanced Raman Spectroscopy Method for the Detection of Benzodiazepines in Urine”(2014). FIU Electronic Theses and Dissertations, Paper 1642.
- V. Rana, M.V. Cañamares, T. Kubic, M. Leona, and J.R. Lombardi, J. Forensic Sci.56, 200–207 (2011).
- H-Y Wu and B.T. Cunningham, Nanoscale6, 5162–5171 (2014).
- J.H. Wiley and R.H. Atalla, Carbohydr. Res. 160, 113–129. (1987).
Kristen Frano is an Applications Engineer with B&W Tek in Newark, Delaware. Dawn Yang is an Applications Manager with B&W Tek. Direct correspondence to:
kristenf@bwtek.com or dawny@bwtek.com


Newsletter
Get essential updates on the latest spectroscopy technologies, regulatory standards, and best practices—subscribe today to Spectroscopy.