Lithium-Ion Battery Manufacturing and Quality Control: Raman Spectroscopy, an Analytical Technique of Choice
The efficiency of renewable energy technologies, such as solar and wind power, has drastically increased over the last decade, whereas the cost of owning these technologies has decreased significantly. As a result, these changes have created a huge demand for energy storage devices, including batteries. Of particular interest is the development and improvement of portable lithium-ion (Li-ion) batteries because of their advantages over traditional battery technologies, including having higher energy density compared to other existing rechargeable batteries and faster charging. Researchers are constantly investigating ways to make Li-ion batteries more efficient and safer. Currently, the Li-ion battery technology is far from perfect and there have been several high-profile reports of failures, including explosions and fires caused during charging, use, and storage. In this regard, Raman spectroscopy has proven to be a powerful tool for research and quality control of Li-ion batteries. In this paper, we present Raman as a technique of choice for quality control of manufacturing processes of Li-ion batteries. We highlight two cases of bulk analysis of lithium compounds using Raman spectroscopy during the quality control procedure of raw materials, and one case of analysis for better manufacturing using Raman imaging microscopy.
Sir C.V. Raman contemplated the color of the sea on a sea trip returning back to India from England in 1921. These contemplations led him to conduct a series of research experiments on the scattering of light in then British Calcutta. In 1928, he discovered that when a beam of colored light entered a liquid, a fraction of the light scattered by that liquid was a different color (1–3). Raman showed that the nature of this scattered light was dependent on the type of sample present. Other scientists understood the significance of this phenomenon as an analytical and research tool, and called it the Raman effect. This method became even more valuable with the advent of modern lasers, optics, and computers, with current uses ranging from the nondestructive identification of minerals to the early detection of life-threatening diseases. Raman was awarded the Nobel Prize in physics in 1930 for his discovery (4).
Today, Raman spectroscopy is utilized by researchers and quality control analysts as a tool to analyze cells, tissues, minerals, pharmaceutical compounds, and nanomaterials (5), and it plays an important role in developing new materials as well as in the large-scale manufacturing of such materials.
Over the last decade, with the increased use of renewables and the need for energy storage, researchers have been investigating new generations of materials for rechargeable lithium ion (Li-ion) batteries. Raman spectroscopy plays an important role in this research phase for characterizing novel anode and cathode materials (6–8). Raman spectroscopy has many advantages, but the most important one for battery applications involves the detection and measurement of subtle changes in molecular structure or local chemical environments because the Raman spectral results can easily be correlated with the electrochemical performance.
Raman spectroscopy has been used to analyze many different types of battery components, including cathode materials, anode materials, and electrolytes (6–9). During the manufacturing of Li-ion batteries, there are several challenges and bottlenecks in the analysis workflows. Raman spectroscopy and Raman microscopy can overcome these challenges, especially for analyzing lithium compounds, anode, and cathode slurries, and then utilizing Raman imaging for the defect analysis of anode and cathode films during production. This article focuses on examples of how Raman spectroscopy has been used for the analysis of lithium compounds and how Raman imaging can help solve complex problems arising in the production of anode and cathode films.
Analysis and Observations
Analysis of Raw Materials and Various Battery Components
Li-ion battery manufacturing involves active anode and cathode materials, solvents, and separator films. It is mandatory to control the chemical properties of the materials from suppliers of the components and bulk lithium compounds. A variety of analytical techniques are employed, ranging from bulk sample measurement to surface analytical techniques at various production stages. Techniques such as inductively coupled plasma (ICP)-mass spectrometry (MS) and ICP–optical emission spectroscopy (OES) are widely used in analyzing impurities. At manufacturing plants where they develop their own standards (and also rely on the certificate of analysis provided by the suppliers of raw materials), bulk analysis of samples is carried out using vibrational spectroscopy techniques because of the nondestructive and rapid analysis those techniques provide.
Raman spectroscopy is well suited for bulk analysis of polyatomic lithium salts because the technique is sensitive to hydrated forms of salts. Typical analysis can be carried out without sample preparation and typical analysis time is in minutes.
Lithium hydroxide (and its hydrated forms) and lithium carbonate are used as raw materials for battery manufacturing. It is mandatory to check the chemical identity of these materials and to check whether carbonate is present in lithium hydroxide salts before using them in production. Raman spectroscopy is well suited for this task; typical wet chemistry analytical tests, in contrast, take longer and are destructive.
A Thermo Fisher Scientific DXR3 SmartRaman spectrometer was used to acquire the spectrum of the battery grade lithium hydroxide anhydrous (A) and the spectrum was compared with the lithium carbonate and library reference spectrum of lithium hydroxide monohydrate. The DXR3 SmartRaman is a versatile instrument with sampling flexibility and ease of use. Its universal plate holder enables analysis of solids and liquids with ease. Additionally, the fiber optic probe can enable in situ measurements or can be located in the glove box for analyzing environmentally sensitive samples, such as battery electrolyte solutions.
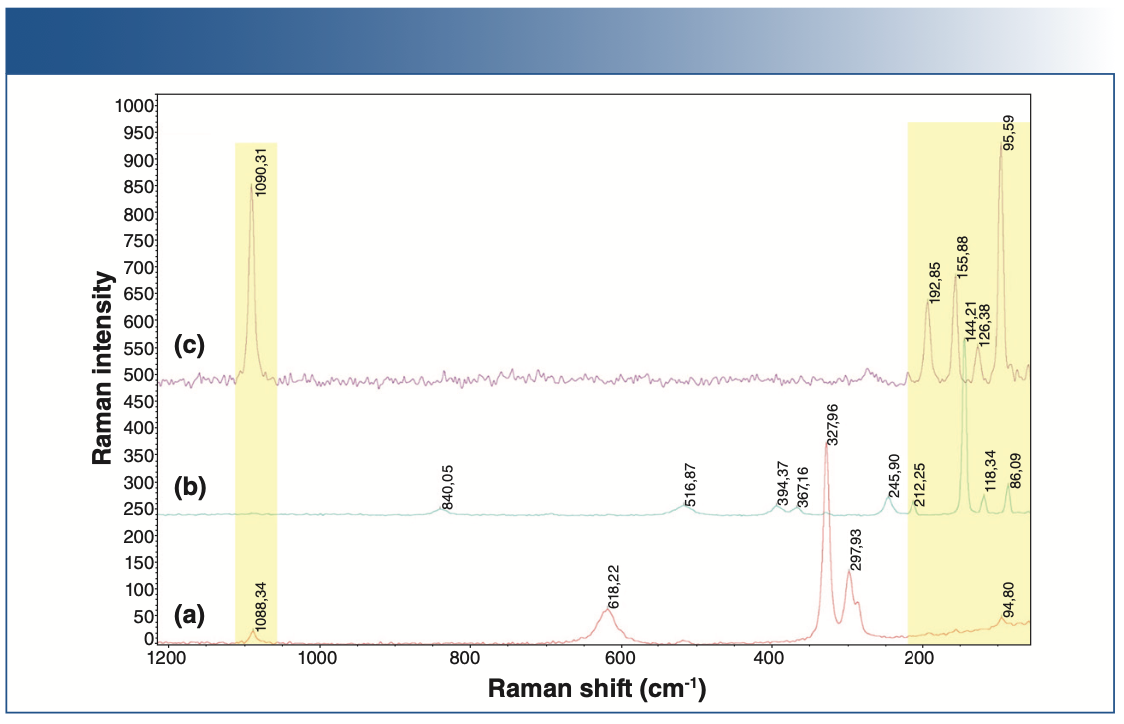
The shaded areas in Figure 1 show the peaks related to the carbonates, and it can be seen that the battery-grade lithium hydroxide is free from the contaminants. Tests carried out indicated the suitability of lithium hydroxide for cathode manufacturing.

 lithium hydroxide anhydrous, (b) lithium hydroxide monohydrate, and (c) lithium carbonate.")
FIGURE 1: Raman spectra of: (a) lithium hydroxide anhydrous, (b) lithium hydroxide monohydrate, and (c) lithium carbonate.
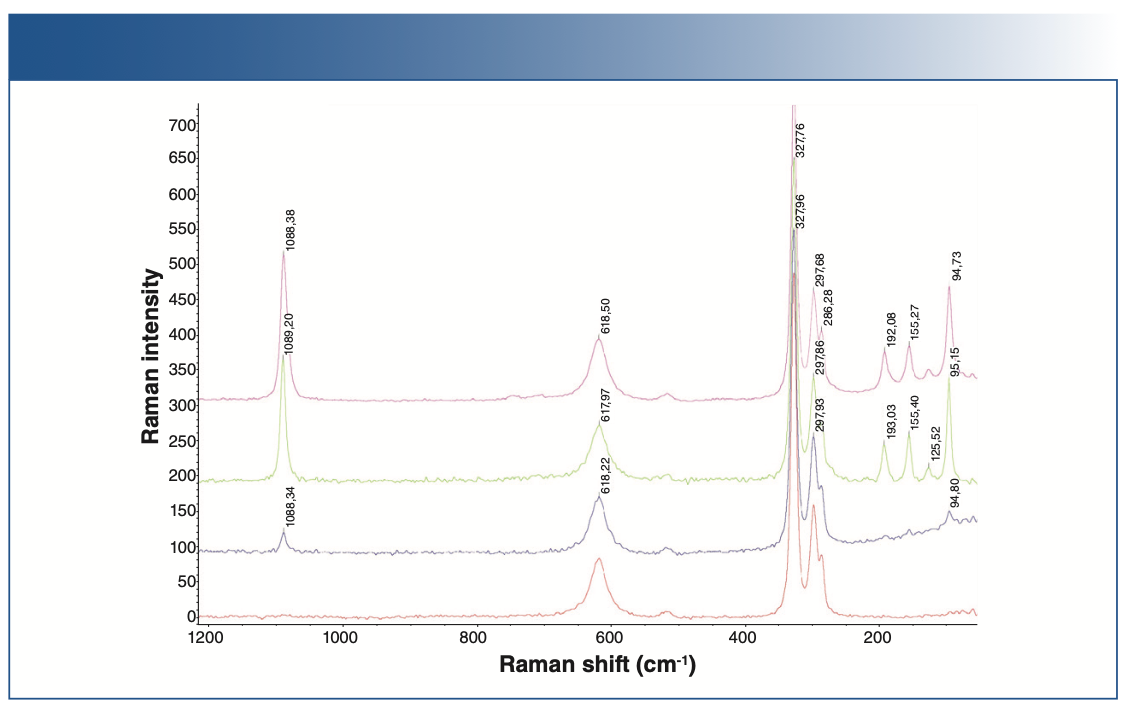
In other tests, several batches of battery-grade lithium hydroxides were compared to check the presence of carbonates. As seen in Figure 2, the Raman spectrum in red shows no contaminants, and the spectra in violet, green, and blue shows the presence of carbonates as contaminants (regions below 2000 cm-1).


FIGURE 2: Raman spectra of battery-grade lithium hydroxide.
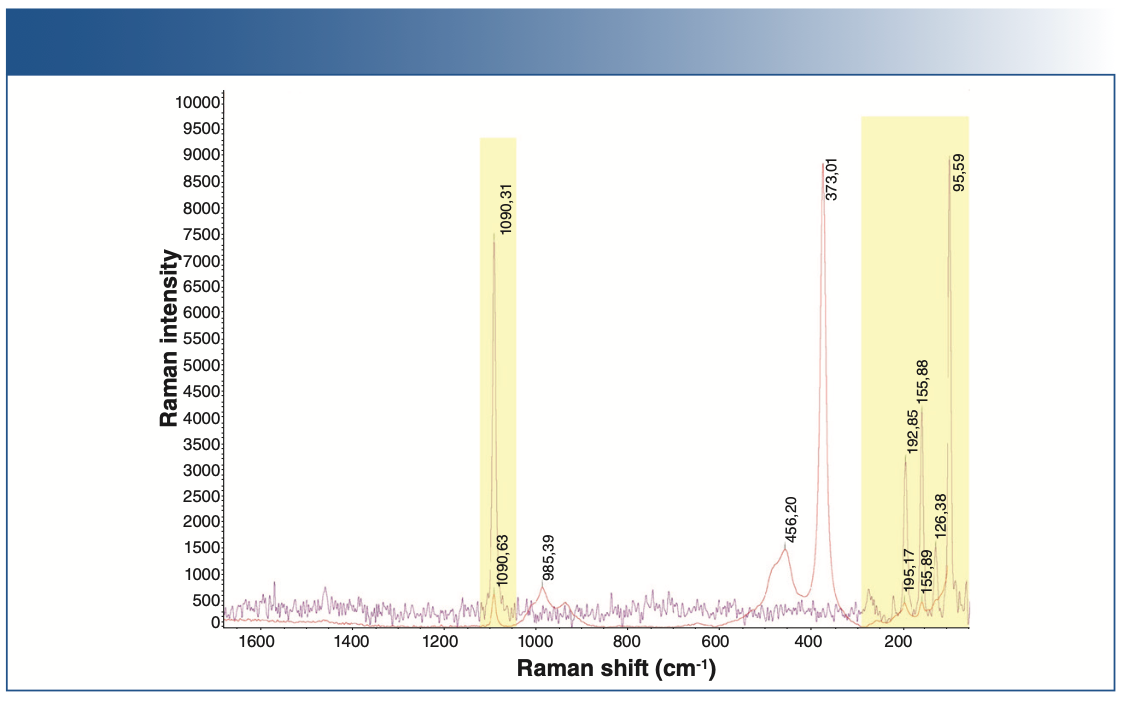
Lithium sulfide (Li2S) is another active cathode material used in high-performance solid-state batteries. The presence of carbonates were found easily with bulk sample analysis carried out with Raman analysis.
Figure 3 shows the Raman spectrum of lithium sulfide in red and lithium carbonate in violet. As seen from the shaded area, there are carbonate impurities present in the battery-grade lithium sulfide.

 compared with lithium carbonate (violet).")
FIGURE 3: Raman spectra of lithium sulfide (red) compared with lithium carbonate (violet).
The primary source of waste in battery manufacturing is coating defects. Currently, electrodes with defective coatings are discarded regardless of the type of defect, which greatly increases the cost of production as the raw materials for electrode manufacturing are very expensive. The quality of the electrode coating depends on uniform thickness, porosity, material distribution, and adhesion to the current collector. Any inhomogeneity of these properties results in defects that lead to local aging of the electrode and a loss in capacity and cycle life.
There are several tests that manufacturers carry out to determine the distribution of organic compounds on the anode and cathode surfaces, to trace the migration of binder on carbon-based anodes, to check for contamination on formed anode and cathode films, and to investigate the thin layer solid electrolyte interface.
After the batteries are assembled and final tests are completed, investigations are carried out on failed batteries to determine the root cause of failure. For such analysis, Raman imaging can be a great tool to complement X-ray photoelectron spectroscopy (XPS) and scanning electron microscopy (SEM) analysis. Next, we present few examples of such analysis.
Raman Chemical Imaging of Pristine and Cycled Anodes
Raman spectra of the baseline anode and the cycled anode are shown in Figures 4 and 5. Raman spectral acquisition and imaging were carried out using a Thermo Fisher Scientific DXR3xi Raman imaging microscope. All the samples showed distinct D, G, and 2D bands, characteristic of graphitic carbon. The uncycled, pristine baseline sample had the lowest fluorescence background. The cycled anodes showed varying degrees of fluorescence, indicative of the amount of impurities. For example, anode 5 has the least amount of impurities, thus showing the least fluorescence compared to the others. Fluorescence in Raman spectra of cycled electrodes is common and can originate from multiple sources, such as SEI, residual electrolyte, or transition metal complexes.

, pristine anode 2 (violet), pristine anode 3 (green), pristine anode 4 (red).")
FIGURE 4: Raman spectra of pristine cathodes: pristine anode 1 (blue), pristine anode 2 (violet), pristine anode 3 (green), pristine anode 4 (red).
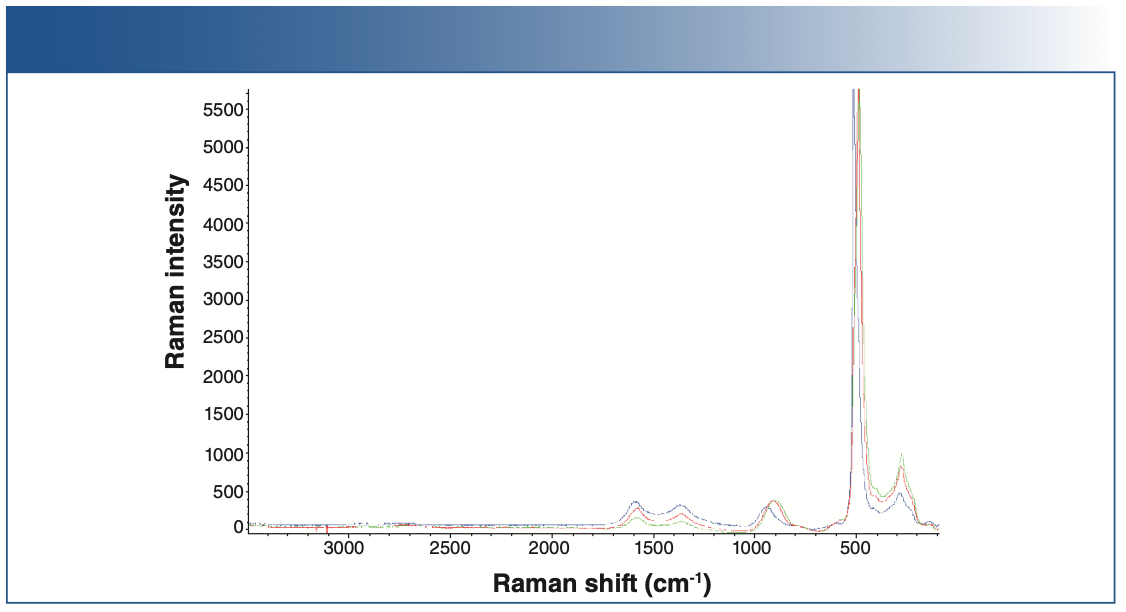


FIGURE 5: Raman spectra of different cycled cathodes.
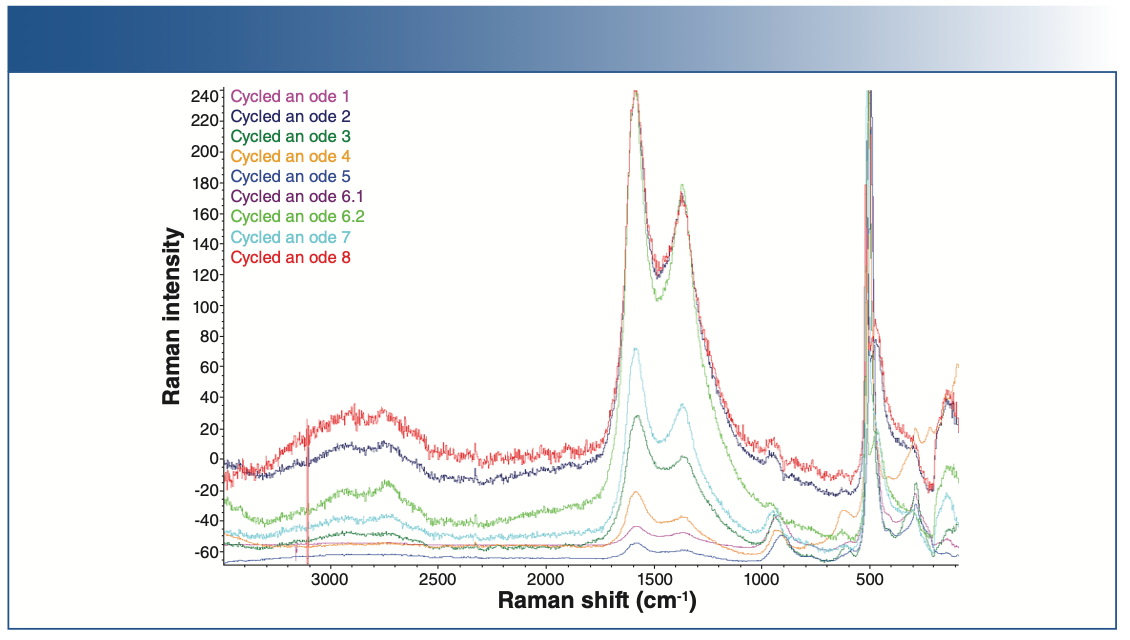
The Raman spectra of the anodes show contributions from three major components: graphite, carbon black, and fluorescence.
The Raman spectra of the cycled anode exhibits two peaks at 1346 and 1582 cm-1, corresponding to the D and G bands, respectively. The D band corresponds to the presence of defects, and the G band indicates ideal graphitic sp2 carbons. The ratio of the D and G band intensities (ID/IG) is considered to indicate the degree of disorder in a carbon structure.
During Raman imaging, spectral data collection is synchronized with sample stage movement so that a complete Raman spectrum at each point in the sample (or an area of interest) is acquired. This used to be called Raman mapping; however, with the increased sensitivity and speed of the modern-day instruments, the data can be collected in minutes rather than days, so the term Raman imaging is more commonly used.
The areas in Figure 6 shaded in red mark the G band with higher width and in green correspond to the lower width of the G band, which shows smaller crystals, and therefore a lower order, going more amorphous.

 is approximately 100 μm x 100 μm, and the Raman image (overlay image) is approximately 50 μm x 50 μm in spatial dimensions.")
FIGURE 6: Image of the cycled cathode overlay with Raman chemical image. The entire picture (visible image) is approximately 100 μm x 100 μm, and the Raman image (overlay image) is approximately 50 μm x 50 μm in spatial dimensions.
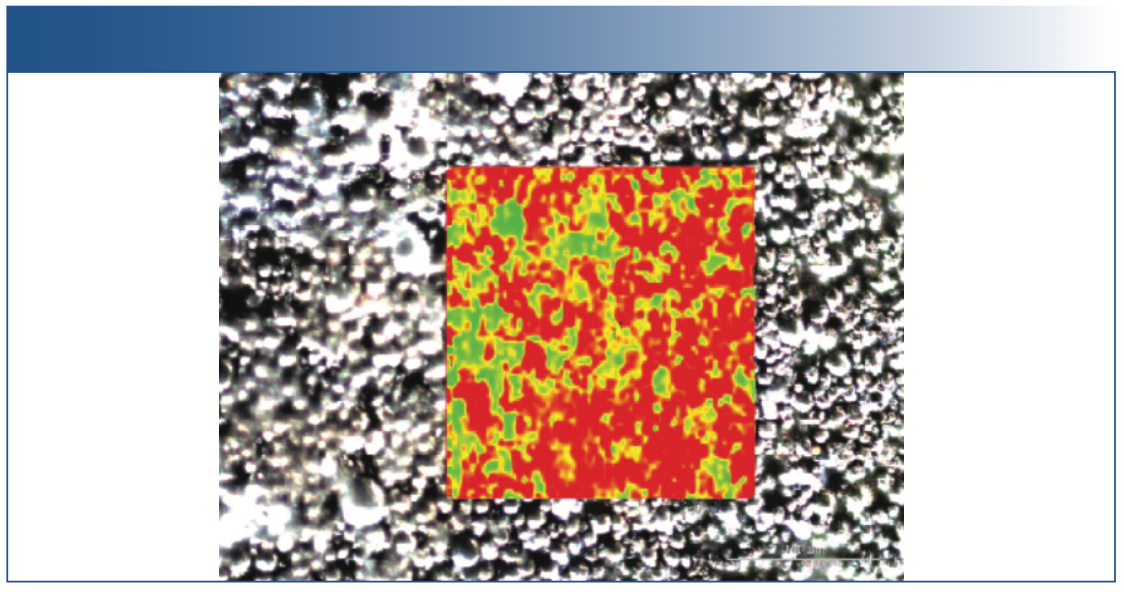
Anode and cathode cross sections are often created for XPS and SEM analysis for morphology and particle distribution analysis, and these cross-sections can often be analyzed using a Raman imaging system. Figure 6 shows such cross-section analysis of an anode.
The micrograph in Figure 7 shows white material; that is, the residual separator material on the electrode after it is removed from the battery and rinsed. The dark area is the anode surface.

. The entire picture (visible image) is approximately 200 μm x 150 μm, and the Raman image (overlay image) is approximately 50 μm x 50 μm in spatial dimensions.")
FIGURE 7: Chemical image with multivariate curve resolution (MCR). The entire picture (visible image) is approximately 200 μm x 150 μm, and the Raman image (overlay image) is approximately 50 μm x 50 μm in spatial dimensions.
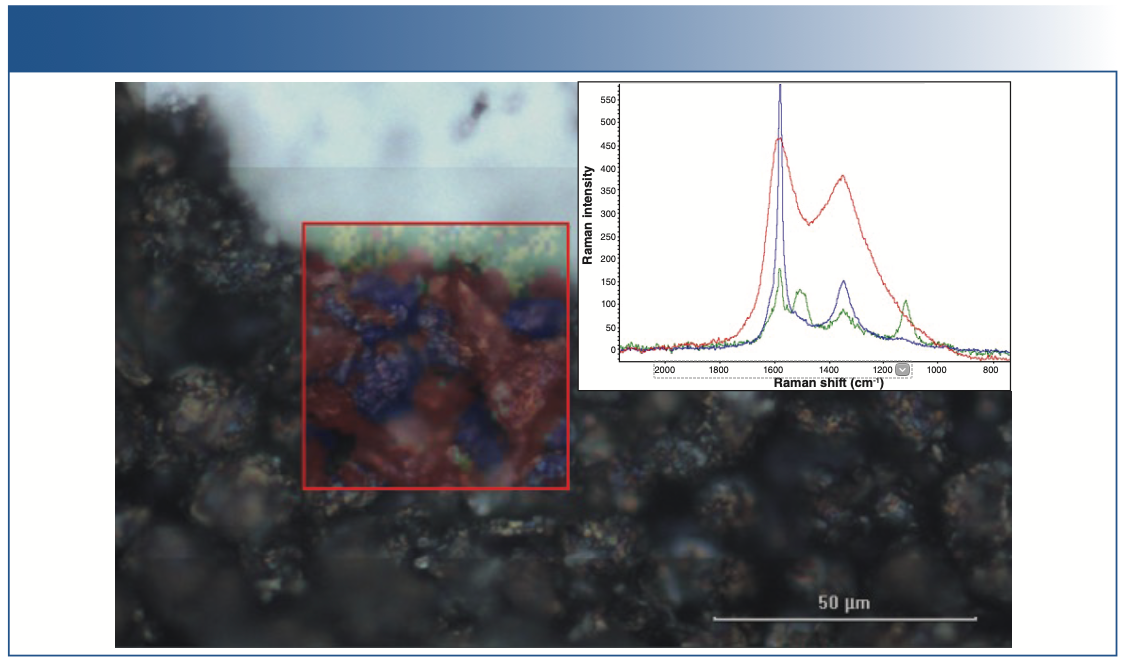
Superimposed in the red square is a chemical image generated from an multivariate curve resolution (MCR) analysis of the Raman data collected over a 50 μm square area of the anode. Red and blue dyed areas represent intensity of the red and blue Raman spectra shown in inset. The red spectrum corresponds to carbon black; blue corresponds to graphite.
MCR reveals the differences in the image so analysts can quickly identify characteristics of the sample, such as inhomogeneous coatings, particle distribution, and physical and chemical differences.
In Figure 7, the image shows just two of the primary components, carbon black and graphite. There are some unique spectral features in the upper left corner of the image. Chemical image contrast (green dye) is generated from peak area of the Raman band at 1117 cm-1 (green inset Raman spectrum). This spectrum also has a unique band at 1504 cm-1, which tracks with the one at 1117 cm-1.
For these peaks, 2-ethylimidazole is a good match. This type of compound is sometimes used in batteries as a safety additive. It decomposes at a high temperature, releasing a gas that increases the cell pressure activating a breaking valve or other safety mechanism.
Conclusion
As the need for more efficient batteries continues to grow, Raman spectroscopy has proven to be an effective tool to study Li-ion batteries and their components. It has many advantages, but the most important ones for battery applications are those that involve subtle changes in molecular structure or local chemical environments, with both in situ and ex situ analysis capabilities. These properties allow Raman analysis to be used in quality control of raw materials, and in the research and analysis of finished materials. There have been significant improvements in commercial Raman instrumentation over the last several years. Important advances in both hardware and software have made modern Raman instruments more user friendly and removed many of the obstacles that, in the past, made routine use of Raman spectroscopy arduous for users with limited expertise.
References
(1) A.C. Menzies, Nature 125, 205–207 (1930). https://doi.org/10.1038/125205a0
(2) R. Singh, Phys. Perspect. 4, 399–420 (2002). https://doi.org/10.1007/s000160200002
(3) J.D. Ingle, Jr. and S.R. Crouch, Spectrochemical Analysis (Prentice Hall, Upper Saddle River, NJ, 1988), pp. 494–524
(4) Sir Venkata Raman—Facts. NobelPrize.org. Nobel Prize Outreach AB 2022. 22 April 2022. https://www.nobelprize.org/prizes/phys- ics/1930/raman/facts/
(5) A. Orlando, F. Franceschini, C. Muscas, S. Pidkova, M. Bartoli, M. Rovere, and A.Tagliaferro, Chemosensors 9(9), 262 (2021). https://doi. org/10.3390/chemosensors9090262
(6) C. Liu, T. Zhang, L. Cao, and K. Luo, ACS Omega 6(39), 25269–25276 (2021). https://doi.org/10.1021/acsomega.1c03050
(7) R.A. Adams, B. Li, J. Kazmi, T.E. Adams, V. Tomar, and V.G. Pol, Electrochimica Acta 292, 586–593 (2018). https://doi.org/10.1016/j.electacta.2018.08.101
(8) J. Wu, I. Byrd, C. Jin, J. Li, H. Chen, T. Camp, R. Bujol, A. Sharma, and H. Zhang, ChemElectroChem 4, 1181 (2017). https://doi.org/10.1002/celc.201700102
(9) C.M. Julien and A. Mauger, AIMS Mater. Sci. 5(4), 650–698 (2018). DOI: 10.3934/mater-sci.2018.4.650
Bruno Beccard is with Thermo Fisher Scientific in Les Ulis, France. Shaileshkumar N. Karavadra is with Thermo Fisher Scientific in Hemel Hempstead in the United Kingdom. Sudhir Dahal is with Thermo Fisher Scientific in Madison, Wisconsin. Direct correspondence to: sudhir.dahal@thermofisher.com.


Evaluating Microplastic Detection with Fluorescence Microscopy and Raman Spectroscopy
July 2nd 2025A recent study presented a dual-method approach combining confocal micro-Raman spectroscopy and Nile Red-assisted fluorescence microscopy to enhance the accuracy and throughput of microplastics detection in environmental samples.

Nanometer-Scale Studies Using Tip Enhanced Raman Spectroscopy
February 8th 2013Volker Deckert, the winner of the 2013 Charles Mann Award, is advancing the use of tip enhanced Raman spectroscopy (TERS) to push the lateral resolution of vibrational spectroscopy well below the Abbe limit, to achieve single-molecule sensitivity. Because the tip can be moved with sub-nanometer precision, structural information with unmatched spatial resolution can be achieved without the need of specific labels.

AI and Dual-Sensor Spectroscopy Supercharge Antibiotic Fermentation
June 30th 2025Researchers from Chinese universities have developed an AI-powered platform that combines near-infrared (NIR) and Raman spectroscopy for real-time monitoring and control of antibiotic production, boosting efficiency by over 30%.


