News|Articles|July 22, 2025

Measuring Protein Content in River Snail Rice Noodles

Author(s)Will Wetzel
Fact checked by: John Chasse

Researchers at China Agricultural University developed a rapid and accurate spectroscopic method using NIR and FT-IR combined with PLS regression to measure protein content in rice noodles, enhancing quality control for the popular river snail rice noodle (luosifen) industry.

Key Points

  • A study published in Food Control introduced a faster, environmentally friendly method for accurately measuring protein content in river snail rice noodles by combining NIR and FT-IR spectroscopy with partial least squares regression (PLSR).
  • The NIR-based model achieved exceptionally high predictive accuracy (r² = 0.99 for training, 0.986 for validation), outperforming FT-IR, and identified key spectral regions linked to protein content.
  • Compared to the traditional Kjeldahl method, this approach requires no chemicals, less time, and minimal sample prep, offering practical benefits for real-time, on-site protein analysis in food production.

A recent study explored a new method that can measure protein content in rice noodles more accurately and efficiently. This study, published in the journal Food Control, tested out a novel method using near-infrared (NIR) and Fourier transform infrared (FT-IR) spectroscopy (1). When combined with partial least squares regression (PLSR), the method proved to be an effective evaluator of river snail rice noodles, important information for food manufacturers as they look to refine quality control processes.

What are river snail rice noodles?

River snail rice noodles, also known as luosifen, are a popular delicacy in the Guangxi Zhang Autonomous Region in China (2). The river snail meat present in these noodles gives it an umami taste that is desirable to consumers (2). Integral to river snail rice noodles is its protein content. As a result, it is important that quality control methods for food manufacturers are able to accurately assess protein content and ensure the best quality river snail rice noodles are sent to market.

What are traditional methods used to analyze protein content and why are they insufficient?

For protein quantification in food products, a popular method food manufacturers use is the Kjeldahl method, an analytical chemistry technique used to determine the nitrogen content in a food product (3). However, the problem with this method is that, while it is accurate, it requires a lot of time and resources. As a result, researchers have been exploring more effective methods to analyze protein content.

In this study, the research team combined NIR and FT-IR spectroscopy with PLSR to determine protein levels in rice noodles. The research team analyzed a wide range of commercial rice noodle samples used in luosifen products. The protein content among the samples varied significantly, ranging from 1.84 to 7.85 grams per 100 grams (1). These differences were largely attributed to varying rice-to-starch ratios in the manufacturing process, which is an issue that can greatly influence both the sensory and nutritional properties of the final product (1).

What did the spectral analysis show?

Using spectral analysis, the team identified specific regions in the NIR spectrum, particularly around 1500 nm and 2500 nm, as being highly responsive to changes in protein levels (1). In the FT-IR spectrum, the amide I band (1681–1695 cm⁻¹) emerged as a critical area for model accuracy (1). These findings provided the foundation for constructing robust calibration and validation models using PLS regression.

The results demonstrated how a combined NIR–FT-IR approach, with assistance from artificial intelligence (AI), can accurately analyze protein content in rice noodles. The researchers found that the NIR-based PLS model achieved a coefficient of determination (r²) of 0.99 for the training set and 0.986 for the validation set, which indicates great predictive accuracy (1). The FT-IR-based model also performed well, with r² values of 0.94 (training) and 0.897 (validation) (1). However, the researchers concluded based on the results that the NIR approach was better.

What are several advantages of the proposed method?

There were several advantages to this proposed method. For one, using spectroscopy was more environmentally friendly and quicker than the traditional Kjeldahl technique (1). Second, the dual spectroscopy method did not require extensive sample preparation or chemical reagents (1). Additionally, because NIR and FT-IR instruments are becoming more portable, it makes them suitable for use on factory floors or even in retail environments (1).

There are several key practical implications from the results of this study. For one, the ability to rapidly assess protein content during or after the production process allows manufacturers to fine-tune their formulations and meet quality benchmarks with minimal delays (1). This is important because it allows manufacturers to ensure regulatory compliance more quickly, which in turn increases consumer confidence (1).

By leveraging NIR and FT-IR spectroscopy alongside advanced chemometric analysis, the team has presented a powerful new tool to support the ongoing growth and standardization of one of China’s most popular food products.

References

  1. Zhang, J.; Cheng, Y.; Tang, N. Rapid Analysis of Protein Content in Rice Noodles Using NIR and FT-IR Spectroscopy for Quality Control of River Snail Rice Noodle Products. Food Cont. 2025, 168, 110906. DOI: 10.1016/j.foodcont.2024.110906
  2. Gao, X.; Yu, M.; Han, X.; et al. Characterization of Odor-active Compounds in Liuzhou River Snail Rice Noodles Soup by Sensory-directed Flavor Analysis. J. Food Comp. Anal. 2024, 131, 106276. DOI: 10.1016/j.jfca.2024.106276
  3. MSE Supplies, Nitrogen Analysis: Kjeldahl Method. MSE Supplies. Available at: https://www.msesupplies.com/blogs/news/nitrogen-analysis-kjeldahl-method#:~:text=The%20method%20of%20analysis%20involves,to%20prevail%20in%20the%20method. (accessed 2025-07-21).


Related to this article

Spectroscopy Top 10 DOI Articles of the Month (September 2026)
The following articles are the most accessed digital object identifier (DOI) manuscripts for Spectroscopy and LCGC International during the month of September 2026. Nine articles are individually ranked here by DOI page views; the third-highest entry (186 views) was recorded against the bare journal-level DOI rather than an individual article and is therefore not attributable to a single manuscript.
2026 SciX Conference Summary ©   Bos Amico -chronicles-stock.adobe.com
SciX 2026, the annual conference presented by the Federation of Analytical Chemistry and Spectroscopy Societies (FACSS), ran October 4–9, 2026, at the Nugget Casino Resort in Sparks, Nevada. The program spanned atomic and molecular spectroscopy, mass spectrometry, chemometrics, and bioanalysis. This report follows the meeting day by day, from Monday's clinical Raman plenaries to Friday's closing talks, drawing on the online program and Spectroscopy coverage of award winners, highlighting efforts to move Raman, SERS, LIBS, and single-particle ICP-MS toward clinical, environmental, and field use.
Atoms Don't Lie–The Remaking of Atomic Spectroscopy, © Hallie -chronicles-stock.adobe.com
Atomic spectroscopy has quietly gone from counting elements in bulk to counting single nanoparticles, imaging tissue at the micrometer scale, and reading Martian rocks from several meters away. The instruments got smaller, the software got smarter, and the questions they can now answer got a lot more interesting.
Tutorial Tuesday: When to Use Infrared Spectroscopy
In this “Tutorial Tuesday” clip, Peter Larkin, who is a Manager of Spectroscopy, Thermal Analysis, and Chromatography at Syensqo, highlights how people use the method or technique that they are comfortable with, even if it’s not the best one to use.
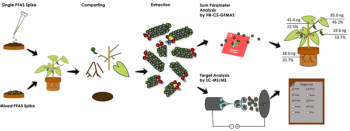
PFAS spiking experiments in bean plants (Phaseolus vulgaris)
Atomic Perspectives
This Atomic Perspectives column explains how high-resolution continuum source graphite furnace molecular absorption spectrometry (HR-CS-GFMAS) quantifies extractable organic fluorine (EOF) as a PFAS sum parameter, complementing LC-MS/MS target analysis, with applications to German river sediments, bean plants, and fluorinated polymer sealing materials.