The Story of ESCA: An Interview with Nobel Prize Winner Kai Siegbahn
This article was originally published in European Spectroscopy News 44 (1982). In this interview, Dave Briggs sat down with 1981 Nobel Prize winner Kai Manne Börje Siegbahn to discuss his career and work in spectroscopy.
Joint winner of the 1981 Nobel Prize in Physics, Kai Manne Börje Siegbahn has been a pioneer of high-resolution photoelectron spectroscopy. His work in nuclear and electron spectroscopy led to the development of the technique he christened ESCA—Electron Spectroscopy for Chemical Analysis. His classic study of electron binding energies and chemical shift phenomena, “ESCA: Atomic, Molecular and Solid-State Structure Studied by Means of Electron Spectroscopy,” commonly known as “the first ESCA book,” was published in 1967 and heralded a revolution in the analysis of surfaces. A second major book, “ESCA Applied to Free Molecules,” followed in 1969.
The son of Manne Siegbahn, who led the way in developing instrumental methods for x-ray spectroscopy and who himself won the Nobel Prize for Physics in 1924, Kai Siegbahn has been Head of the Institute of Physics in Uppsala since 1954, where he has built up a research team that has won renown far beyond their native Sweden. ESN was fortunate to interview Professor Siegbahn recently to learn first-hand how the story of ESCA began.
Professor Siegbahn, the development of ESCA is your most celebrated achievement. How did it happen? Where did the idea come from?
It started in my head before I came to Uppsala. I was working in nuclear physics, like most other physicists at the time. I completed my thesis in 1944 and was looking at nuclear spectral radiation. I had to rely on radioactive samples produced by a cyclotron and the only one we had in Sweden at that time was in Stockholm at my father’s Institute, where I had been developing high-resolution magnetic spectrometers to study beta and gamma radiation. I found I could also use this equipment for gamma radiation using a very thin lead foil to transfer the gamma radiation to electrons. I developed two devices: a homogenous magnetic field which gave very good resolution but, because there was no space focusing, low intensity; and a very big magnetic lens that gave good intensity and moderate space focusing or resolution. I used these two devices for some years but then I began to think of the possibility of combining high resolution and high intensity into one instrument. The idea was to try to shape the magnetic field, which is symmetrical, outwards as a function of radius, to produce an electron optical image at a certain angle. At that time betatrons were used for accelerating electrons, which oscillated in both axial and radial directions. I tried to make the two oscillations coincide. The theory was straightforward: the magnetic field had to vary as:

and the space focusing would occur at

). I used a special mushroom-shaped magnet to achieve this field, then I took a wire net activated with a thorium-B deposit. This isotope has a very strong electron line dominating the rest of the spectrum, so essentially, I had monochromatic electron radiation coming out from that mesh. I put this between the pole pieces in vacuum, and after 255° it finally hit the photographic plate, giving an electron optical image of the wire net. I designed a very large double focusing instrument so that I could magnify and increase the dispersion and resolving power to a very high extent without losing intensity. Before, if you had tried to do that without double focusing, you would have lost all the intensity, but I got it back because all the electrons came back to the central place.
This instrument was designed for nuclear physics, then?
Yes, it was convenient because for electrons of one or several hundred kV it had efficient focusing. At that time, I had some students working with me and we started to use this high-resolution instrument to study decay schemes for radioactive isotopes. One problem which irritated me somewhat was our rather capricious cyclotron which often did not work. I had to sit there and read or do some theoretical work, as I could not get any samples to study. So, I thought I should try to simulate the radioactive radiation by using a method similar to the one I had used for gamma radiation previously, using a foil and an x-ray tube. I thought I should try to concentrate on the converter itself, to see if I could get something out of that and not have to rely on the cyclotron anymore. Of course, I looked up in the literature to see what had already been done in that field. In England, Robinson had done some work along these lines; and in France there was Maurice de Broglie, the brother of Louis, who had shown that you could observe on a photographic plate the shell structure of atoms, showing electron distribution with a fairly defined edge and a long tail.
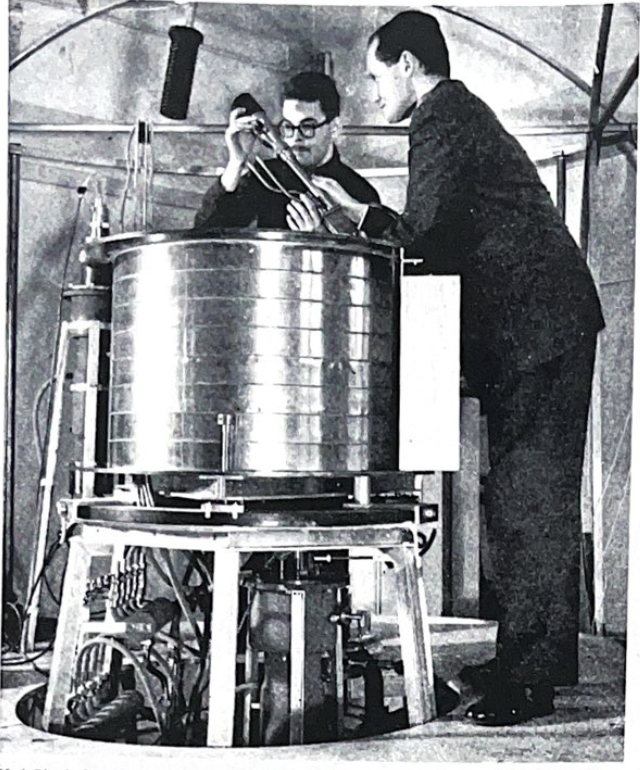
Kai Siegbahn (right) with his assistant Kay Edvason at the first high-resolution iron-free beta-ray spectrometer in 1954. This instrument was converted for atomic spectroscopy by replacing the radioactive source with an x-ray tube and thin converters of evaporated metal, thus becoming the first ESCA instrument.
These looked a bit like x-ray absorption spectra, didn’t they?
Superficially they did. I had a feeling that if I applied my experience in high-resolution beta-ray spectroscopy I might find something. I had to go down in energy a few orders of magnitude to record electrons of about one keV. That was difficult because I wanted to record electrons electrically, not photographically, and in those days, you had to rely on a Geiger-Müller counter fitted with a very narrow window. I had to compensate for leakage through this window, and also for the earth’s magnetic field, to one part in 10^4. It took me a few years to build the instrument. At that time, I moved from Stockholm to Uppsala, taking the instrumentation with me to continue this work.
When was that?
I came to Uppsala in 1954, when the machine was just ready for testing. Because of the high resolution, I was able to measure the inherent width of conversion lines. I could see for example in the thorium-B spectrum the strong F line was much broader than the I line. One emanated from the K shell, one from the L shell. I also looked at the other properties where the high resolution of the instrument was important, such as the influence of the finite nuclear size effect on the conversion spectrum. Then I put in my specially-designed x-ray tube. I should mention that I had looked at the possibility of doing all this as early as 1950. I realized that to compete with, for example, x-ray emission spectroscopy, I must somehow try to reproduce the inherent width of the electron line.
Had Robinson and de Broglie realized that the spectrum they were seeing was essentially the energy loss spectrum?
I don’t think so. But they must have observed that most of the electrons experienced energy losses to a varying extent. They may not have seen the whole quantitative picture, but it was obvious that the electrons coming from the low energy side had lost energy on the way out of the sample.
So, you had a pretty clear idea of what you were trying to do before you began the project?
Oh yes, you don’t start such a project without careful preparation. I first calculated the intensity I expected to have. It was a high-resolution instrument and I had to make compromises between transmission and resolving power. So, I calculated the number of electrons leaving a heated wire in an x-ray tube, to produce the characteristic x-radiation quantum. This x-ray quantum should have particular solid angles for the sample under study, and I looked up the literature to find the photoelectric cross-section for a given element. The next thing I had to figure out was the mean free path–though I didn’t use that phrase at the time! I just said to myself, what is the smallest distance I could base my spectrometry on? Could many electrons escape the sample from a depth of 10,000 Å or so, without losing energy? I made a guess that it was probably more than one single atomic layer, and that it must be smaller than a light wave, perhaps 100 Å. That was not a bad guess when you consider what happened later on. I calculated from the total number of photoelectrons created how many came from that depth below the surface, as only those were useful for me. But when I took some samples from the shelf and ran them, I did not see anything. It was a great disappointment. I started to think about what I had actually put into my calculations and realized that if it had a mean free path of only 100 Å, the slightest layer of dirt on the sample would make the whole thing meaningless. So, I very carefully prepared a sample by evaporation and put it very quickly into the spectrometer, instead of just taking it straight from the bottle. We immediately started to get beautiful spectra with all the characteristics I had been hoping for: very sharp lines, and the width very close to the expected contribution from the spectrometer itself. So, we had the inherent width of the level under study plus the width of the copper x-radiation.
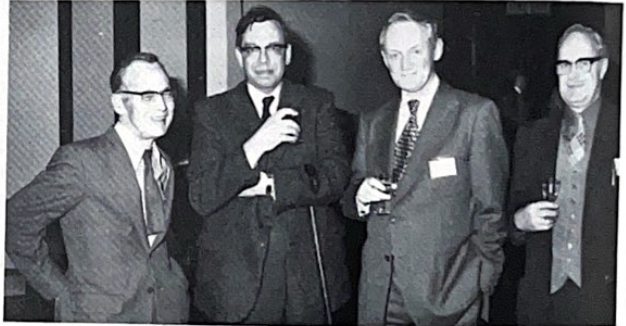
At a conference in Durham, England, in 1976, Kai Siegbahn (second from right) with Prof. W. C. Price (London), Prof. E. Heilbronner (Basel), and the late Dr. Harry Hallam.
Which was your first photoelectron spectrum?
One of the first elements we studied was magnesium. The reason for that was that in my previous work I had been an assistant on an electron microscope and had found that magnesium oxide was a very convenient sample to look at. I was therefore used to preparing it, so that’s why we tried it! We learned how to magnify the energy scale 100 times, until we got a line coming up at the edge which had never previously been resolved. With this resolution and the symmetric line, we could measure with just a tenth or twentieth of the line width. From then, development of electron spectroscopy was straightforward. But even though the prospects looked fine, there still remained a lot of work to be done. We had to record every spectrum point by point, and everything was home-made.
How many counts did you have?
We got about what we expected, about 1000 per minute. Everything fitted.
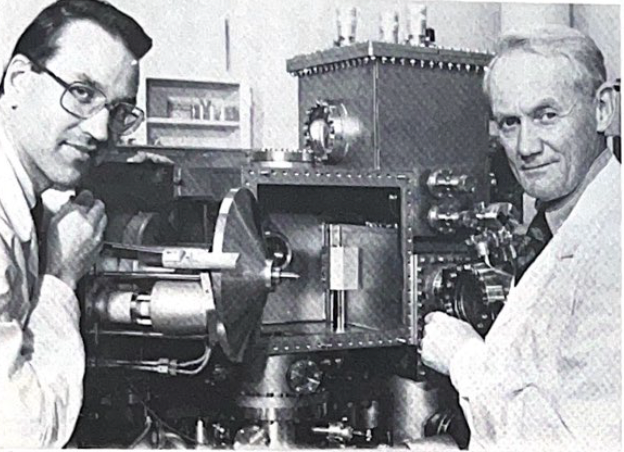
Kai Siegbahn and his coworker, Dr. Ulrik Gelius, at one of the new generation of ESCA instruments in 1978. (photo Fred Eklöw, Uppsala)
How did the chemical shift discovery come?
That was a rather strange story. It shows just how science works. I had the idea of looking for atomic effects in some alloys, from an atomic physics rather than a chemical point of view. We had observed in 1957 differences between copper and copper oxide, and we published a paper on their chemical shifts and another on the corresponding Auger line. With our equipment, it was not easy to get these small differences measured with high accuracy the first time. So, we concentrated on measuring the atomic binding energies. We tried to study binding energies systematically, as a function of atomic number, as Moseley had done in x-ray spectrometry, but we aimed to study deviations from these regular trends. When we used a non-metallic substance, we got jumps from the nice straight lines. We were very annoyed to see these of course, until a few years later we put in sodium thiosulphate and from the same molecule, we got two discrete sulphur lines, which we could measure carefully. Then of course, we really felt we had something interesting. We made systematic studies of sulphur, which has a large chemical shift and discovered the dependence of the valence states on the core level binding energy.
Did you have many students and coworkers helping with all this?
Yes, I had some very valuable colleagues. Kay Edvarson came with me to Uppsala from Stockholm–he was very good and got the electron spectrometer working. Then he went back to Stockholm, and I got two new students. Evelyn Sokolowski and Carl Nordling, who were to become very close associates. After that, I got a lot of good students, one after the other, because it was a fine field to do a doctor’s thesis in–there was so much to measure and write papers on. Having so many students was a great help– there was so much to do. We ran a shift system with a four-hour shift for each member of the team, day and night, Saturday and Sunday–we never stopped. We worked for a whole year like that.
And this was on the one magnetic instrument?
Yes.
Was it reliable?
On balance, yes. Sometimes it caused us trouble but as a rule it was running. After a year, we had collected such a tremendous amount of material that we decided to write a whole book about it. That was the first ESCA book, which we published in 1967.
One gets the impression that the rest of the world really found out what had been going on in Uppsala all this time only when this first book came out. Was that true, or had many people come to know what your group was doing?
No, our work wasn’t too well-known up to then. We did publish a few minor things in Physical Review Letters but got no response whatsoever. We also published in Arkiv für Physik, the journal of our Academy, but that was not read by many people, especially as it appeared two years after the publication was accepted! So really, we had rather a pleasant time. We could get on with our work without being bothered by people who had read about it in the literature!
Now, of course, these papers are regarded as classic. When you wrote the first ESCA book, did you realize quite what the applications would be in surface science?
Well, it was difficult to foresee to which extent, of course. When we wrote the book, we didn’t foresee such development as took place during the 1970s–it was far greater than we expected.
After the book came out, there must have been plenty of visitors to your laboratory!
Oh yes. There was a lot of interest–many people were surprised to get a whole new spectroscopy in one book like that. And then, various firms came to Uppsala to find out whether they could make commercial instruments. I had visits from AEI, VG, McPherson, and so on. But then, I went to the United States for a sabbatical year at Berkeley just after the book appeared, and one day Don Hammer from Hewlett-Packard came to ask whether I would work as a consultant for them to develop a commercial instrument. Since they were situated at Palo Alto, very close to where I was working. I agreed and enjoyed a very pleasant cooperation with them.
You had also started to build electrostatic analyzers, hadn’t you?
We had begun that around 1964. We were working in a low-energy region and thought that it would be a good idea to try the other way. We worked mainly on excitation with electrons and with UV on that instrument.
You were doing UV?
Yes, though I had had no real contact with people like Turner in England and some of the German groups. As a matter of fact, I got to know about their work when Mulliken came to Sweden to get his Noble Prize. I showed him our valence spectrum of frozen benzene; he had just been to England, and he asked if I knew about Turner’s work, and I did not. So, I read up about it, and from then on, we were working along parallel lines with UV excitation.
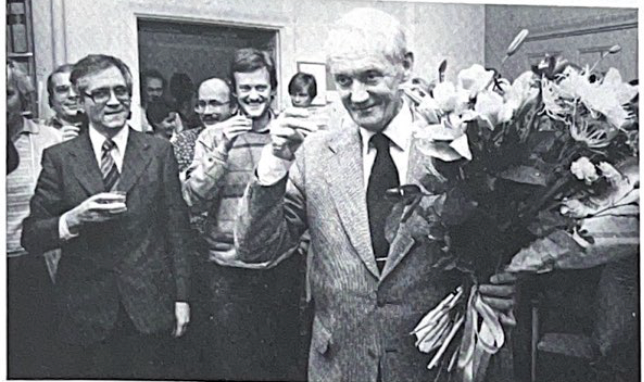
19 October 1981: The new Nobel Laureate at an improvised reception in the library of his Institute. To his right are his son Dr. Hans Siegbahn, also an ESCA spectroscopist, Professor Ingvar Lindgren, and his long-time colleague Professor Carl Nordling. Following international tradition on occasions like this, champagne is served in plastic glasses! (photo courtest UNT Bild. Uppsala)
You also went back to x-ray emission spectroscopy, didn’t you?
Yes. This was because we started to observe vibrational fine structure in core electron lines in ESCA at very high resolution–methane was an example. I was a little bit afraid when we began to get these results that the work could also be done by high resolution x-ray emission techniques, so I thought I’d better try that too! We used a grating at grazing incidence to develop x-ray emission spectroscopy for free molecules. That work is still going on in our laboratory. Another thing which was rather strange was that in order to increase the resolving power in ESCA one had to monochromatize x-radiation. I had previously worked on small-angle scattering of x-rays on large particles like latex and biological molecules, so I thought I could try double focusing for x-rays to increase intensity in the low-angle rays. I tried to see whether I could bend the crystal spherically instead of cylindrically to get point focusing; that was successful, and I took out a patent on it. People weren’t very interested at the time, but ten years later, I realized that it would be perfect in combination with electron spectroscopy–though by then, the patent had expired! But I think it was essential to the later development of ESCA to be able to get high intensity monochromatic radiations by means of spherical quartz crystals. Most instruments use these now.
Can we take you back to the very beginning? What originally decided you on a scientific career? For many young men, having such a celebrated father would be an inhibition.
I was interested in mathematics and physics, and I was encouraged by my parents maybe to become a medical doctor, specializing in x-rays and therefore combining physics and medicine. For a short while I considered this, but I was really interested in scientific work, and I had this inspiration from my father, and from my whole surroundings. I had been living in the university all my life, and my parents had many scientific colleagues who came to my hone, where I also heard about chemistry.
Did your father take you to his laboratory?
Oh yes–he wanted company! I had a brother who was not interested, so he concentrated on me. He took me to his laboratory and put me on a chair, and I tried to follow his experiments. I didn’t understand much of course, but it was fascinating. He made the room dark, and I saw the x-ray discharge and he showed me some plates.
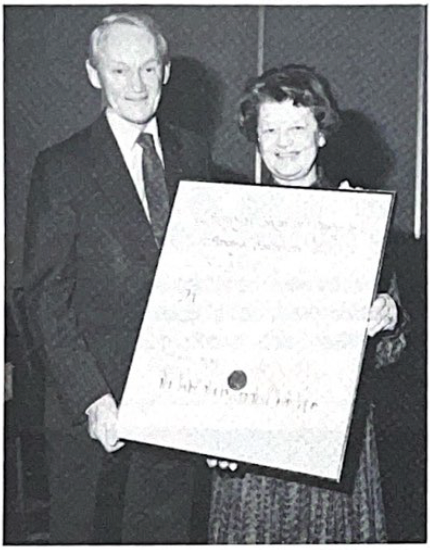
Professor Siegbahn with his wife after receiving the Pittsburgh Spectroscopy Award in Atlantic City, USA, earlier this year.
What sort of work did he do in later years?
His own publications tailed off at the end of the 1930s because he decided that he could not contribute much more to x-ray spectroscopy. He was a physicist; he didn’t want to apply x-rays to something other than the atom. He was convinced that the future was in nuclear physics, which he decided to go into though it was a new field for him. He put a lot of effort into founding the Nobel Institute for Nuclear Physics in Stockholm, and he was director there for 27 years. But much of his work then was administrative, though he organized the laboratory very successfully. He led an excellent team and supervised the construction of the cyclotron. He never lost his interest in physics–even at the age of 90 when he had forgotten most other things, like the names of his grandsons, he never forgot his physics. I could call him up and say “Papa, today I did this” and he would say “Oh, and what did you see?” He was always very interested in my work–it gave him much satisfaction.
Did you work much with him?
Unfortunately, we only published one thing together, and that was a history of the Nobel Prize!
How appropriate! It is a pity he didn’t live long enough to see you receive it.
Yes, I received it only two years after his death.
You spent a number of years on the Nobel Prize Committee, didn’t you?
I was active on the committee during the 1960s and the early part of the 1970s. Then, people began to suggest my name for a Prize, so I thought I had better leave the committee, and I have not had anything to do with their work now for 6 or 7 years.
Was it very time-consuming?
Well, you had to be very careful with your judgments, and you had to read the source material and think carefully about the work, not only listen to what other people had to say. It is very interesting work.
Although winning the Nobel Prize could not have come as a complete shock to you because you had been suggested when you were on the committee, how did you feel when you heard the news?
It is pretty crowded on the hill! Seriously, I had not thought about it for some time, and when I got the news, I was very gratified. It has been a very busy, hectic time since then of course, with invitations to travel all over the world.
While all this work was going on, did you have any time for any other activity, or were you were working hard all the time? Did you have any leisure activities?
Yes, of course. I have lots of interests outside my scientific work. I like to play tennis for example, and other games too. I am also very interested in music and skiing.
Do you play an instrument?
I used to play the violin and the piano, but now I just play records!
Do you have any strong views about the name of the technique, ESCA or photoelectron spectroscopy?
No, not really. I am a little hesitant about using the term x-ray photoelectron or photoemission spectroscopy–I miss the E for electron in the initials XPS and prefer PES or ES. ESCA is a good term for the whole field. Actually, I have always been a bit reluctant to call the technique by a name which excluded Auger electron lines, because they are always there, and they give much complementary information. That is one of the reasons why I prefer to use the wider term “electron spectroscopy,” and I added “for chemical analysis” because we had found that we could analyze all elements in the same intensity. That I thought was a good feature. Later on, when we found the chemical shift, that added to the chemical information we could get. I thought it would be good to have a word for the spectroscopy, which included everything like this.
What work is your group doing now?
We have built a new laboratory, and we have a loosely-structured research programme that covers a lot of things we are interested in now. It wouldn’t be science if we knew exactly what we will be doing in a year’s time! But I think that the combination between laser techniques and electron spectroscopy is going to be very exciting. Then there is ESCA diffraction on surfaces to study their geometrical properties, and there is much to be done in the field of liquids. It will be interesting to see whether ESCA can be a useful source of information in addition to the usual physicochemical methods available for liquids–it looks promising. Another contributing factor to the growth of ESCA has been synchrotron radiation. This has been an extremely fine addition to the field: we will hear much more about it in the future.
In the last few years, have you been concentrating on building new instruments?
We have been working very hard on that, and we are glad that we will soon be finished with that programme, because after all, we are scientists, and we want to use our instruments. But we have now run our first spectra with the new system. It gives new results, with very high resolution at high intensity.
What new technology has most affected the ways in which you work?
We have had to learn computer techniques, which were of course a necessity to introduce into ESCA, and to use computer software for quantum chemical calculations. I belong to a generation which did not study computers, but my students have been brought up knowing about these things. Two of my sons are working in theoretical and experimental physics and quantum chemistry, and they came into science when computers were the norm.
One of your sons works with you, doesn’t he?
Yes, my second son Hans is working on liquids. He is an experimentalist, while Per, the eldest, is a pure theoretician, currently working in Stockholm on a very advanced program for configuration interaction calculation.
And your third son?
Nils is a little younger than the others. He has taken a chemical engineering degree and an economics degree, and now he is working on his thesis in biotechnics. He wishes to go into industry.
Have you any thoughts of retiring?
No, I haven’t. I hope to go on with my research independently. The new laboratory is connected with the Institute, though it is not quite settled just what the relationship will be. As long as I am still head of the Institute there is no problem, but anyway, I have a small room in the new laboratory, which remains my right as a professor. But there are still a few years left to my retirement, and a great deal still to do!
Fluorescence Emission and Raman Spectroscopy Offer Greater Insight into Poultry Meat Quality
June 19th 2025Researchers from the Institute of Agrifood Research and Technology (IRTA) in Catalunya, Spain used fluorescence and Raman spectroscopy to explore complex tissue changes behind wooden breast myopathy in chickens.
The Role of ICP-OES in Analyzing the Metal Content in Pet Food
June 19th 2025Because the United Arab Emirates is seeing an increase in pet ownership, the quality of both dry and wet pet food is undergoing greater scrutiny to ensure its safety and efficacy. Lucy Semerjian, who works as a Chair and Associate Professor in the Department of Environmental Health Science at the University of Sharjah in Sharjah, United Arab Emirates, recently explored this topic in a recent paper
Pet Food in the United Arab Emirates: An Interview with Lucy Semerjian
June 18th 2025A recent study conducted in the Journal of Food Composition and Analysis examined the concentrations of ten metals in 52 commercially available wet and dry cat food samples, assessing their compliance with U.S. and European pet food safety standards. The lead author of this study, Lucy Semerjian, recently sat down with Spectroscopy to discuss the findings of her study.